 Multi-family
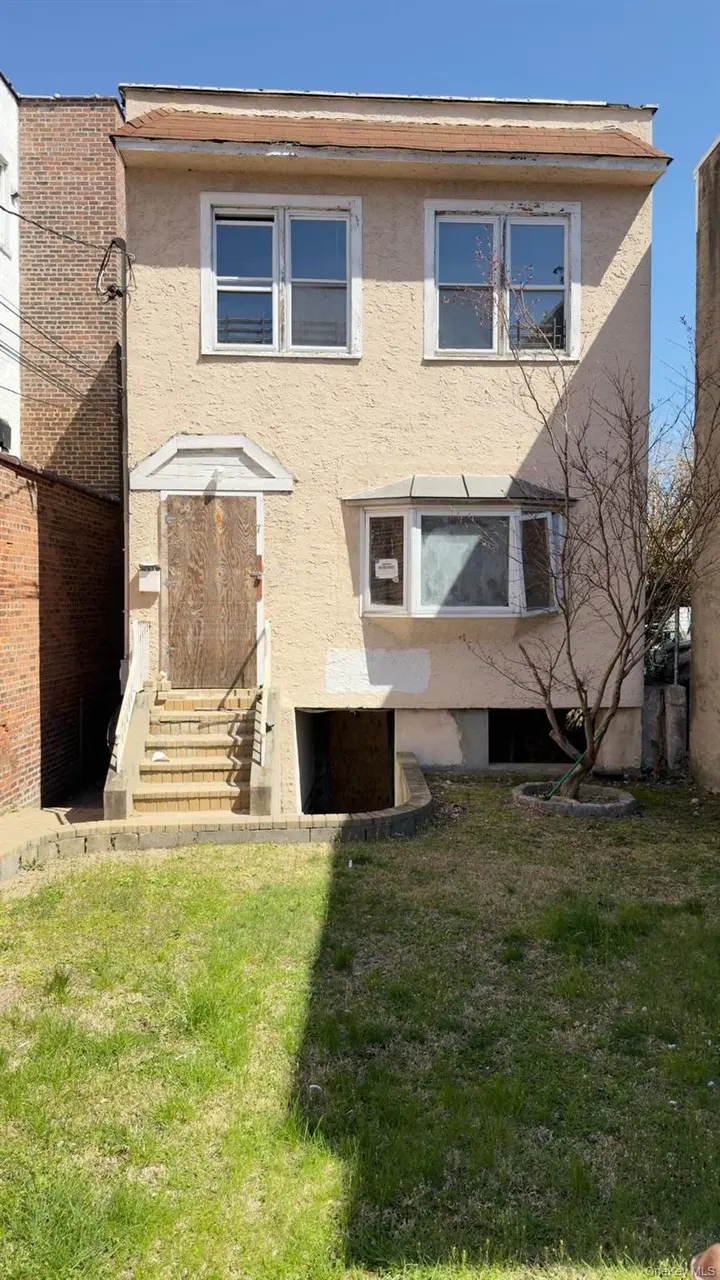
7 6th St · New Rochelle, NY
Flood risk 1/10 · Minimal
- FEMA flood zone
- X (unshaded)
- Chance of flooding over 30 yrs
- 0.0%
- Est. flood insurance / yr
- $507 – $1,088
Fire risk 1/10 · Minimal
- Est. fire insurance / yr
- $691 – $1,283
Heat risk 6/10 · Moderate
- Hot days now (above 98°F)
- 7 days/yr
- Hot days in 30 yrs
- 15 days/yr
Wind risk 6/10 · Moderate
- Chance of severe wind over 30 yrs
- 27.0%
Air-quality risk 5/10 · Moderate
- Unhealthy air days now
- 6 days/yr
- Unhealthy air days in 30 yrs
- 8 days/yr
Risk factors via First Street. Map © Google.
Why this score? — see what drove the D+ grade
The composite is a weighted blend of 9 inputs, each scored 0–100. Each bar is that input's sub-score; the figure is the points it added to the 100-point composite (weight × sub-score).
- Cash flow +17.4/30.0
- ARV discount +7.5/15.0
- Schools +5.7/10.0
- DSCR +5.4/10.0
- 1% rule +5.1/10.0
- Livability +3.5/5.0
- Rent growth +2.9/5.0
- Condition / age +2.5/5.0
- Appreciation +0.0/10.0
$399,000
🖨 Deal sheet (PDF) 📄 Offer letter ✓ Due diligence
Multi-family units
County records classify this as Multi-Family (2-4 Unit). Listing-text estimate: 1 unit. estimate disagrees with records
Listing remarks MLS
This property offers excellent potential for investors or end users looking to customize, renovate, and add value. With a flexible layout and strong upside potential, it presents a great opportunity for a renovation or investment project. Conveniently located near public transportation, schools, parks, shopping, and other neighborhood amenities, it provides easy access to daily conveniences and major roadways.
Key facts
- 2,614 sq ft lot
- Built 1908
- Listed 71 days
Neighborhood map
What this means for you Summary
Snapshot
- This is a 4-bed/2.0-bath multifamily listed at $399k.
Deal economics
- At list price, monthly cash flow is $301 ($4k/yr) — positive.
- The deal already cash-flows at list — no discount required.
- Meets the 1% rule at list price ($4k rent vs $399k).
- Recommended offer: $375k (6.0% below list) — sets the bar for market timing.
- Cap rate 7.2% vs local median 4.5% in New Rochelle — top-decile yield for the area; either an underpriced asset or a hidden risk that comps aren't pricing in. Stress-test before assuming the spread holds.
Location & tenants
- Location reads 69/100 on livability (#487 in NY) — a middle-class / working-renter tenant base. Strengths: employment A+, crime A, amenities B+; Watch: housing D+, commute F, cost of living F.
- New Rochelle City School District (suburban): math 63% / reading 66% proficiency, ranked #171 of 590 in NY (top 29%) — acceptable for families but not a draw, mixed tenant base, ~2y average lease.
- Market conditions: Rents rising (+1.4%/yr); 141 active listings in the ZIP; 13 comparable units currently listed for rent nearby; rentals lingering (median 45d on market — plan ~5-8 weeks vacancy on turnover, expect pricing pressure); 54% of comp listings sitting > 30 days — soft ceiling on asking rent; solid renter incomes; 954 units permitted in Westchester County in 2024 (649 in 5+ unit buildings).
- At $4,020/mo this rent would consume 56% of the median local household income ($86k/yr) (locally 2797% of renters already pay >50% of income on rent) — very limited rent-growth headroom before tenants either downsize or default.
Forward outlook
- Local home prices are declining (-3.0%/yr); year-one equity from $3k of loan paydown is wiped out by about $12k of value loss. Plan a longer hold.
- Westchester County population projected at +10% by 2050 — modest demand growth; plan on rents tracking national, not racing it.
Negotiation context
- It's been on market 72 days — a 6% lower offer ($375k) is reasonable based on typical stale-listing flexibility.
Risks & watch-outs
- Watch-outs: built in 1908 — expect roof / HVAC / electrical / plumbing capex.
- Climate carrying-cost: major wind risk, 27% chance of damaging wind over 30y; extreme-heat days projected 7→15/yr by 2055 (HVAC capex compounding) — expect insurance premiums to compound above CPI over the hold.
Questions for the listing agent
- It's been on market 72 days. Have you received any prior offers? Is the seller open to a 6% concession, seller financing, or rate buy-down credit?
- Built in 1908 — when were the roof, HVAC, electrical panel, plumbing, and water heater last replaced?
- Why hasn't it sold? Are there any deal-killer items the seller is aware of (foundation, flood, title, zoning, code violations)?
- Is there a deadline driving the sale (1031 exchange, divorce, estate, relocation)? That informs how much negotiation room exists.
- The area grade is low — what's the realistic commute time and amenity access for the typical tenant pool here? Any planned neighborhood developments (good or bad) we should know about?
- What's the average days-on-market for RENTAL listings here right now (not sales)? A rising rental-DOM trend means longer vacancies and softer asking-rent achievability than the comps imply.
- What's the recent tenant-quality profile in this submarket — average credit score on applications, eviction rate, late-payment / NSF rate, and stable-employment percentage? A property-management company in the area should have these aggregated.
- How much new apartment / multifamily construction is in the pipeline within 1–3 miles? Heavy new supply (>2% of stock underway) typically softens rents 12–24 months out; light construction supports rent growth.
Investment metrics
- 1% rule
- 1.01% ✓
- Cap rate
- 7.20%
- Cash-on-cash
- 3.23%
- DSCR
- 1.14
- GRM
- 8.3
CMA / ARV
- ARV (median comp)
- $1,371,023
- List price
- $399,000
- Delta
- -70.90%
- Verdict
- UNDERPRICED
- Comps
- 20 within 1.0 mi
Show comp detail 1 sale within ~0.75 mi
| Address | Dist | Beds/Ba | Sqft | Sold | Price | $/sf | Match |
|---|---|---|---|---|---|---|---|
| 301 Sickles Ave | 0.37mi | 5/2.0 (+1) | 1,363 (-12%) | 17mo | $850,000 | $624 | 43 |
Match score weights: distance 35% · size 25% · config 20% · recency 20%. Top-matched comps best support the ARV.
Projected returns pro-forma
-3.0% appreciation · 1.42% rent growth · sell at horizon
- IRR
- -13.0%
- Equity multiple
- 0.54×
- Total profit
- $-51,668
- Equity at exit
- $59,492
- IRR
- -6.8%
- Equity multiple
- 0.60×
- Total profit
- $-44,808
- Equity at exit
- $34,498
Cash invested: $111,720 (down + closing). Projections, not guarantees.
Landlord ↔ Tenant lean methodology
- Overall (STATE)
- 15 Strongly Tenant-Friendly
- State New York
- 15 Strongly Tenant-Friendly · D+10
- County
- — inherits STATE
- City
- — inherits STATE
ZIP-level market 10801
- Rents YoY
- 1.4%
- Active inventory
- 141
- Price-to-rent
- 8.3×
Monthly cashflow live
- Estimated rent
- $4,020 high interval (Pro) →
- Mortgage (P&I)
- −$2,092
- Tax from tax record
- −$617 /mo · $7,399/yr
- Insurance
- −$166
- HOA
- −$0
- Vacancy / Maint / Mgmt
- −$844
- Net cashflow
- $301
Break-even live
Sensitivity live
| Price | -10% $526 | -5% $414 | +0% $301 | +5% $188 | +10% $75 |
|---|---|---|---|---|---|
| Rent | -10% $-17 | -5% $142 | +0% $301 | +5% $459 | +10% $618 |
| Rate | -1.0pp $502 | -0.5pp $402 | base $301 | +0.5pp $197 | +1.0pp $92 |
UW: 25.0% down · 7.5% · 30yr · 1.5% tax · 5.0% vac · 8.0% maint · 8.0% mgmt
Financing live
Cash to close
- Down payment
- $99,750
- Closing costs
- $11,970
- Reserves months
- —
- Total cash needed
- —
Loan-product check · same deal, 3 products live
Conventional
25% down · 7.5% · 30yr
- Down + closing
- —
- Monthly P&I
- —
- Monthly cashflow
- —
- DSCR
- —
- Eligible?
- —
Personal DTI + credit; lowest rate.
DSCR
20% down · 8.5% · 30yr
- Down + closing
- —
- Monthly P&I
- —
- Monthly cashflow
- —
- DSCR
- —
- Eligible?
- —
No personal income docs; deal must DSCR.
Hard money
10% down · 12.0% · 12mo
- Down + closing
- —
- Monthly P&I
- —
- Monthly cashflow
- —
- DSCR
- —
- Eligible?
- —
Short-term bridge; refi at stabilization.
Rent comps 13 comps
| Address | Beds | Baths | Sqft | Rent | $/sqft | DOM | Units | Dist |
|---|---|---|---|---|---|---|---|---|
| 9 9th St Unit 1st Floor New Rochelle, NY | 3.0 | 1.0 | 1463 | $3,400 | $2.32 | 45d | 1 | 0.19mi |
| 194 Webster Ave Unit 1 New Rochelle, NY | 3.0 | 1.0 | 1050 | $3,500 | $3.33 | 45d | 1 | 0.30mi |
| 379 Huguenot St Unit 2 New Rochelle, NY | 3.0 | 1.0 | 1150 | $3,200 | $2.78 | 25d | 1 | 0.59mi |
| 133 Lincoln Ave Unit 1 New Rochelle, NY | 3.0 | 1.0 | 1112 | $6,500 | $5.85 | 3d | 1 | 0.67mi |
| 40 Memorial Hwy New Rochelle, NY | 3.0 | 1.0–2.0 | 917 | $4,580 | $4.99 | 0d | 50 | 0.72mi |
| 55 Clinton Pl New Rochelle, NY | 3.0 | 1.0–2.0 | 991 | $6,747 | $6.80 | 0d | 24 | 0.80mi |
| 123 Clinton Ave Unit 2 New Rochelle, NY | 4.0 | 2.0 | 1378 | $4,250 | $3.08 | 45d | 1 | 0.91mi |
| 14 Horton Ave Unit 3rd Fl New Rochelle, NY | 4.0 | 1.0 | 1300 | $3,600 | $2.77 | 45d | 1 | 0.97mi |
| 26 Coligni Ave Apt 12 New Rochelle, NY | 3.0 | 1.0 | 1100 | $3,950 | $3.59 | 45d | 1 | 0.98mi |
| 72 Soundview St Unit 2 New Rochelle, NY | 4.0 | 2.0 | 1500 | $3,850 | $2.57 | 45d | 1 | 1.11mi |
| 25 Acacia Ter Unit 1 New Rochelle, NY | 3.0 | 2.0 | 1400 | $3,800 | $2.71 | 45d | 1 | 1.21mi |
| 7 Alpha Pl Unit First floor New Rochelle, NY | 3.0 | 2.0 | 1538 | $4,700 | $3.06 | 20d | 1 | 1.22mi |
| 222 Lorraine Ave Mount Vernon, NY | 4.0 | 1.5 | 1948 | $5,500 | $2.82 | 8d | 1 | 1.23mi |
Listing history 15 events
-
2026-06-21days on market $399,000 Active 72 DOM
-
2026-06-18days on market $399,000 Active 69 DOM
-
2026-06-17days on market $399,000 Active 68 DOM
-
2026-06-16days on market $399,000 Active 67 DOM
-
2026-06-15days on market $399,000 Active 66 DOM
-
2026-06-13days on market $399,000 Active 64 DOM
-
2026-06-09days on market $399,000 Active 60 DOM
-
2026-06-08days on market $399,000 Active 59 DOM
-
2026-06-07days on market $399,000 Active 58 DOM
-
2026-06-04days on market $399,000 Active 55 DOM
-
2026-06-03days on market $399,000 Active 54 DOM
-
2026-06-02days on market $399,000 Active 53 DOM
-
2026-06-01days on market $399,000 Active 52 DOM
-
2026-05-31days on market $399,000 Active 51 DOM
-
2026-04-09$399,000 Active 413-char remark
Show marketing remark (413 chars)
This property offers excellent potential for investors or end users looking to customize, renovate, and add value. With a flexible layout and strong upside potential, it presents a great opportunity for a renovation or investment project. Conveniently located near public transportation, schools, parks, shopping, and other neighborhood amenities, it provides easy access to daily conveniences and major roadways.
ⓘ Source: listings_history table (triggers on properties + properties_extension) + one-shot
backfill from property_details.listing_events for pre-trigger history.
Tax reassessment forecast NY · Partial reset (capped growth)
- Current annual tax
- $7,399 · $617/mo
- Projected year-2 tax
- $7,399 · $617/mo
- Expected delta
- $0/yr ($0/mo · 0.0%)
ⓘ Screening estimate from a state-policy table — verify with the county assessor before closing.
Climate risk First Street
- Flood 1/10 Low FEMA zone X (unshaded) · 0% chance over 30 yrs
- Wildfire 1/10 Low
- Heat 6/10 Major 7 d/yr ≥98°F today · 15 d/yr by 30 yrs out
- Wind 6/10 Major 27% chance of damaging wind over 30 yrs
- Air quality 5/10 Major 6 unhealthy d/yr today · 8 by 30 yrs out
Nearby sold comps map
Loading sold comps map…
Walkable amenities ~0.75 mi
Loading nearby amenities…
Taxation est. · year 1
- Rental income
- $48,241
- − Mortgage interest
- −$22,350
- − Property taxes
- −$7,399
- − Insurance
- −$1,995
- − Repairs & maintenance
- −$3,859
- − Management
- −$3,859
- − Depreciation
- −$11,607
- Taxable loss
- −$2,829
- Est. tax savings @ 24.0%
- +$679
- After-tax cash flow
- $4,286/yr
For passive investors: Depreciation is non-cash, so a rental often shows a tax loss while cash-flowing — sheltering income. Rental losses are passive: they offset passive income freely, and up to $25,000/yr can offset ordinary (W-2) income if you actively participate and your MAGI is under $100k (phasing out to $0 by $150k); unused losses carry forward. On sale, claimed depreciation is recaptured at up to 25%, and gains may owe capital-gains tax (a 1031 exchange can defer both). Figures are a year-1 estimate at your 24.0% rate — not tax advice; consult a CPA.
Schools (NCES district)
- District
- New Rochelle City School District
- NCES district ID
- 3620490
- Math proficiency
- 63% ▲ 3.00%
- Reading proficiency
- 66% ▲ 9.00%
- Median HH income
- $69,165
- Composite
- 56.63/100
- National rank
- #1139
- State rank
- #171 of 590 in NY
Livability — New Rochelle
- Score
- 69/100
- State rank
- #487
- US rank
- #8572
Category grades
Schools grade is shown separately in the Schools card above.
Census & demographics
- Census place
- New Rochelle, NY
- County
- Westchester County · 709,332 people
- City population
- 63,657
- Metro
- New York-Newark-Jersey City, NY-NJ-PA
- Population (ZIP)
- 42,754
- Household income
- $85,573
- Rent vs Own
- Severe rent burden
- 2797.0
Population outlook (Westchester County) Hauer SSP2
- Today (2025)
- 1,028,035 people
- By 2030
- 1,051,636 · +2.3%
- By 2040
- 1,098,520 · +6.9%
- By 2050
- 1,136,044 · +10.5%
- By 2075
- 1,196,925 · +16.4%
- By 2100
- 1,175,147 · +14.3%
Race, ethnicity, and origin ACS 2023
- Neighborhood character
- Highly diverse neighborhood (Simpson 0.72)
- Race & ethnicity
- Hispanic / Latino 36% White 30% Black 24% Two or more races 16% Asian 7%
- Hispanic origin (detail)
- Mexican 17% Puerto Rican 5% Dominican 3%
- Common ancestry
- Hispanic 3% Scotch-Irish 1% Romanian 1%
- Foreign-born
- 34% · Canada, Jamaica, China
- Languages at home
- 54% English-only · Spanish 32% Other Indo-European 5% French/Haitian/Cajun 4%
Political lean MEDSL · Westchester
- 2024 margin
- Strong D (+26.3) · D 63.1% · R 36.9%
- 2008→2024 swing
- -1.3pp toward R · 2008: 27.6pp · 2024: 26.3pp
- All cycles
- 2024: D+26.3 2020: D+36.3 2016: D+32.8 2012: D+22.2 2008: D+27.6
Not yet ingested
- Civics
- —
Market trends
- HPI YoY
- ▼ -910.37%
- Current HPI
- 270.8019
- Rent YoY
- ▲ 1.42%
- Metro
- New York-Newark-Jersey City, NY-NJ-PA
- State GDP YoY
- ▲ 2.60%
- F500 in state
- 92
Industry mix (Fortune 500 HQ in NY)
| Industry | F500 HQs | Revenue |
|---|---|---|
| Financial Services | 10 | $950B |
|
||
| Consumer Goods | 9 | $162B |
|
||
| Insurance | 4 | $225B |
|
||
| Telecommunications | 2 | $144B |
|
||
| Pharmaceuticals | 2 | $112B |
|
||
| Media / Entertainment | 2 | $69B |
|
||
Price history
1 event — show timeline
- 2026-04-09 Listed $399,000 OneKey® MLS as Distributed by MLS Grid
Property tax history
-2.8%/yrLatest (2025): $7,399 · -24.5% YoY. Source: county tax records.
Cash-flow waterfall
monthlySold comps — $/sqft
last 12 mo · ≤1 miLoading sold comps…