 7-Plex
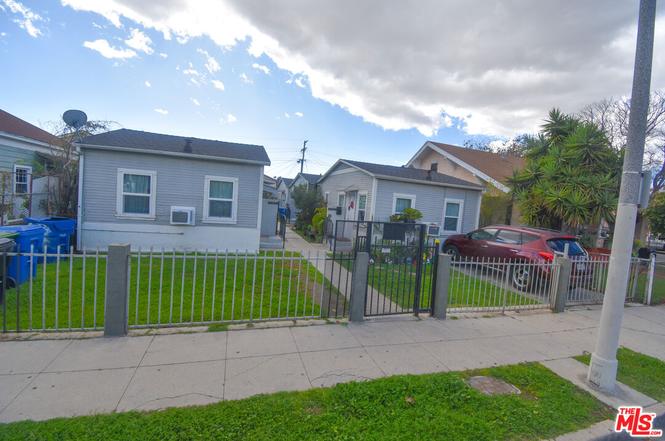
206 E Avenue 40 · Los Angeles, CA
Flood risk 1/10 · Minimal
- FEMA flood zone
- X (unshaded)
- Chance of flooding over 30 yrs
- 0.0%
- Est. flood insurance / yr
- $507 – $1,088
Fire risk 1/10 · Minimal
- Est. fire insurance / yr
- $659 – $1,223
Heat risk 6/10 · Moderate
- Hot days now (above 96°F)
- 7 days/yr
- Hot days in 30 yrs
- 22 days/yr
Wind risk 1/10 · Minimal
- Chance of severe wind over 30 yrs
- —
Air-quality risk 6/10 · Moderate
- Unhealthy air days now
- 11 days/yr
- Unhealthy air days in 30 yrs
- 12 days/yr
Risk factors via First Street. Map © Google.
Why this score? — see what drove the B grade
The composite is a weighted blend of 9 inputs, each scored 0–100. Each bar is that input's sub-score; the figure is the points it added to the 100-point composite (weight × sub-score).
- Cash flow +30.0/30.0
- 1% rule +10.0/10.0
- DSCR +10.0/10.0
- ARV discount +7.5/15.0
- Rent growth +3.8/5.0
- Schools +3.6/10.0
- Livability +3.4/5.0
- Condition / age +2.5/5.0
- Appreciation +0.0/10.0
$865,000
🖨 Deal sheet (PDF) 📄 Offer letter ✓ Due diligence
Multi-family units
County records classify this as Multi-Family (5+ Unit). Listing-text estimate: 7 units. confirmed
5+ unit building — per-unit beds/baths from public records are typically unavailable; the breakdown below (if shown) is an estimate from the listing text.
Listing remarks MLS
INVESTMENT PROPERTY- Classic Cottage-style 7 Legal units in Los Angeles. All 7 individual units consisting of Bedrooms/Singles with small yards. Zoning: LARD2- Good Investor neighborhood, easy access to all major LA Freeways. Minutes to Downtown LA, Glendale & Pasadena.
Key facts
- New roofs
- Significant upgrades
- Major renovation
Tags
Property features AI
Finance
- Other: Scheduled actual rent status
- Financial info: Actual annual gross rent: $8,557; Gross income: $11,700; Gross operating income: $134,784; Net operating income: $90,240; Total annual expenses: $44,544; Cap rate: 6.54%; Gross rent multiplier: 8.42; Vacancy rate: 4%; Units are listed as apartments; unit types include a mix of studios and 1-bedrooms
- HOA & community: No HOA amenities; Complex contains 7 units
Exterior
- Parking: Driveway parking; One total parking space plus one open other space
- Security: Smoke detector; Carbon monoxide detector
- Utilities: Public water with meter on property; Sewer connection in street; Has water heaters
- Home design: Residential income property; Detached building with no common walls; One level / single story; Property updated/remodeled; includes additions/alterations
- Construction: Seven buildings in the complex
- Exterior features: Single, level lot in the city; Lot is level/flat with paved streets and curbs; No additional structures
Interior
- Kitchen: Oven; Gas cooking; Range/Oven; Refrigerator
- Bedrooms: Unit mix includes one 1-bedroom unit and multiple studio units
- Bathrooms: Multiple units with full baths (each unit listed has 1.00 bath)
- Heating & cooling: Wall gas heat; Wall/window cooling units; Tankless gas water heater
- Interior features: Screens on windows; Smoke detector; Carbon monoxide detector
- Laundry & utility: No on-site laundry
Neighborhood map
What this means for you Summary
Snapshot
- This is a 7 × 1-bed/1.0-bath units multifamily listed at $865k.
Deal economics
- At list price, monthly cash flow is $6k ($69k/yr) — positive. Per door: $826/mo.
- The deal already cash-flows at list — no discount required.
- Meets the 1% rule at list price ($14k rent vs $865k).
- Recommended offer: $839k (3.0% below list) — sets the bar for market timing.
- Cap rate 14.3% vs local median 2.1% in Los Angeles — top-decile yield for the area; either an underpriced asset or a hidden risk that comps aren't pricing in. Stress-test before assuming the spread holds.
Location & tenants
- Location reads 68/100 on livability (#273 in CA) — a middle-class / working-renter tenant base. Strengths: amenities A+, commute A+, employment B; Watch: health & safety C-, crime F, cost of living F.
- Los Angeles Unified (urban): math 29% / reading 54% proficiency, ranked #223 of 517 in CA (top 43%) — families likely to look elsewhere, expect single-tenant / working-renter base with shorter leases; 67% free/reduced lunch — lower-income household profile, screen leases tightly.
- Zoned schools: Loreto Street Elementary (266 students, 94% FRL); Florence Nightingale Middle (790 students, 93% FRL); Woodrow Wilson Senior High (math 23% / reading 59%, grade F, #502 of 1,170 statewide, top 43%, 1,406 students, 93% FRL) — zoned schools average 93% FRL vs 67% district-wide (26 pts higher); higher-poverty schools than district average — tighter screening recommended.
- Market conditions: Rents rising fast (+5.1%/yr); 126 active listings in the ZIP; 39 comparable units currently listed for rent nearby; rentals at typical pace (median 27d on market — plan ~3-4 weeks tenant-placement turnaround); 46% of comp listings sitting > 30 days — soft ceiling on asking rent; 19,697 units permitted in Los Angeles County in 2024 (9,426 in 5+ unit buildings).
Forward outlook
- Local home prices are declining (-3.0%/yr); year-one equity from $6k of loan paydown is wiped out by about $26k of value loss. Plan a longer hold.
- Los Angeles County population projected at +9% by 2050 — modest demand growth; plan on rents tracking national, not racing it.
- At projected returns (-3.0% appreciation + 5.1% rent growth), your $242k cash investment doubles in ~4 years — after that, you're playing with house money.
Negotiation context
- It's been on market 54 days — a 3% lower offer ($839k) is reasonable based on typical stale-listing flexibility.
- 12 sale attempts since 19y ago with the ask held roughly flat each time — persistent listings suggest the price (not the market) is what's stuck; bring a comps-based counter.
- Current owner paid $400k; list at $865k implies a 117% gain — meaningful room to come down on a strong offer.
Risks & watch-outs
- Watch-outs: built in 1921 — expect roof / HVAC / electrical / plumbing capex.
- Climate carrying-cost: extreme-heat days projected 7→22/yr by 2055 (HVAC capex compounding) — expect insurance premiums to compound above CPI over the hold.
Questions for the listing agent
- It's been on market 54 days. Have you received any prior offers? Is the seller open to a 3% concession, seller financing, or rate buy-down credit?
- Can we see the unit-by-unit rent roll, current vacancy, and any below-market leases? What's the average tenancy length?
- What capital expenditures (roof, boiler, parking lot, exteriors) have been made in the last 5 years, and what's planned in the next 2?
- Built in 1921 — when were the roof, HVAC, electrical panel, plumbing, and water heater last replaced?
- Is there a deadline driving the sale (1031 exchange, divorce, estate, relocation)? That informs how much negotiation room exists.
- Schools are D-rated, which usually means shorter tenancies and higher turnover. Who's the typical renter profile here, and what's been the actual vacancy rate?
- Crime grade is F in this area — have there been break-ins, vandalism, or insurance claims at this property in the last 3 years? What carrier currently insures it and at what premium?
- What's the average days-on-market for RENTAL listings here right now (not sales)? A rising rental-DOM trend means longer vacancies and softer asking-rent achievability than the comps imply.
- What's the recent tenant-quality profile in this submarket — average credit score on applications, eviction rate, late-payment / NSF rate, and stable-employment percentage? A property-management company in the area should have these aggregated.
- How much new apartment / multifamily construction is in the pipeline within 1–3 miles? Heavy new supply (>2% of stock underway) typically softens rents 12–24 months out; light construction supports rent growth.
Investment metrics
- 1% rule
- 1.65% ✓
- Cap rate
- 14.31%
- Cash-on-cash
- 28.65%
- DSCR
- 2.27
- GRM
- 5.1
CMA / ARV
No comps found within radius.
Projected returns pro-forma
-3.0% appreciation · 5.11% rent growth · sell at horizon
- IRR
- 25.2%
- Equity multiple
- 2.07×
- Total profit
- $258,958
- Equity at exit
- $128,974
- IRR
- 34.2%
- Equity multiple
- 4.43×
- Total profit
- $831,854
- Equity at exit
- $74,789
Cash invested: $242,200 (down + closing). Projections, not guarantees.
Landlord ↔ Tenant lean methodology
- Overall (CITY)
- 0 Strongly Tenant-Friendly
- State California
- 18 Strongly Tenant-Friendly · D+13
- County
- — inherits STATE
- City Los Angeles
- 0 Strongly Tenant-Friendly · D+22
ZIP-level market 90031
- Rents YoY
- 5.1%
- Active inventory
- 126
- Price-to-rent
- 35.4×
Monthly cashflow live
- Estimated rent
- $14,264 high interval (Pro) →
- Mortgage (P&I)
- −$4,536
- Tax from tax record
- −$589 /mo · $7,073/yr
- Insurance
- −$360
- HOA
- −$0
- Vacancy / Maint / Mgmt
- −$2,995
- Net cashflow
- $5,783
Break-even live
Sensitivity live
| Price | -10% $6,272 | -5% $6,027 | +0% $5,783 | +5% $5,538 | +10% $5,293 |
|---|---|---|---|---|---|
| Rent | -10% $4,656 | -5% $5,219 | +0% $5,783 | +5% $6,346 | +10% $6,909 |
| Rate | -1.0pp $6,218 | -0.5pp $6,003 | base $5,783 | +0.5pp $5,558 | +1.0pp $5,330 |
7-unit breakdown (identical units grouped — click to expand)
| Units | Beds | Baths | Est. rent |
|---|---|---|---|
| 7× units | 1 | 1 | $14,266 |
| #1 | 1 | 1 | $2,038 |
| #2 | 1 | 1 | $2,038 |
| #3 | 1 | 1 | $2,038 |
| #4 | 1 | 1 | $2,038 |
| #5 | 1 | 1 | $2,038 |
| #6 | 1 | 1 | $2,038 |
| #7 | 1 | 1 | $2,038 |
| Total (7 units) | $14,264 | ||
UW: 25.0% down · 7.5% · 30yr · 1.5% tax · 5.0% vac · 8.0% maint · 8.0% mgmt
Financing live
Cash to close
- Down payment
- $216,250
- Closing costs
- $25,950
- Reserves months
- —
- Total cash needed
- —
Loan-product check · same deal, 3 products live
Conventional
25% down · 7.5% · 30yr
- Down + closing
- —
- Monthly P&I
- —
- Monthly cashflow
- —
- DSCR
- —
- Eligible?
- —
Personal DTI + credit; lowest rate.
DSCR
20% down · 8.5% · 30yr
- Down + closing
- —
- Monthly P&I
- —
- Monthly cashflow
- —
- DSCR
- —
- Eligible?
- —
No personal income docs; deal must DSCR.
Hard money
10% down · 12.0% · 12mo
- Down + closing
- —
- Monthly P&I
- —
- Monthly cashflow
- —
- DSCR
- —
- Eligible?
- —
Short-term bridge; refi at stabilization.
Rent comps 39 comps
| Address | Beds | Baths | Sqft | Rent | $/sqft | DOM | Units | Dist |
|---|---|---|---|---|---|---|---|---|
| 227 E Avenue 41 Los Angeles, CA | — | 1.0 | 570 | $1,625 | $2.85 | 45d | 1 | 0.11mi |
| 3607 Griffin Ave Los Angeles, CA | 1.0 | 1.0 | 700 | $1,850 | $2.64 | 45d | 1 | 0.28mi |
| 3607 Griffin Ave Unit 3 Los Angeles, CA | 1.0 | 1.0 | 500 | $1,850 | $3.70 | 20d | 1 | 0.28mi |
| 3907 Berenice Pl Los Angeles, CA | 1.0 | 1.0 | 750 | $3,595 | $4.79 | 45d | 1 | 0.36mi |
| 4571 N Figueroa St Unit 21 Los Angeles, CA | 1.0 | 1.0 | 600 | $1,950 | $3.25 | 45d | 1 | 0.50mi |
| 131 West Avenue 34 Lincoln Heights, CA | 2.0 | 1.0–2.0 | 869 | $4,092 | $4.71 | 0d | 179 | 0.56mi |
| 481 Isabel St Los Angeles, CA | — | 1.0 | 457 | $2,195 | $4.80 | 45d | 1 | 0.57mi |
| 144 East Avenue 33 Unit 3 Los Angeles, CA | 1.0 | 1.0 | 700 | $1,650 | $2.36 | 20d | 1 | 0.59mi |
| 584 Cypress Ave Unit 588 Los Angeles, CA | 1.0 | 1.0 | 650 | $1,850 | $2.85 | 45d | 1 | 0.76mi |
| 3510 Maceo St Los Angeles, CA | 1.0 | 1.0 | 475 | $2,650 | $5.58 | 22d | 1 | 0.77mi |
| 925 Isabel St Unit 3510 Los Angeles, CA | 1.0 | 1.0 | 545 | $2,650 | $4.86 | 7d | 1 | 0.77mi |
| 2835 Huron St Unit 3/4 Los Angeles, CA | — | 1.0 | 450 | $1,595 | $3.54 | 45d | 1 | 0.78mi |
| 820 Aragon Ave Los Angeles, CA | 2.0 | 1.0 | 675 | $3,095 | $4.59 | 45d | 1 | 0.80mi |
| 2814 Sichel St Unit 3 Lincoln Heights, CA | — | 1.0 | 500 | $1,695 | $3.39 | 26d | 1 | 0.81mi |
| 2814 Sichel St Los Angeles, CA | — | 1.0 | 500 | $1,695 | $3.39 | 21d | 1 | 0.81mi |
| 360 W Avenue 26 #323 Los Angeles, CA | — | 1.0 | 630 | $2,250 | $3.57 | 45d | 1 | 0.94mi |
| 5000 E Echo St Los Angeles, CA | 1.0 | 1.0 | 575 | $1,850 | $3.22 | 15d | 1 | 0.99mi |
| 120 North Avenue 50 Apt 2 Los Angeles, CA | — | 1.0 | 508 | $1,650 | $3.25 | 6d | 1 | 1.06mi |
| 2532 Daly St Los Angeles, CA | — | 1.0 | 325 | $1,074 | $3.31 | 15d | 3 | 1.07mi |
| 2819 1/2 Altura St Los Angeles, CA | 2.0 | 1.0 | 720 | $2,250 | $3.12 | 0d | 1 | 1.07mi |
| 3020 Altura St Apt 3 Lincoln Heights, CA | 1.0 | 1.0 | 600 | $1,850 | $3.08 | 24d | 1 | 1.08mi |
| 5229 Glen Ellen Pl Highland Park, CA | 2.0 | 1.0 | 700 | $3,300 | $4.71 | 45d | 1 | 1.15mi |
| 2431 Sichel St Apt 204 Los Angeles, CA | — | 1.0 | 500 | $1,500 | $3.00 | 26d | 1 | 1.16mi |
| 2422 Sichel St Los Angeles, CA | 1.0 | 1.0 | 680 | $1,895 | $2.79 | 26d | 1 | 1.16mi |
| 2620 Commodore St Los Angeles, CA | 1.0 | 1.0 | 600 | $1,800 | $3.00 | 45d | 1 | 1.20mi |
| 2020 Barranca St Los Angeles, CA | 3.0 | 1.0–3.0 | 705 | $2,228 | $3.16 | 4d | 13 | 1.22mi |
| 2349 Lincoln Park Ave Los Angeles, CA | 1.0 | 1.0 | 600 | $1,795 | $2.99 | 45d | 1 | 1.25mi |
| 2445 Harwood St Los Angeles, CA | 1.0 | 1.0 | 500 | $2,295 | $4.59 | 45d | 1 | 1.26mi |
| 2445 Harwood St Unit 24455 Los Angeles, CA | 1.0 | 1.0 | 500 | $2,095 | $4.19 | 45d | 1 | 1.26mi |
| 255 South Avenue 55 Unit 01 Los Angeles, CA | 2.0 | 1.0 | 713 | $2,495 | $3.50 | 45d | 1 | 1.26mi |
| 255 South Avenue 55 Unit 11 Highland Park, CA | 2.0 | 2.0 | 510 | $2,295 | $4.50 | 26d | 1 | 1.26mi |
| 255 South Avenue 55 Apt 3 Highland Park, CA | 2.0 | 1.0 | 681 | $2,495 | $3.66 | 22d | 1 | 1.26mi |
| 4321 Beagle St Los Angeles, CA | 1.0 | 1.0 | 630 | $1,850 | $2.94 | 22d | 1 | 1.27mi |
| 141 S Avenue 22 Los Angeles, CA | 2.0 | 1.0 | 750 | $1,950 | $2.60 | 45d | 1 | 1.29mi |
| 323 North Avenue 52 Highland Park, CA | 1.0 | 1.0 | 600 | $2,650 | $4.42 | 6d | 1 | 1.33mi |
| 5515 Media Dr Unit 8 Los Angeles, CA | 2.0 | 1.0 | 630 | $2,850 | $4.52 | 16d | 1 | 1.36mi |
| 367 North Avenue 52 Unit 367 Los Angeles, CA | 2.0 | 1.0 | 747 | $2,150 | $2.88 | 45d | 1 | 1.39mi |
| 2205 Daly St Unit G Lincoln Heights, CA | 1.0 | 1.0 | 700 | $1,800 | $2.57 | 1d | 1 | 1.43mi |
| 4410 Bowman Blvd Unit C Los Angeles, CA | 1.0 | 1.0 | 600 | $2,500 | $4.17 | 45d | 1 | 1.46mi |
Listing history 35 events
-
2026-05-03status Pending
-
2026-03-25historical Backup Offers Accepted
-
2026-03-09$865,000 Active
-
2011-04-27soldstatus $399,500 Closed 276-char remark
Show marketing remark (276 chars)
INVESTMENT PROPERTY- Classic Cottage-style 7 Legal units in Los Angeles. All 7 individual units consisting of Bedrooms/Singles with small yards. Zoning: LARD2- Good Investor neighborhood, easy access to all major LA Freeways. Minutes to Downtown LA, Glendale & Pasadena.
-
2011-04-27soldstatus $399,500
Show marketing remark (276 chars)
INVESTMENT PROPERTY- Classic Cottage-style 7 Legal units in Los Angeles. All 7 individual units consisting of Bedrooms/Singles with small yards. Zoning: LARD2- Good Investor neighborhood, easy access to all major LA Freeways. Minutes to Downtown LA, Glendale & Pasadena.
-
2011-03-19status Pending 276-char remark
Show marketing remark (276 chars)
INVESTMENT PROPERTY- Classic Cottage-style 7 Legal units in Los Angeles. All 7 individual units consisting of Bedrooms/Singles with small yards. Zoning: LARD2- Good Investor neighborhood, easy access to all major LA Freeways. Minutes to Downtown LA, Glendale & Pasadena.
-
2011-03-08price $435,000 276-char remark
Show marketing remark (276 chars)
INVESTMENT PROPERTY- Classic Cottage-style 7 Legal units in Los Angeles. All 7 individual units consisting of Bedrooms/Singles with small yards. Zoning: LARD2- Good Investor neighborhood, easy access to all major LA Freeways. Minutes to Downtown LA, Glendale & Pasadena.
-
2011-02-15price $459,000 276-char remark
Show marketing remark (276 chars)
INVESTMENT PROPERTY- Classic Cottage-style 7 Legal units in Los Angeles. All 7 individual units consisting of Bedrooms/Singles with small yards. Zoning: LARD2- Good Investor neighborhood, easy access to all major LA Freeways. Minutes to Downtown LA, Glendale & Pasadena.
-
2011-01-26price $479,500 276-char remark
Show marketing remark (276 chars)
INVESTMENT PROPERTY- Classic Cottage-style 7 Legal units in Los Angeles. All 7 individual units consisting of Bedrooms/Singles with small yards. Zoning: LARD2- Good Investor neighborhood, easy access to all major LA Freeways. Minutes to Downtown LA, Glendale & Pasadena.
-
2011-01-12$499,500 Active 276-char remark
Show marketing remark (276 chars)
INVESTMENT PROPERTY- Classic Cottage-style 7 Legal units in Los Angeles. All 7 individual units consisting of Bedrooms/Singles with small yards. Zoning: LARD2- Good Investor neighborhood, easy access to all major LA Freeways. Minutes to Downtown LA, Glendale & Pasadena.
-
2010-12-24historical
-
2010-12-07price $499,000
-
2010-11-11price $525,000
-
2010-10-14$550,000 Active
-
2010-04-16historical
-
2009-12-17$585,000 Active
-
2009-11-09price Cancelled
-
2009-11-09historical Cancelled
-
2009-10-06Active
-
2009-04-02historical
-
2009-03-03price
-
2009-02-24
-
2008-12-04soldstatus $524,000 Closed
-
2008-11-17historical
-
2008-11-05$524,000
-
2008-08-28historical
-
2008-04-24$545,000
-
2008-04-16historical
-
2008-04-01$545,000
-
2008-03-25historical
-
2007-12-04$550,000
-
2007-10-16historical
-
2007-09-24historical
-
2007-01-10
-
2007-01-10$607,000
ⓘ Source: listings_history table (triggers on properties + properties_extension) + one-shot
backfill from property_details.listing_events for pre-trigger history.
Tax reassessment forecast CA · Resets to sale price
- Current annual tax
- $7,073 · $589/mo
- Projected year-2 tax
- $7,073 · $589/mo
- Expected delta
- $0/yr ($0/mo · 0.0%)
ⓘ Screening estimate from a state-policy table — verify with the county assessor before closing.
Climate risk First Street
- Flood 1/10 Low FEMA zone X (unshaded) · 0% chance over 30 yrs
- Wildfire 1/10 Low
- Heat 6/10 Major 7 d/yr ≥96°F today · 22 d/yr by 30 yrs out
- Wind 1/10 Low
- Air quality 6/10 Major 11 unhealthy d/yr today · 12 by 30 yrs out
Nearby sold comps map
Loading sold comps map…
Walkable amenities ~0.75 mi
Loading nearby amenities…
Taxation est. · year 1
- Rental income
- $171,168
- − Mortgage interest
- −$48,453
- − Property taxes
- −$7,073
- − Insurance
- −$4,325
- − Repairs & maintenance
- −$13,693
- − Management
- −$13,693
- − Depreciation
- −$25,164
- Taxable income
- $58,766
- Est. tax owed @ 24.0%
- −$14,104
- After-tax cash flow
- $55,287/yr
For passive investors: Depreciation is non-cash, so a rental often shows a tax loss while cash-flowing — sheltering income. Rental losses are passive: they offset passive income freely, and up to $25,000/yr can offset ordinary (W-2) income if you actively participate and your MAGI is under $100k (phasing out to $0 by $150k); unused losses carry forward. On sale, claimed depreciation is recaptured at up to 25%, and gains may owe capital-gains tax (a 1031 exchange can defer both). Figures are a year-1 estimate at your 24.0% rate — not tax advice; consult a CPA.
Schools (NCES district)
- District
- Los Angeles Unified
- NCES district ID
- 0622710
- Math proficiency
- 29% ▼ -4.00%
- Reading proficiency
- 54% ▲ 10.00%
- Median HH income
- $50,403
- Composite
- 35.67/100
- National rank
- #4875
- State rank
- #223 of 517 in CA
Livability — Los Angeles
- Score
- 68/100
- State rank
- #273
- US rank
- #9237
Category grades
Schools grade is shown separately in the Schools card above.
Census & demographics
- Census place
- Los Angeles, CA
- County
- Los Angeles County · 9,444,647 people
- City population
- 3,838,149
- Metro
- Los Angeles-Long Beach-Anaheim, CA
- Population (ZIP)
- 36,127
- Household income
- $63,090
- Rent vs Own
- Severe rent burden
- 2683.0
Population outlook (Los Angeles County) Hauer SSP2
- Today (2025)
- 10,940,515 people
- By 2030
- 11,256,481 · +2.9%
- By 2040
- 11,729,929 · +7.2%
- By 2050
- 11,948,407 · +9.2%
- By 2075
- 11,818,114 · +8.0%
- By 2100
- 10,842,928 · -0.9%
Race, ethnicity, and origin ACS 2023
- Neighborhood character
- Diverse neighborhood (Simpson 0.57)
- Race & ethnicity
- Hispanic / Latino 57% Asian 29% Two or more races 11% White 9% Native American 2% Black 2%
- Hispanic origin (detail)
- Mexican 40%
- Common ancestry
- Italian 1% Slovak 1%
- Foreign-born
- 46% · Canada, China, Vietnam
- Languages at home
- 26% English-only · Spanish 48% Chinese 14% Other Asian/Pacific 3%
Political lean MEDSL · Los Angeles
- 2024 margin
- Solid D (+32.9) · D 64.8% · R 31.9% · Other 3.3%
- 2008→2024 swing
- -7.4pp toward R · 2008: 40.4pp · 2024: 32.9pp
- All cycles
- 2024: D+32.9 2020: D+44.2 2016: D+48.0 2012: D+40.0 2008: D+40.4
Not yet ingested
- Civics
- —
Market trends
- HPI YoY
- ▼ -762.68%
- Current HPI
- 523.6412
- Rent YoY
- ▲ 5.11%
- Metro
- Los Angeles-Long Beach-Anaheim, CA
- State GDP YoY
- ▲ 3.21%
- F500 in state
- 116
Industry mix (Fortune 500 HQ in CA)
| Industry | F500 HQs | Revenue |
|---|---|---|
| Technology | 27 | $1,492B |
|
||
| Financial Services | 3 | $174B |
|
||
| Retail | 3 | $44B |
|
||
| Insurance | 3 | $26B |
|
||
| Media / Entertainment | 2 | $115B |
|
||
| Pharmaceuticals / Biotech | 2 | $62B |
|
||
Price history
+42.5% since first listed35 events — show timeline
- 2026-05-03 Pending — TheMLS
- 2026-03-25 Contingent — TheMLS
- 2026-03-09 Listed $865,000 TheMLS
- 2011-04-27 Sold (Public Records) $399,500 Public Records
- 2011-04-27 Sold (MLS) $399,500 TheMLS
- 2011-03-19 Pending — TheMLS
- 2011-03-08 Price Changed $435,000 TheMLS
- 2011-02-15 Price Changed $459,000 TheMLS
- 2011-01-26 Price Changed $479,500 TheMLS
- 2011-01-12 Listed $499,500 TheMLS
- 2010-12-24 Listing Removed — CRMLS
- 2010-12-07 Price Changed $499,000 CRMLS
- 2010-11-11 Price Changed $525,000 CRMLS
- 2010-10-14 Listed $550,000 CRMLS
- 2010-04-16 Listing Removed — CRMLS
- 2009-12-17 Listed $585,000 CRMLS
- 2009-11-09 Delisted — TheMLS
- 2009-11-09 Price Changed — TheMLS
- 2009-10-06 Listed — TheMLS
- 2009-04-02 Delisted — TheMLS
- 2009-03-03 Price Changed — TheMLS
- 2009-02-24 Listed — TheMLS
- 2008-12-04 Sold (MLS) $524,000 CRMLS
- 2008-11-17 Listing Removed — CRMLS
- 2008-11-05 Listed $524,000 CRMLS
- 2008-08-28 Listing Removed — CRMLS
- 2008-04-24 Listed $545,000 CRMLS
- 2008-04-16 Listing Removed — CRMLS
- 2008-04-01 Listed $545,000 CRMLS
- 2008-03-25 Listing Removed — CRMLS
- 2007-12-04 Listed $550,000 CRMLS
- 2007-10-16 Listing Removed — CRMLS
- 2007-09-24 Delisted — TheMLS
- 2007-01-10 Listed $607,000 CRMLS
- 2007-01-10 Listed — TheMLS
Property tax history
+10.2%/yrLatest (2025): $7,073 · +1.5% YoY. Source: county tax records.
Cash-flow waterfall
monthlySold comps — $/sqft
last 12 mo · ≤1 miLoading sold comps…