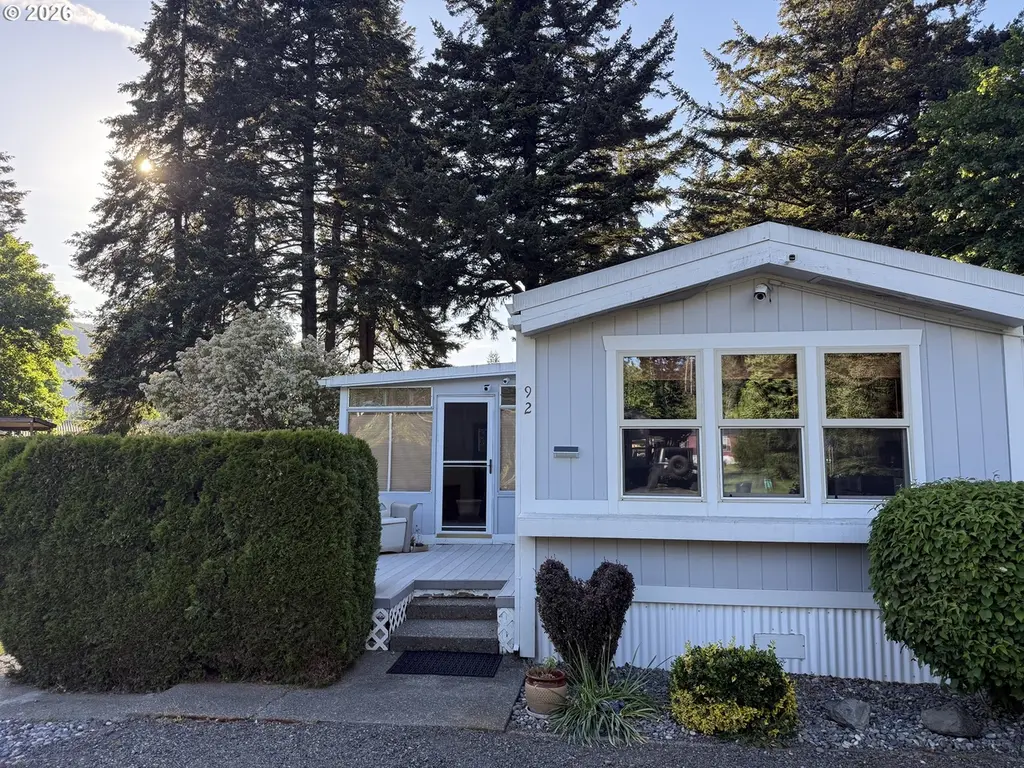
92 Evans St · Carson, WA
Flood risk 1/10 · Minimal
- FEMA flood zone
- X
- Chance of flooding over 30 yrs
- 0.0%
- Est. flood insurance / yr
- $508 – $851
Fire risk 3/10 · Minor
- Est. fire insurance / yr
- $604 – $1,122
Heat risk 3/10 · Minor
- Hot days now (above threshold)
- 7 days/yr
- Hot days in 30 yrs
- 15 days/yr
Wind risk No data
- Chance of severe wind over 30 yrs
- —
Air-quality risk No data
- Unhealthy air days now
- —
- Unhealthy air days in 30 yrs
- —
Risk factors via First Street. Map © Google.
Why this score? — see what drove the B- grade
The composite is a weighted blend of 9 inputs, each scored 0–100. Each bar is that input's sub-score; the figure is the points it added to the 100-point composite (weight × sub-score).
- Cash flow +30.0/30.0
- 1% rule +10.0/10.0
- DSCR +10.0/10.0
- ARV discount +7.5/15.0
- Schools +3.8/10.0
- Livability +3.1/5.0
- Rent growth +2.5/5.0
- Condition / age +2.5/5.0
- Appreciation +0.0/10.0
$54,000
🖨 Deal sheet 📄 Offer letter ✓ Due diligence
Listing remarks
This is a great little house at an affordable price. Heat Pump, Metal Roof, Granite Countertops in the Kitchen, Pantry, Dining Area, Living Room, Two Bedrooms, Jetted Tub. Two sheds in the backyard.
Key facts
- Pantry
- Metal roof
- Heat pump
Tags
Property features AI
Finance
- HOA & community: Located in Carson Valley Mobile Home Park; Space rent currently $400 per month (scheduled to increase to $500/month in January 2027)
Exterior
- Parking: Driveway parking
- Utilities: Public water; Shared septic; Electric service
- Home design: Manufactured home in a park; Single-story layout; Main-level entry; Views of trees/woods
- Construction: Built in 1980; Metal roof; Referenced foundation (manufactured home)
- Exterior features: Metal siding; Wood siding; Paved road access; Gentle sloping to level lot
Interior
- Kitchen: Granite countertops
- Bedrooms: Primary bedroom on the main level; Second bedroom on the main level
- Bathrooms: One full bathroom (main level)
- Heating & cooling: Heat pump for heating; Heat pump for cooling; Electric water heater
- Interior features: Granite surfaces; Jetted tub
Neighborhood map
What this means for you Summary
Snapshot
- This is a 2-bed/1.0-bath manufactured listed at $54k.
Deal economics
- At list price, monthly cash flow is $609 ($7k/yr) — positive.
- The deal already cash-flows at list — no discount required.
- Meets the 1% rule at list price ($1k rent vs $54k).
Location & tenants
- Location reads 62/100 on livability (#402 in WA) — a middle-class / working-renter tenant base. Strengths: housing A+, crime A; Watch: employment C-, health & safety C-, amenities F.
- Stevenson-Carson School District (rural): math 32% / reading 51% proficiency, ranked #209 of 291 in WA (top 72%) — families likely to look elsewhere, expect single-tenant / working-renter base with shorter leases.
- Zoned schools: Carson Elementary (193 students, 60% FRL); Stevenson High School (265 students, 51% FRL).
- Market conditions: 31 active listings in the ZIP; 34 units permitted in Skamania County in 2024 (0 in 5+ unit buildings).
Forward outlook
- Local home prices are declining (-3.0%/yr); year-one equity from $373 of loan paydown is wiped out by about $2k of value loss. Plan a longer hold.
- At projected returns (-3.0% appreciation + 3.0% rent growth), your $15k cash investment doubles in ~3 years — after that, you're playing with house money.
Negotiation context
- Only 10 days on market — expect competitive offers; lowballing is unlikely to land.
- 2 sale attempts with the ask held roughly flat each time — persistent listings suggest the price (not the market) is what's stuck; bring a comps-based counter.
Questions for the listing agent
- Is there a deadline driving the sale (1031 exchange, divorce, estate, relocation)? That informs how much negotiation room exists.
- Schools are D-rated, which usually means shorter tenancies and higher turnover. Who's the typical renter profile here, and what's been the actual vacancy rate?
- What's the average days-on-market for RENTAL listings here right now (not sales)? A rising rental-DOM trend means longer vacancies and softer asking-rent achievability than the comps imply.
- What's the recent tenant-quality profile in this submarket — average credit score on applications, eviction rate, late-payment / NSF rate, and stable-employment percentage? A property-management company in the area should have these aggregated.
- How much new for-sale + rental construction is in the pipeline within 1–3 miles? Heavy new supply typically softens prices + rents 12–24 months out; constrained supply supports both.
Investment metrics
- 1% rule
- 2.30% ✓
- Cap rate
- 19.83%
- Cash-on-cash
- 48.35%
- DSCR
- 3.15
- GRM
- 3.6
CMA / ARV
- ARV (median comp)
- $343,393
- List price
- $54,000
- Delta
- -84.27%
- Verdict
- UNDERPRICED
- Comps
- 3 within 1.0 mi
Show comp detail 1 sale within ~0.75 mi
| Address | Dist | Beds/Ba | Sqft | Sold | Price | $/sf | Match |
|---|---|---|---|---|---|---|---|
| 102 Evans St | 0.03mi | 2/1.0 | 810 (-12%) | 18mo | $90,000 | $111 | 63 |
Match score weights: distance 35% · size 25% · config 20% · recency 20%. Top-matched comps best support the ARV.
Projected returns pro-forma
-3.0% appreciation · 3.0% rent growth · sell at horizon
- IRR
- 45.9%
- Equity multiple
- 2.99×
- Total profit
- $30,070
- Equity at exit
- $8,052
- IRR
- 51.7%
- Equity multiple
- 6.04×
- Total profit
- $76,223
- Equity at exit
- $4,669
Cash invested: $15,120 (down + closing). Projections, not guarantees.
Landlord ↔ Tenant lean methodology
- Overall (STATE)
- 28 Tenant-Leaning
- State Washington
- 28 Tenant-Leaning · D+8
- County
- — inherits STATE
- City
- — inherits STATE
ZIP-level market 98610
- Home prices YoY
- -4.8%
- Active inventory
- 31
- Price-to-rent
- 3.6×
Monthly cashflow live
- Estimated rent
- $1,244 medium interval (Pro) →
- Mortgage (P&I)
- −$283
- Tax est. 1.5%
- −$68 /mo · $810/yr
- Insurance
- −$22
- HOA
- −$0
- Vacancy / Maint / Mgmt
- −$261
- Net cashflow
- $609
Break-even live
UW: 25.0% down · 7.5% · 30yr · 1.5% tax · 5.0% vac · 8.0% maint · 8.0% mgmt
Financing live
Cash to close
- Down payment
- $13,500
- Closing costs
- $1,620
- Reserves months
- —
- Total cash needed
- —
Loan-product check · same deal, 3 products live
Conventional
25% down · 7.5% · 30yr
- Down + closing
- —
- Monthly P&I
- —
- Monthly cashflow
- —
- DSCR
- —
- Eligible?
- —
Personal DTI + credit; lowest rate.
DSCR
20% down · 8.5% · 30yr
- Down + closing
- —
- Monthly P&I
- —
- Monthly cashflow
- —
- DSCR
- —
- Eligible?
- —
No personal income docs; deal must DSCR.
Hard money
10% down · 12.0% · 12mo
- Down + closing
- —
- Monthly P&I
- —
- Monthly cashflow
- —
- DSCR
- —
- Eligible?
- —
Short-term bridge; refi at stabilization.
Listing history 8 events
-
2026-06-13status $54,000 Pending 10 DOM
-
2026-06-12days on market $54,000 Active 10 DOM
-
2026-06-09days on market $54,000 Active 7 DOM
-
2026-06-08days on market $54,000 Active 6 DOM
-
2026-06-08days on market $54,000 Active 5 DOM
-
2026-06-07status $54,000 Active 4 DOM
-
2026-05-17status Pending 198-char remark
-
2026-05-12$54,000 Active 198-char remark
ⓘ Source: listings_history table (triggers on properties + properties_extension) + one-shot
backfill from property_details.listing_events for pre-trigger history.
Climate risk First Street
- Flood 1/10 Low FEMA zone X · 0% chance over 30 yrs
- Wildfire 3/10 Moderate
- Heat 3/10 Moderate
Nearby sold comps map
Loading sold comps map…
Walkable amenities ~0.75 mi
Loading nearby amenities…
Taxation est. · year 1
- Rental income
- $14,922
- − Mortgage interest
- −$3,025
- − Property taxes
- −$810
- − Insurance
- −$270
- − Repairs & maintenance
- −$1,194
- − Management
- −$1,194
- − Depreciation
- −$1,571
- Taxable income
- $6,859
- Est. tax owed @ 24.0%
- −$1,646
- After-tax cash flow
- $5,664/yr
For passive investors: Depreciation is non-cash, so a rental often shows a tax loss while cash-flowing — sheltering income. Rental losses are passive: they offset passive income freely, and up to $25,000/yr can offset ordinary (W-2) income if you actively participate and your MAGI is under $100k (phasing out to $0 by $150k); unused losses carry forward. On sale, claimed depreciation is recaptured at up to 25%, and gains may owe capital-gains tax (a 1031 exchange can defer both). Figures are a year-1 estimate at your 24.0% rate — not tax advice; consult a CPA.
Schools (NCES district)
- District
- Stevenson-Carson School District
- NCES district ID
- 5308520
- Math proficiency
- 32% ▼ -1.00%
- Reading proficiency
- 51% ▲ 10.00%
- Median HH income
- $46,512
- Composite
- 37.73/100
- National rank
- #8766
- State rank
- #209 of 291 in WA
Livability — Carson
- Score
- 62/100
- State rank
- #402
- US rank
- #16113
Category grades
Schools grade is shown separately in the Schools card above.
Census & demographics
- Census place
- Carson, WA
- Population (ZIP)
- 3,004
Population outlook (Skamania County) Hauer SSP2
- Today (2025)
- 11,886 people
- By 2030
- 12,036 · +1.3%
- By 2040
- 11,995 · +0.9%
- By 2050
- 11,607 · -2.3%
- By 2075
- 10,881 · -8.5%
- By 2100
- 10,392 · -12.6%
Race, ethnicity, and origin ACS 2023
- Neighborhood character
- Predominantly White (86%)
- Race & ethnicity
- White 86% Two or more races 6% Native American 5% Hispanic / Latino 3%
- Common ancestry
- Serbian 5% Portuguese 4% Slovak 4%
- Foreign-born
- 1% · Canada
- Languages at home
- 97% English-only · Spanish 3%
Political lean MEDSL · Skamania
- 2024 margin
- R (+11.1) · D 43.0% · R 54.2% · Other 2.8%
- 2008→2024 swing
- -16.5pp toward R · 2008: 5.3pp · 2024: -11.1pp
- All cycles
- 2024: R+11.1 2020: R+9.5 2016: R+12.6 2012: R+1.3 2008: D+5.3
Not yet ingested
- Civics
- —
Market trends
- HPI YoY
- ▼ -16.38%
- Current HPI
- 325.6607
- Rent YoY
- —
- Metro
- —
- State GDP YoY
- ▲ 4.65%
- F500 in state
- 22
Industry mix (Fortune 500 HQ in WA)
| Industry | F500 HQs | Revenue |
|---|---|---|
| Retail | 2 | $269B |
|
||
| Technology / Retail | 1 | $638B |
|
||
| Technology | 1 | $245B |
|
||
| Telecommunications | 1 | $38B |
|
||
| Food / Beverage | 1 | $36B |
|
||
| Automotive / Trucks | 1 | $34B |
|
||
Price history
4 events — show timeline
- 2026-06-13 Pending — RMLS
- 2026-06-06 Relisted — RMLS
- 2026-05-17 Pending — RMLS
- 2026-05-12 Listed $54,000 RMLS
Property tax history
+0.9%/yrLatest (2026): $83 · +10.5% YoY. Source: county tax records.
Cash-flow waterfall
monthlySold comps — $/sqft
last 12 mo · ≤1 miLoading sold comps…