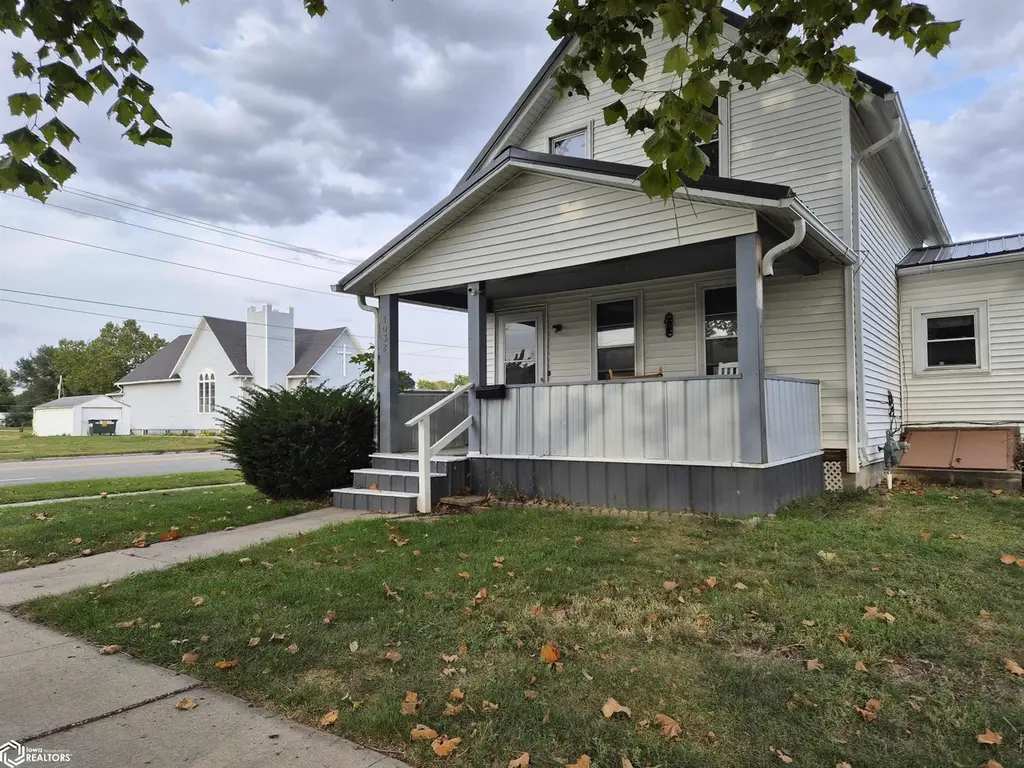
1032 Pearl St · Grinnell, IA
Flood risk 1/10 · Minimal
- FEMA flood zone
- X (unshaded)
- Chance of flooding over 30 yrs
- 0.0%
- Est. flood insurance / yr
- $473 – $860
Fire risk 5/10 · Moderate
- Est. fire insurance / yr
- $902 – $1,676
Heat risk 3/10 · Minor
- Hot days now (above 102°F)
- 7 days/yr
- Hot days in 30 yrs
- 15 days/yr
Wind risk 2/10 · Minimal
- Chance of severe wind over 30 yrs
- —
Air-quality risk 2/10 · Minimal
- Unhealthy air days now
- 1 days/yr
- Unhealthy air days in 30 yrs
- 1 days/yr
Risk factors via First Street. Map © Google.
Why this score? — see what drove the C- grade
The composite is a weighted blend of 9 inputs, each scored 0–100. Each bar is that input's sub-score; the figure is the points it added to the 100-point composite (weight × sub-score).
- Cash flow +15.3/30.0
- ARV discount +15.0/15.0
- Schools +6.6/10.0
- DSCR +4.7/10.0
- 1% rule +4.0/10.0
- Livability +4.0/5.0
- Rent growth +2.5/5.0
- Condition / age +2.5/5.0
- Appreciation +0.0/10.0
$110,000
🖨 Deal sheet 📄 Offer letter ✓ Due diligence
Listing remarks MLS
GREAT PRICE FOR THIS HOME!! PRICE REDUCED!!Large Corner lot for this 2 bedroom, 2 story home with cozy living room , Dining area plus small eat-in area in kitchen with refrigerator and stove, Huge main floor laundry with washer and dryer. Nice Basement storage with walkout. Covered front porch and small rear deck. Detached 2+ car garage with plenty of storage. SOLD AS-IS. Alley access. Close to down town.
Key facts
- Covered front porch
- Cozy living room
- Dining area
Tags
Neighborhood map
What this means for you Summary
Snapshot
- This is a 2-bed/1.0-bath single-family listed at $110k.
Deal economics
- At list price, monthly cash flow is $41 ($488/yr) — positive.
- The deal already cash-flows at list — no discount required.
- To meet the 1% rule (rent ≥ 1% of price), the offer needs to be $99k (10.0% below list).
- Recommended offer: $97k (12.0% below list) — sets the bar for market timing.
- Cap rate 6.7% vs local median 2.9% in Grinnell — top-decile yield for the area; either an underpriced asset or a hidden risk that comps aren't pricing in. Stress-test before assuming the spread holds.
Location & tenants
- Location reads 79/100 on livability (#123 in IA, #2,270 nationally) — a middle-class / working-renter tenant base. Strengths: schools A+, cost of living A+, housing A+; Watch: employment D, amenities F, commute F.
- Grinnell-Newburg Community School District (town): math 76% / reading 79% proficiency, ranked #47 of 289 in IA (top 16%) — strong family-tenant draw, lease renewals of 3-5y typical.
- Market conditions: 98 active listings in the ZIP; 6 comparable units currently listed for rent nearby; rentals at typical pace (median 24d on market — plan ~3-4 weeks tenant-placement turnaround); 27 units permitted in Poweshiek County in 2024 (0 in 5+ unit buildings).
Forward outlook
- Local home prices are declining (-3.0%/yr); year-one equity from $761 of loan paydown is wiped out by about $3k of value loss. Plan a longer hold.
- Poweshiek County population projected to shrink 3% by 2050 — rents likely to lag national; underwrite the cash flow, not the appreciation.
Negotiation context
- It's been on market 249 days — a 12% lower offer ($97k) is reasonable based on typical stale-listing flexibility.
- 3 sale attempts since 4y ago; this cycle's ask has dropped $9k (8%) from the opening price — seller is motivated, your offer sets the floor, not the list.
- Current owner paid $95k; 16% above their basis — modest negotiation headroom, anchor on the comps not their cost.
Risks & watch-outs
- Watch-outs: built in 1900 — expect roof / HVAC / electrical / plumbing capex.
- Climate carrying-cost: moderate wildfire risk — expect insurance premiums to compound above CPI over the hold.
Questions for the listing agent
- It's been on market 249 days. Have you received any prior offers? Is the seller open to a 12% concession, seller financing, or rate buy-down credit?
- Built in 1900 — when were the roof, HVAC, electrical panel, plumbing, and water heater last replaced?
- Why hasn't it sold? Are there any deal-killer items the seller is aware of (foundation, flood, title, zoning, code violations)?
- Is there a deadline driving the sale (1031 exchange, divorce, estate, relocation)? That informs how much negotiation room exists.
- Schools are A-rated — typically a magnet for longer-tenancy family renters. What's the average tenant stay here, and is there a school-zone premium baked into asking?
- What's the average days-on-market for RENTAL listings here right now (not sales)? A rising rental-DOM trend means longer vacancies and softer asking-rent achievability than the comps imply.
- What's the recent tenant-quality profile in this submarket — average credit score on applications, eviction rate, late-payment / NSF rate, and stable-employment percentage? A property-management company in the area should have these aggregated.
- How much new for-sale + rental construction is in the pipeline within 1–3 miles? Heavy new supply typically softens prices + rents 12–24 months out; constrained supply supports both.
Investment metrics
- 1% rule
- 0.90% ✗
- Cap rate
- 6.74%
- Cash-on-cash
- 1.59%
- DSCR
- 1.07
- GRM
- 9.3
CMA / ARV
- ARV (median comp)
- $133,209
- List price
- $110,000
- Delta
- -17.42%
- Verdict
- UNDERPRICED
- Comps
- 20 within 1.0 mi
Show comp detail 12 sales within ~0.75 mi
| Address | Dist | Beds/Ba | Sqft | Sold | Price | $/sf | Match |
|---|---|---|---|---|---|---|---|
| 1209 Spencer St | 0.16mi | 2/1.0 | 1,046 (+1%) | 4mo | $105,000 | $100 | 88 |
| 718 Reed St | 0.36mi | 2/1.0 | 959 (-7%) | 7mo | $117,900 | $123 | 65 |
| 1220 Main St | 0.29mi | 3/1.5 (+1) | 987 (-5%) | 9mo | $149,000 | $151 | 64 |
| 1429 Prince St | 0.52mi | 2/1.5 | 992 (-4%) | 6mo | $105,000 | $106 | 62 |
| 509 9th Ave | 0.34mi | 2/2.0 | 896 (-14%) | 1mo | $170,000 | $190 | 57 |
| 1705 Reed St | 0.63mi | 3/1.5 (+1) | 1,040 (+0%) | 7mo | $250,000 | $240 | 57 |
| 433 Main St | 0.64mi | 1/1.0 (-1) | 1,094 (+6%) | 2mo | $80,000 | $73 | 54 |
| 915 Elm St | 0.72mi | 3/2.0 (+1) | 1,061 (+2%) | 2mo | $190,000 | $179 | 52 |
| 1710 Spring St | 0.62mi | 3/2.0 (+1) | 1,064 (+3%) | 7mo | $236,000 | $222 | 52 |
| 539 10th Ave | 0.44mi | 3/1.5 (+1) | 1,180 (+14%) | 9mo | $229,000 | $194 | 42 |
| 320 1st Ave | 0.52mi | 3/2.0 (+1) | 1,166 (+12%) | 10mo | $203,000 | $174 | 38 |
| 1316 5th Ave | 0.69mi | 3/1.5 (+1) | 1,180 (+14%) | 10mo | $210,000 | $178 | 30 |
Match score weights: distance 35% · size 25% · config 20% · recency 20%. Top-matched comps best support the ARV.
Projected returns pro-forma
-3.0% appreciation · 3.0% rent growth · sell at horizon
- IRR
- -13.8%
- Equity multiple
- 0.51×
- Total profit
- $-15,229
- Equity at exit
- $16,401
- IRR
- -4.9%
- Equity multiple
- 0.68×
- Total profit
- $-9,908
- Equity at exit
- $9,511
Cash invested: $30,800 (down + closing). Projections, not guarantees.
Landlord ↔ Tenant lean methodology
- Overall (STATE)
- 83 Strongly Landlord-Friendly
- State Iowa
- 83 Strongly Landlord-Friendly · R+6
- County
- — inherits STATE
- City
- — inherits STATE
ZIP-level market 50112
- Home prices YoY
- -14.4%
- Active inventory
- 98
- Price-to-rent
- 9.3×
Monthly cashflow live
- Estimated rent
- $990 high interval (Pro) →
- Mortgage (P&I)
- −$577
- Tax from tax record
- −$119 /mo · $1,426/yr
- Insurance
- −$46
- HOA
- −$0
- Vacancy / Maint / Mgmt
- −$208
- Net cashflow
- $41
Break-even live
UW: 25.0% down · 7.5% · 30yr · 1.5% tax · 5.0% vac · 8.0% maint · 8.0% mgmt
Financing live
Cash to close
- Down payment
- $27,500
- Closing costs
- $3,300
- Reserves months
- —
- Total cash needed
- —
Loan-product check · same deal, 3 products live
Conventional
25% down · 7.5% · 30yr
- Down + closing
- —
- Monthly P&I
- —
- Monthly cashflow
- —
- DSCR
- —
- Eligible?
- —
Personal DTI + credit; lowest rate.
DSCR
20% down · 8.5% · 30yr
- Down + closing
- —
- Monthly P&I
- —
- Monthly cashflow
- —
- DSCR
- —
- Eligible?
- —
No personal income docs; deal must DSCR.
Hard money
10% down · 12.0% · 12mo
- Down + closing
- —
- Monthly P&I
- —
- Monthly cashflow
- —
- DSCR
- —
- Eligible?
- —
Short-term bridge; refi at stabilization.
Rent comps 6 comps
| Address | Beds | Baths | Sqft | Rent | $/sqft | DOM | Units | Dist |
|---|---|---|---|---|---|---|---|---|
| 931 West St Grinnell, IA | 3.0 | 1.0 | 1300 | $1,100 | $0.85 | 23d | 1 | 0.16mi |
| 232 8th Ave W Grinnell, IA | 3.0 | 1.0 | 1008 | $1,010 | $1.00 | 44d | 1 | 0.26mi |
| 916 Main St Unit 4 Grinnell, IA | 2.0 | 1.0 | 1200 | $850 | $0.71 | 23d | 1 | 0.28mi |
| 401 Washington Ave Grinnell, IA | 2.0 | 1.0 | 1000 | $825 | $0.82 | 14d | 1 | 0.67mi |
| 501 Washington Ave Grinnell, IA | 3.0 | 1.0 | 1008 | $1,025 | $1.02 | 14d | 1 | 0.67mi |
| 1512 Summer St Grinnell, IA | 2.0 | 1.0 | 1339 | $1,000 | $0.75 | 44d | 1 | 0.93mi |
Listing history 15 events
-
2026-06-07days on market $110,000 Active 249 DOM
-
2026-06-07days on market $110,000 Active 248 DOM
-
2026-06-04days on market $110,000 Active 245 DOM
-
2026-06-02days on market $110,000 Active 244 DOM
-
2026-06-01days on market $110,000 Active 243 DOM
-
2026-05-31days on market $110,000 Active 242 DOM
-
2026-05-31days on market $110,000 Active 241 DOM
-
2026-03-08price $110,000 409-char remark
Show marketing remark (409 chars)
GREAT PRICE FOR THIS HOME!! PRICE REDUCED!!Large Corner lot for this 2 bedroom, 2 story home with cozy living room , Dining area plus small eat-in area in kitchen with refrigerator and stove, Huge main floor laundry with washer and dryer. Nice Basement storage with walkout. Covered front porch and small rear deck. Detached 2+ car garage with plenty of storage. SOLD AS-IS. Alley access. Close to down town.
-
2026-02-16price $115,000 409-char remark
Show marketing remark (409 chars)
GREAT PRICE FOR THIS HOME!! PRICE REDUCED!!Large Corner lot for this 2 bedroom, 2 story home with cozy living room , Dining area plus small eat-in area in kitchen with refrigerator and stove, Huge main floor laundry with washer and dryer. Nice Basement storage with walkout. Covered front porch and small rear deck. Detached 2+ car garage with plenty of storage. SOLD AS-IS. Alley access. Close to down town.
-
2025-10-01$119,000 Active 409-char remark
Show marketing remark (409 chars)
GREAT PRICE FOR THIS HOME!! PRICE REDUCED!!Large Corner lot for this 2 bedroom, 2 story home with cozy living room , Dining area plus small eat-in area in kitchen with refrigerator and stove, Huge main floor laundry with washer and dryer. Nice Basement storage with walkout. Covered front porch and small rear deck. Detached 2+ car garage with plenty of storage. SOLD AS-IS. Alley access. Close to down town.
-
2022-09-15soldstatus $95,000
-
2022-09-12soldstatus $95,000 206-char remark
Show marketing remark (206 chars)
1032 Pearl is a nice 1.5 story home with new furnace, new central, new 200 AMP breaker box, will have a new metal roof be for closing. Detached 2+ car garage. Home is currently a rental. Great investment!!
-
2022-09-12soldstatus $95,000
Show marketing remark (206 chars)
1032 Pearl is a nice 1.5 story home with new furnace, new central, new 200 AMP breaker box, will have a new metal roof be for closing. Detached 2+ car garage. Home is currently a rental. Great investment!!
-
2022-05-24$98,900 206-char remark
Show marketing remark (206 chars)
1032 Pearl is a nice 1.5 story home with new furnace, new central, new 200 AMP breaker box, will have a new metal roof be for closing. Detached 2+ car garage. Home is currently a rental. Great investment!!
-
2022-05-23$98,900
ⓘ Source: listings_history table (triggers on properties + properties_extension) + one-shot
backfill from property_details.listing_events for pre-trigger history.
Tax reassessment forecast IA · Partial reset (capped growth)
- Current annual tax
- $1,426 · $119/mo
- Projected year-2 tax
- $1,576 · $131/mo
- Expected delta
- +$150/yr (+$13/mo · 10.6%)
ⓘ Screening estimate from a state-policy table — verify with the county assessor before closing.
Climate risk First Street
- Flood 1/10 Low FEMA zone X (unshaded) · 0% chance over 30 yrs
- Wildfire 5/10 Major
- Heat 3/10 Moderate 7 d/yr ≥102°F today · 15 d/yr by 30 yrs out
- Wind 2/10 Low
- Air quality 2/10 Low 1 unhealthy d/yr today · 1 by 30 yrs out
Nearby sold comps map
Loading sold comps map…
Walkable amenities ~0.75 mi
Loading nearby amenities…
Taxation est. · year 1
- Rental income
- $11,882
- − Mortgage interest
- −$6,162
- − Property taxes
- −$1,426
- − Insurance
- −$550
- − Repairs & maintenance
- −$951
- − Management
- −$951
- − Depreciation
- −$3,200
- Taxable loss
- −$1,357
- Est. tax savings @ 24.0%
- +$326
- After-tax cash flow
- $814/yr
For passive investors: Depreciation is non-cash, so a rental often shows a tax loss while cash-flowing — sheltering income. Rental losses are passive: they offset passive income freely, and up to $25,000/yr can offset ordinary (W-2) income if you actively participate and your MAGI is under $100k (phasing out to $0 by $150k); unused losses carry forward. On sale, claimed depreciation is recaptured at up to 25%, and gains may owe capital-gains tax (a 1031 exchange can defer both). Figures are a year-1 estimate at your 24.0% rate — not tax advice; consult a CPA.
Schools (NCES district)
- District
- Grinnell-Newburg Community School District
- NCES district ID
- 1913200
- Math proficiency
- 76% ▼ -3.00%
- Reading proficiency
- 79% ▲ 3.00%
- Median HH income
- $49,893
- Composite
- 65.57/100
- National rank
- #466
- State rank
- #47 of 289 in IA
Livability — Grinnell
- Score
- 79/100
- State rank
- #123
- US rank
- #2270
Category grades
Schools grade is shown separately in the Schools card above.
Census & demographics
- Census place
- Grinnell, IA
- City population
- 11,776
- Population (ZIP)
- 11,776
Population outlook (Poweshiek County) Hauer SSP2
- Today (2025)
- 18,601 people
- By 2030
- 18,342 · -1.4%
- By 2040
- 17,944 · -3.5%
- By 2050
- 18,029 · -3.1%
- By 2075
- 19,945 · +7.2%
- By 2100
- 22,637 · +21.7%
Race, ethnicity, and origin ACS 2023
- Neighborhood character
- Predominantly White (89%)
- Race & ethnicity
- White 89% Two or more races 4% Hispanic / Latino 3% Asian 3% Black 2%
- Common ancestry
- Iranian 7% Portuguese 4% Italian 3%
- Foreign-born
- 4% · Canada, South Korea, China
- Languages at home
- 94% English-only · Spanish 2% Other Indo-European 1% German/W. Germanic 1%
Political lean MEDSL · Poweshiek
- 2024 margin
- R (+17.0) · D 40.8% · R 57.8% · Other 1.5%
- 2008→2024 swing
- -28.7pp toward R · 2008: 11.8pp · 2024: -17.0pp
- All cycles
- 2024: R+17.0 2020: R+13.3 2016: R+6.8 2012: D+9.1 2008: D+11.8
Not yet ingested
- Civics
- —
Market trends
- HPI YoY
- ▼ -40.63%
- Current HPI
- 241.5557
- Rent YoY
- —
- Metro
- —
- State GDP YoY
- ▲ 2.48%
- F500 in state
- 4
Industry mix (Fortune 500 HQ in IA)
| Industry | F500 HQs | Revenue |
|---|---|---|
| Financial Services | 1 | $16B |
|
||
| Retail / Convenience | 1 | $15B |
|
||
Price history
+11.2% since first listed8 events — show timeline
- 2026-03-08 Price Changed $110,000 IAR
- 2026-02-16 Price Changed $115,000 IAR
- 2025-10-01 Listed $119,000 IAR
- 2022-09-15 Sold (Public Records) $95,000 Public Records
- 2022-09-12 Sold (MLS) $95,000 IAR
- 2022-09-12 Sold (MLS) $95,000 DMMLS
- 2022-05-24 Listed $98,900 DMMLS
- 2022-05-23 Listed $98,900 IAR
Property tax history
+3.6%/yrLatest (2025): $1,426 · +1.3% YoY. Source: county tax records.
Cash-flow waterfall
monthlySold comps — $/sqft
last 12 mo · ≤1 miLoading sold comps…