5502 Arrowhead Blvd · Kokomo, IN
Flood risk 1/10 · Minimal
- FEMA flood zone
- X (unshaded)
- Chance of flooding over 30 yrs
- 0.0%
- Est. flood insurance / yr
- $507 – $1,088
Fire risk 1/10 · Minimal
- Est. fire insurance / yr
- $717 – $1,331
Heat risk 3/10 · Minor
- Hot days now (above 101°F)
- 7 days/yr
- Hot days in 30 yrs
- 17 days/yr
Wind risk 2/10 · Minimal
- Chance of severe wind over 30 yrs
- 0.0%
Air-quality risk 3/10 · Minor
- Unhealthy air days now
- 2 days/yr
- Unhealthy air days in 30 yrs
- 4 days/yr
Risk factors via First Street. Map © Google.
Why this score? — see what drove the B grade
The composite is a weighted blend of 9 inputs, each scored 0–100. Each bar is that input's sub-score; the figure is the points it added to the 100-point composite (weight × sub-score).
- Cash flow +27.1/30.0
- ARV discount +15.0/15.0
- DSCR +9.4/10.0
- 1% rule +8.3/10.0
- Livability +3.4/5.0
- Rent growth +3.0/5.0
- Condition / age +2.5/5.0
- Schools +1.8/10.0
- Appreciation +0.0/10.0
$107,000
🖨 Deal sheet (PDF) 📄 Offer letter ✓ Due diligence
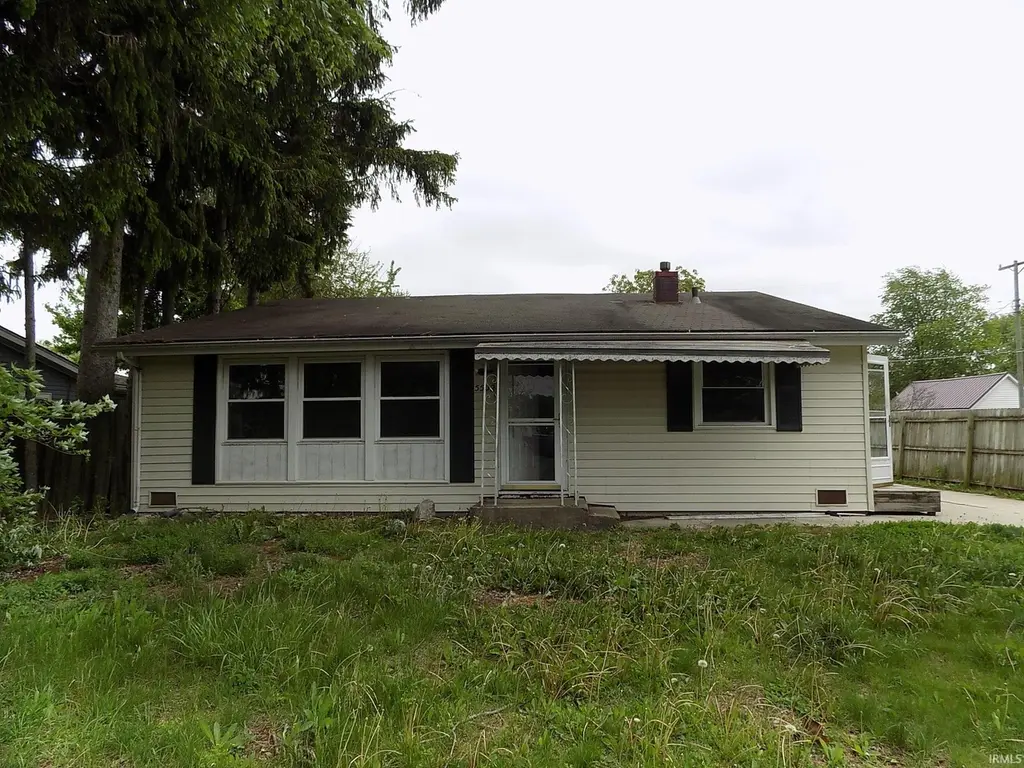
Listing remarks
Bring your vision and your tools and turn this 1,500 sqft house into your home and have instant equity. The split level design features a large living room with vaulted ceilings and kitchen on the main floor. The downstairs has an equally spacious family room with separate utility and laundry room. Upstairs are the three bedrooms and full bath. The carpet has been removed to reveal wood floors throughout the entire second level. A detached garage is located behind the house.
Key facts
- Laundry room
- Large living room
- Split level design
Tags
Property features AI
Exterior
- Parking: Detached concrete 2-car garage
- Utilities: Public water; Public sewer
- Home design: Single-family residence (site-built); Residential property; Subdivision: Indian Heights
- Construction: Vinyl siding; Asphalt shingle roof; Above-grade finished area reported
- Exterior features: Partial fencing; Sloped lot; Lot dimensions approximately 64 x 116
Interior
- Kitchen: Electric range
- Bedrooms: 6 total rooms (bedrooms included in room count)
- Flooring: Hardwood; Concrete; Vinyl
- Bathrooms: 1 full bathroom
- Heating & cooling: Natural gas forced-air heating; Central air conditioning
- Interior features: Partially finished basement; 1 fireplace
- Laundry & utility: Laundry located on lower level
Neighborhood map
What this means for you Summary
Snapshot
- This is a 3-bed/1.0-bath single-family listed at $107k.
Deal economics
- At list price, monthly cash flow is $304 ($4k/yr) — positive.
- The deal already cash-flows at list — no discount required.
- Meets the 1% rule at list price ($1k rent vs $107k).
- Recommended offer: $104k (3.0% below list) — sets the bar for market timing.
- Cap rate 9.7% vs local median 5.2% in Kokomo — top-decile yield for the area; either an underpriced asset or a hidden risk that comps aren't pricing in. Stress-test before assuming the spread holds.
Location & tenants
- Location reads 68/100 on livability (#227 in IN) — a middle-class / working-renter tenant base. Strengths: cost of living A+, housing A+, health & safety A; Watch: crime D, amenities F, commute F.
- Taylor Community School Corporation (rural): math 17% / reading 23% proficiency, ranked #272 of 301 in IN (top 90%) — low school quality limits family demand, transient renter base, plan for 1-2y turnover.
- Zoned schools: Taylor Elementary School (math 19% / reading 19%, grade F, #829 of 994 statewide, top 84%, 513 students, 78% FRL); Taylor Middle School (math 13% / reading 20%, grade F, #287 of 330 statewide, top 88%, 413 students, 76% FRL); Taylor High School (math 32% / reading 52%, grade F, #197 of 369 statewide, top 57%, 374 students, 67% FRL) — zoned schools average 74% FRL vs 45% district-wide (29 pts higher); higher-poverty schools than district average — tighter screening recommended.
- Market conditions: Rents rising (+1.8%/yr); 235 active listings in the ZIP; 1 comparable units currently listed for rent nearby; 194 units permitted in Howard County in 2024 (0 in 5+ unit buildings).
Forward outlook
- Local home prices are declining (-3.0%/yr); year-one equity from $740 of loan paydown is wiped out by about $3k of value loss. Plan a longer hold.
- Howard County population projected at -11% by 2050 — secular population decline; favor cash flow + early exit over multi-decade hold.
Negotiation context
- It's been on market 54 days — a 3% lower offer ($104k) is reasonable based on typical stale-listing flexibility.
Risks & watch-outs
- Watch-outs: built in 1958 — expect roof / HVAC / electrical / plumbing capex.
Questions for the listing agent
- It's been on market 54 days. Have you received any prior offers? Is the seller open to a 3% concession, seller financing, or rate buy-down credit?
- Built in 1958 — when were the roof, HVAC, electrical panel, plumbing, and water heater last replaced?
- Is there a deadline driving the sale (1031 exchange, divorce, estate, relocation)? That informs how much negotiation room exists.
- Schools are F-rated, which usually means shorter tenancies and higher turnover. Who's the typical renter profile here, and what's been the actual vacancy rate?
- Crime grade is D in this area — have there been break-ins, vandalism, or insurance claims at this property in the last 3 years? What carrier currently insures it and at what premium?
- What's the average days-on-market for RENTAL listings here right now (not sales)? A rising rental-DOM trend means longer vacancies and softer asking-rent achievability than the comps imply.
- What's the recent tenant-quality profile in this submarket — average credit score on applications, eviction rate, late-payment / NSF rate, and stable-employment percentage? A property-management company in the area should have these aggregated.
- How much new for-sale + rental construction is in the pipeline within 1–3 miles? Heavy new supply typically softens prices + rents 12–24 months out; constrained supply supports both.
Investment metrics
- 1% rule
- 1.33% ✓
- Cap rate
- 9.70%
- Cash-on-cash
- 12.17%
- DSCR
- 1.54
- GRM
- 6.3
CMA / ARV
- ARV (median comp)
- $160,395
- List price
- $107,000
- Delta
- -33.29%
- Verdict
- UNDERPRICED
- Comps
- 20 within 1.0 mi
Show comp detail 12 sales within ~0.75 mi
| Address | Dist | Beds/Ba | Sqft | Sold | Price | $/sf | Match |
|---|---|---|---|---|---|---|---|
| 813 Tomahawk Blvd | 0.28mi | 3/1.0 | 1,440 (-5%) | 4mo | $149,900 | $104 | 75 |
| 5511 Arrowhead Blvd | 0.06mi | 4/1.5 (+1) | 1,427 (-6%) | 9mo | $160,000 | $112 | 74 |
| 903 Wingra Ct | 0.38mi | 4/1.0 (+1) | 1,530 (+1%) | 2mo | $155,000 | $101 | 73 |
| 5308 Arrowhead Blvd | 0.12mi | 3/1.0 | 1,368 (-10%) | 8mo | $157,000 | $115 | 72 |
| 704 Miami Blvd | 0.17mi | 3/1.0 | 1,320 (-13%) | 0mo | $154,500 | $117 | 70 |
| 617 Miami Blvd | 0.13mi | 4/2.0 (+1) | 1,425 (-6%) | 10mo | $180,000 | $126 | 67 |
| 4908 Algonquin Trl | 0.39mi | 3/1.0 | 1,392 (-8%) | 2mo | $149,900 | $108 | 67 |
| 707 Springwater Rd | 0.55mi | 3/2.0 | 1,560 (+3%) | 1mo | $249,900 | $160 | 65 |
| 5503 Arrowhead Blvd | 0.12mi | 4/2.0 (+1) | 1,700 (+12%) | 4mo | $205,000 | $121 | 62 |
| 713 Miami Blvd | 0.19mi | 3/2.0 | 1,702 (+13%) | 11mo | $204,900 | $120 | 57 |
| 3022 Highland Springs Dr | 0.71mi | 3/2.0 | 1,560 (+3%) | 8mo | $199,000 | $128 | 51 |
| 4026 Highland Springs Dr | 0.64mi | 3/2.0 | 1,420 (-6%) | 11mo | $220,000 | $155 | 47 |
Match score weights: distance 35% · size 25% · config 20% · recency 20%. Top-matched comps best support the ARV.
Projected returns pro-forma
-3.0% appreciation · 1.8% rent growth · sell at horizon
- IRR
- 0.3%
- Equity multiple
- 1.01×
- Total profit
- $389
- Equity at exit
- $15,954
- IRR
- 8.7%
- Equity multiple
- 1.63×
- Total profit
- $18,748
- Equity at exit
- $9,251
Cash invested: $29,960 (down + closing). Projections, not guarantees.
Landlord ↔ Tenant lean methodology
- Overall (STATE)
- 90 Strongly Landlord-Friendly
- State Indiana
- 90 Strongly Landlord-Friendly · R+11
- County
- — inherits STATE
- City
- — inherits STATE
ZIP-level market 46902
- Home prices YoY
- -20.7%
- Rents YoY
- 1.8%
- Active inventory
- 235
- Price-to-rent
- 6.3×
Monthly cashflow live
- Estimated rent
- $1,424 medium interval (Pro) →
- Mortgage (P&I)
- −$561
- Tax from tax record
- −$215 /mo · $2,582/yr
- Insurance
- −$45
- HOA
- −$0
- Vacancy / Maint / Mgmt
- −$299
- Net cashflow
- $304
Break-even live
Sensitivity live
| Price | -10% $364 | -5% $334 | +0% $304 | +5% $274 | +10% $243 |
|---|---|---|---|---|---|
| Rent | -10% $191 | -5% $248 | +0% $304 | +5% $360 | +10% $416 |
| Rate | -1.0pp $358 | -0.5pp $331 | base $304 | +0.5pp $276 | +1.0pp $248 |
UW: 25.0% down · 7.5% · 30yr · 1.5% tax · 5.0% vac · 8.0% maint · 8.0% mgmt
Financing live
Cash to close
- Down payment
- $26,750
- Closing costs
- $3,210
- Reserves months
- —
- Total cash needed
- —
Loan-product check · same deal, 3 products live
Conventional
25% down · 7.5% · 30yr
- Down + closing
- —
- Monthly P&I
- —
- Monthly cashflow
- —
- DSCR
- —
- Eligible?
- —
Personal DTI + credit; lowest rate.
DSCR
20% down · 8.5% · 30yr
- Down + closing
- —
- Monthly P&I
- —
- Monthly cashflow
- —
- DSCR
- —
- Eligible?
- —
No personal income docs; deal must DSCR.
Hard money
10% down · 12.0% · 12mo
- Down + closing
- —
- Monthly P&I
- —
- Monthly cashflow
- —
- DSCR
- —
- Eligible?
- —
Short-term bridge; refi at stabilization.
Rent comps 1 comps
| Address | Beds | Baths | Sqft | Rent | $/sqft | DOM | Units | Dist |
|---|---|---|---|---|---|---|---|---|
| 3515 Melody Ln E Kokomo, IN | 3.0 | 1.5 | 1736 | $1,650 | $0.95 | 44d | 1 | 1.41mi |
Listing history 20 events
-
2026-06-21days on market $107,000 Active 54 DOM
-
2026-06-19days on market $107,000 Active 52 DOM
-
2026-06-18days on market $107,000 Active 51 DOM
-
2026-06-17days on market $107,000 Active 50 DOM
-
2026-06-16days on market $107,000 Active 49 DOM
-
2026-06-15days on market $107,000 Active 48 DOM
-
2026-06-14days on market $107,000 Active 46 DOM
-
2026-06-13days on market $107,000 Active 45 DOM
-
2026-06-10days on market $107,000 Active 43 DOM
-
2026-06-09days on market $107,000 Active 42 DOM
-
2026-06-08days on market $107,000 Active 41 DOM
-
2026-06-07days on market $107,000 Active 40 DOM
-
2026-06-05days on market $107,000 Active 37 DOM
-
2026-06-03days on market $107,000 Active 36 DOM
-
2026-06-03price $107,000 Active 35 DOM
-
2026-06-02days on market $133,000 Active 35 DOM
-
2026-06-01days on market $133,000 Active 34 DOM
-
2026-05-31days on market $133,000 Active 33 DOM
-
2026-05-30days on market $133,000 Active 32 DOM
-
2026-04-27$137,000 Active 479-char remark
ⓘ Source: listings_history table (triggers on properties + properties_extension) + one-shot
backfill from property_details.listing_events for pre-trigger history.
Tax reassessment forecast IN · Partial reset (capped growth)
- Current annual tax
- $2,582 · $215/mo
- Projected year-2 tax
- $2,582 · $215/mo
- Expected delta
- $0/yr ($0/mo · 0.0%)
ⓘ Screening estimate from a state-policy table — verify with the county assessor before closing.
Climate risk First Street
- Flood 1/10 Low FEMA zone X (unshaded) · 0% chance over 30 yrs
- Wildfire 1/10 Low
- Heat 3/10 Moderate 7 d/yr ≥101°F today · 17 d/yr by 30 yrs out
- Wind 2/10 Low 0% chance of damaging wind over 30 yrs
- Air quality 3/10 Moderate 2 unhealthy d/yr today · 4 by 30 yrs out
Nearby sold comps map
Loading sold comps map…
Walkable amenities ~0.75 mi
Loading nearby amenities…
Taxation est. · year 1
- Rental income
- $17,085
- − Mortgage interest
- −$5,994
- − Property taxes
- −$2,582
- − Insurance
- −$535
- − Repairs & maintenance
- −$1,367
- − Management
- −$1,367
- − Depreciation
- −$3,113
- Taxable income
- $2,128
- Est. tax owed @ 24.0%
- −$511
- After-tax cash flow
- $3,136/yr
For passive investors: Depreciation is non-cash, so a rental often shows a tax loss while cash-flowing — sheltering income. Rental losses are passive: they offset passive income freely, and up to $25,000/yr can offset ordinary (W-2) income if you actively participate and your MAGI is under $100k (phasing out to $0 by $150k); unused losses carry forward. On sale, claimed depreciation is recaptured at up to 25%, and gains may owe capital-gains tax (a 1031 exchange can defer both). Figures are a year-1 estimate at your 24.0% rate — not tax advice; consult a CPA.
Schools (NCES district)
- District
- Taylor Community School Corporation
- NCES district ID
- 1811250
- Math proficiency
- 17% ▼ -10.00%
- Reading proficiency
- 23% ▼ -9.00%
- Median HH income
- $52,382
- Composite
- 18.12/100
- National rank
- #8969
- State rank
- #272 of 301 in IN
Livability — Kokomo
- Score
- 68/100
- State rank
- #227
- US rank
- #9912
Category grades
Schools grade is shown separately in the Schools card above.
Census & demographics
- Census place
- Kokomo, IN
- County
- Howard County · 75,099 people
- City population
- 75,099
- Metro
- Kokomo, IN
- Population (ZIP)
- 37,017
- Household income
- $62,126
- Rent vs Own
- Severe rent burden
- 1262.0
Population outlook (Howard County) Hauer SSP2
- Today (2025)
- 81,522 people
- By 2030
- 80,104 · -1.7%
- By 2040
- 76,708 · -5.9%
- By 2050
- 72,880 · -10.6%
- By 2075
- 64,016 · -21.5%
- By 2100
- 51,705 · -36.6%
Race, ethnicity, and origin ACS 2023
- Neighborhood character
- Predominantly White (81%)
- Race & ethnicity
- White 81% Black 9% Two or more races 5% Hispanic / Latino 4% Asian 3%
- Common ancestry
- Italian 2% Lithuanian 1% Slovak 1%
- Foreign-born
- 3% · Canada, Vietnam, China
- Languages at home
- 96% English-only · Vietnamese 1% Other Asian/Pacific 1% Spanish 1%
Political lean MEDSL · Howard
- 2024 margin
- Solid R (+35.3) · D 31.4% · R 66.7% · Other 1.8%
- 2008→2024 swing
- -29.1pp toward R · 2008: -6.2pp · 2024: -35.3pp
- All cycles
- 2024: R+35.3 2020: R+32.4 2016: R+33.9 2012: R+14.3 2008: R+6.2
Not yet ingested
- Civics
- —
Market trends
- HPI YoY
- ▼ -61.76%
- Current HPI
- 236.8237
- Rent YoY
- ▲ 1.80%
- Metro
- Kokomo, IN
- State GDP YoY
- ▲ 2.90%
- F500 in state
- 18
Industry mix (Fortune 500 HQ in IN)
| Industry | F500 HQs | Revenue |
|---|---|---|
| Industrial Machinery | 2 | $37B |
|
||
| Healthcare | 1 | $177B |
|
||
| Pharmaceuticals | 1 | $45B |
|
||
| Metals / Steel | 1 | $18B |
|
||
| Agriculture | 1 | $17B |
|
||
| Packaging | 1 | $12B |
|
||
Price history
-21.9% since first listed3 events — show timeline
- 2026-06-02 Price Changed $107,000 IRMLS
- 2026-05-26 Price Changed $133,000 IRMLS
- 2026-04-27 Listed $137,000 IRMLS
Property tax history
+7.9%/yrLatest (2024): $2,582 · +15.2% YoY. Source: county tax records.
Cash-flow waterfall
monthlySold comps — $/sqft
last 12 mo · ≤1 miLoading sold comps…