 🏗️ New Construction
803 Doctor's Creek Rd NE · Ludowici, GA
Flood risk 1/10 · Minimal
- FEMA flood zone
- X (unshaded)
- Chance of flooding over 30 yrs
- 0.0%
- Est. flood insurance / yr
- $507 – $1,088
Fire risk 7/10 · Major
- Est. fire insurance / yr
- $963 – $1,789
Heat risk 8/10 · Major
- Hot days now (above 109°F)
- 7 days/yr
- Hot days in 30 yrs
- 18 days/yr
Wind risk 8/10 · Major
- Chance of severe wind over 30 yrs
- 99.0%
Air-quality risk 2/10 · Minimal
- Unhealthy air days now
- 2 days/yr
- Unhealthy air days in 30 yrs
- 2 days/yr
Risk factors via First Street. Map © Google.
Why this score? — see what drove the D- grade
The composite is a weighted blend of 9 inputs, each scored 0–100. Each bar is that input's sub-score; the figure is the points it added to the 100-point composite (weight × sub-score).
- Cash flow +9.1/30.0
- ARV discount +7.5/15.0
- Appreciation +5.6/10.0
- Livability +3.6/5.0
- 1% rule +3.0/10.0
- DSCR +2.6/10.0
- Rent growth +2.5/5.0
- Schools +2.3/10.0
- Condition / age +2.2/5.0
$272,475
🖨 Deal sheet (PDF) 📄 Offer letter ✓ Due diligence
Listing remarks MLS
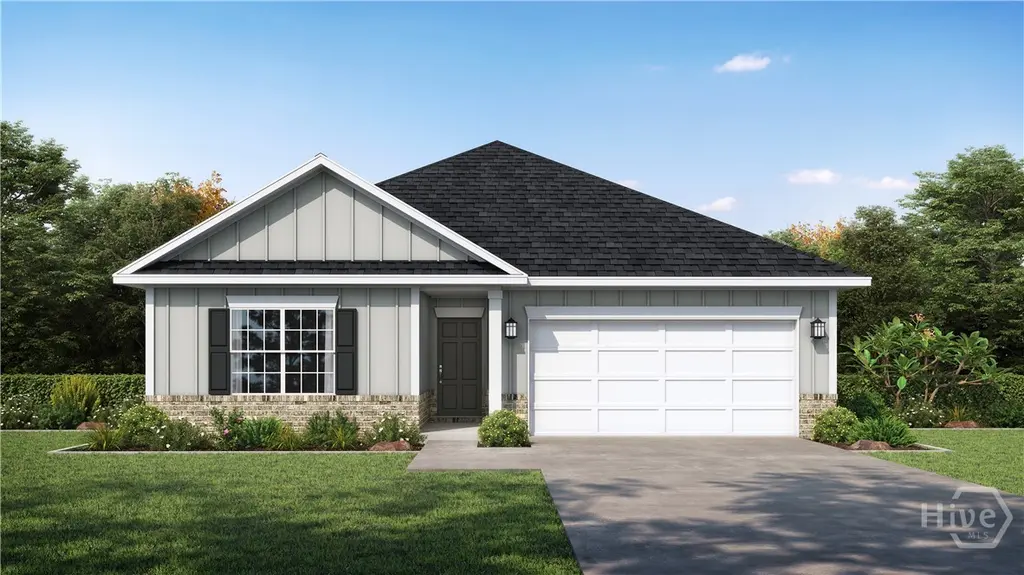
Introducing the Powell Plan! Designed for all families, the Powell offers a ranch-style layout comprising 3 bedrooms and 2 bathrooms. The open kitchen, featuring a generous corner pantry and a spacious island, seamlessly connecting to the dining room and great room, with the option for a fireplace. Two secondary bedrooms include ample closet space and share a lavish 3-piece hall bath located near the front of the house. The primary suite includes a private en-suite and large walk-in closet. Artistic rendering(s) is for informational purposes only. Actual floor plans and inclusions may vary.
Key facts
- 0.53 acre lot
- 2 garage spots
- Built 2026
Property features AI
Finance
- Other: Located in the Doctors Creek subdivision
- HOA & community: Homeowners association with $45 monthly fee
Exterior
- Parking: Attached 2-car garage
- Utilities: Shared well water; Septic tank sewer; Underground utilities
- Home design: Single-family residence; New construction; One-story; Slab entry/foundation
- Construction: Brick construction; Asphalt roof; Built new (new construction); Slab foundation; Home warranty included
- Exterior features: Patio; Underground utilities
Interior
- Kitchen: Dishwasher; Microwave; Oven; Range; Refrigerator
- Bathrooms: 2 full bathrooms; Accessible full bathroom
- Heating & cooling: Central heating (electric); Central air conditioning (electric)
- Interior features: Breakfast bar; Entrance foyer; Kitchen island; Pantry
- Laundry & utility: Laundry room with washer hookup; Electric water heater
Neighborhood map
What this means for you Summary
Snapshot
- This is a 3-bed/2.0-bath single-family listed at $272k. Condition is rated fair.
Deal economics
- At list price, monthly cash flow is $-212 ($-3k/yr) — negative.
- To cash-flow at today's rent, offer at most $248k (8.9% below list).
- To meet the 1% rule (rent ≥ 1% of price), the offer needs to be $223k (18.2% below list).
- Recommended offer: $223k (18.2% below list) — sets the bar for 1% rule.
Location & tenants
- Location reads 72/100 on livability (#74 in GA) — a middle-class / working-renter tenant base. Strengths: cost of living A+, health & safety A+, crime A; Watch: employment D, amenities F, commute F.
- Long County (rural): math 26% / reading 26% proficiency, ranked #115 of 174 in GA (top 66%) — low school quality limits family demand, transient renter base, plan for 1-2y turnover; 61% free/reduced lunch — lower-income household profile, screen leases tightly.
- Zoned schools: Smiley Elementary School (1,258 students, 67% FRL); Long County Middle School (math 21% / reading 27%, grade F, #311 of 470 statewide, top 68%, 945 students, 69% FRL); Long County High School (math 37% / reading 22%, grade F, #140 of 424 statewide, top 35%, 1,209 students, 70% FRL).
- Market conditions: 412 active listings in the ZIP; 2 comparable units currently listed for rent nearby; 298 units permitted in Long County in 2024 (0 in 5+ unit buildings).
- This rent runs 36% of the median local income ($75k/yr) — at the standard rent-burdened threshold; future hikes will face affordability resistance.
Forward outlook
- In year one you build about $5k of equity ($2k loan paydown + $3k appreciation (1.2% local appreciation)).
- Long County population projected at +72% by 2050 — long-run rental-demand tailwind backs the buy-and-hold thesis.
- By year 7, paydown + projected appreciation supports a ~$35k cash-out refi (75% LTV) — recoverable capital for the next deal without selling this one.
Negotiation context
- It's been on market 62 days — a 6% lower offer ($256k) is reasonable based on typical stale-listing flexibility.
- 2 sale attempts with the ask held roughly flat each time — persistent listings suggest the price (not the market) is what's stuck; bring a comps-based counter.
Risks & watch-outs
- Climate carrying-cost: severe wind risk, 99% chance of damaging wind over 30y; major wildfire risk; extreme-heat days projected 7→18/yr by 2055 (HVAC capex compounding) — expect insurance premiums to compound above CPI over the hold.
Questions for the listing agent
- What do current leases actually rent for vs. the listed asking? Can we see a recent rent roll and the last 12 months of T-12 income?
- It's been on market 62 days. Have you received any prior offers? Is the seller open to a 18% concession, seller financing, or rate buy-down credit?
- Have any recent inspections been done? Can we get a copy of the seller's disclosures and any deferred-maintenance estimates?
- What does the HOA fee cover, when was the last increase, and are there any pending special assessments or reserve-fund shortfalls?
- Why hasn't it sold? Are there any deal-killer items the seller is aware of (foundation, flood, title, zoning, code violations)?
- Is there a deadline driving the sale (1031 exchange, divorce, estate, relocation)? That informs how much negotiation room exists.
- Schools are D-rated, which usually means shorter tenancies and higher turnover. Who's the typical renter profile here, and what's been the actual vacancy rate?
- The area grade is low — what's the realistic commute time and amenity access for the typical tenant pool here? Any planned neighborhood developments (good or bad) we should know about?
- What's the average days-on-market for RENTAL listings here right now (not sales)? A rising rental-DOM trend means longer vacancies and softer asking-rent achievability than the comps imply.
- What's the recent tenant-quality profile in this submarket — average credit score on applications, eviction rate, late-payment / NSF rate, and stable-employment percentage? A property-management company in the area should have these aggregated.
- How much new for-sale + rental construction is in the pipeline within 1–3 miles? Heavy new supply typically softens prices + rents 12–24 months out; constrained supply supports both.
Investment metrics
- 1% rule
- 0.80% ✗
- Cap rate
- 5.38%
- Cash-on-cash
- -3.26%
- DSCR
- 0.86
- GRM
- 10.4
CMA / ARV
- ARV (median comp)
- $278,892
- List price
- $272,475
- Delta
- -2.30%
- Verdict
- FAIR
- Comps
- 20 within 1.0 mi
Show comp detail 12 sales within ~0.75 mi
| Address | Dist | Beds/Ba | Sqft | Sold | Price | $/sf | Match |
|---|---|---|---|---|---|---|---|
| 707 Doctor's Creek Rd NE | 0.03mi | 3/2.0 | 1,527 (0%) | 1mo | $274,830 | $180 | 98 |
| 725 Doctor's Creek Rd NE | 0.03mi | 4/2.0 (+1) | 1,565 (+2%) | 1mo | $278,925 | $178 | 89 |
| 555 Doctor's Creek Rd NE | 0.14mi | 4/2.0 (+1) | 1,565 (+2%) | 3mo | $277,625 | $177 | 82 |
| 612 Doctor's Creek Rd NE | 0.03mi | 4/2.0 (+1) | 1,620 (+6%) | 2mo | $281,325 | $174 | 81 |
| 685 Doctor's Creek Rd NE | 0.03mi | 3/2.0 | 1,380 (-10%) | 2mo | $262,975 | $191 | 81 |
| 241 NE Freshwater Ln | 0.20mi | 3/2.0 | 1,415 (-7%) | 4mo | $274,900 | $194 | 75 |
| 249 Lanier Rd | 0.40mi | 3/2.0 | 1,474 (-4%) | 5mo | $279,400 | $190 | 71 |
| 53 Freshwater Ln | 0.35mi | 3/2.0 | 1,415 (-7%) | 3mo | $274,400 | $194 | 69 |
| 263 Lanier Rd | 0.40mi | 3/2.0 | 1,415 (-7%) | 3mo | $274,400 | $194 | 67 |
| 52 Freshwater Ln | 0.62mi | 3/2.0 | 1,474 (-4%) | 3mo | $285,178 | $193 | 63 |
| 92 Freshwater Ln | 0.62mi | 3/2.0 | 1,473 (-4%) | 4mo | $284,800 | $193 | 62 |
| 74 Freshwater Ln | 0.62mi | 3/2.0 | 1,415 (-7%) | 1mo | $278,000 | $196 | 58 |
Match score weights: distance 35% · size 25% · config 20% · recency 20%. Top-matched comps best support the ARV.
Projected returns pro-forma
1.16% appreciation · 3.0% rent growth · sell at horizon
- IRR
- -1.5%
- Equity multiple
- 0.92×
- Total profit
- $-6,054
- Equity at exit
- $97,517
- IRR
- 3.4%
- Equity multiple
- 1.42×
- Total profit
- $32,655
- Equity at exit
- $131,394
Cash invested: $78,090 (down + closing). Projections, not guarantees.
Landlord ↔ Tenant lean methodology
- Overall (STATE)
- 90 Strongly Landlord-Friendly
- State Georgia
- 90 Strongly Landlord-Friendly · R+3
- County
- — inherits STATE
- City
- — inherits STATE
ZIP-level market 31316
- Home prices YoY
- 0.6%
- Active inventory
- 412
- Price-to-rent
- 10.2×
Monthly cashflow live
- Estimated rent
- $2,228 medium interval (Pro) →
- Mortgage (P&I)
- −$1,463
- Tax est. 1.5%
- −$349 /mo · $4,183/yr
- Insurance
- −$116
- HOA
- −$45
- Vacancy / Maint / Mgmt
- −$468
- Net cashflow
- $-212
Break-even live
Sensitivity live
| Price | -10% $-19 | -5% $-116 | +0% $-212 | +5% $-308 | +10% $-405 |
|---|---|---|---|---|---|
| Rent | -10% $-388 | -5% $-300 | +0% $-212 | +5% $-124 | +10% $-36 |
| Rate | -1.0pp $-72 | -0.5pp $-141 | base $-212 | +0.5pp $-284 | +1.0pp $-358 |
UW: 25.0% down · 7.5% · 30yr · 1.5% tax · 5.0% vac · 8.0% maint · 8.0% mgmt
Financing live
Cash to close
- Down payment
- $69,723
- Closing costs
- $8,367
- Reserves months
- —
- Total cash needed
- —
Loan-product check · same deal, 3 products live
Conventional
25% down · 7.5% · 30yr
- Down + closing
- —
- Monthly P&I
- —
- Monthly cashflow
- —
- DSCR
- —
- Eligible?
- —
Personal DTI + credit; lowest rate.
DSCR
20% down · 8.5% · 30yr
- Down + closing
- —
- Monthly P&I
- —
- Monthly cashflow
- —
- DSCR
- —
- Eligible?
- —
No personal income docs; deal must DSCR.
Hard money
10% down · 12.0% · 12mo
- Down + closing
- —
- Monthly P&I
- —
- Monthly cashflow
- —
- DSCR
- —
- Eligible?
- —
Short-term bridge; refi at stabilization.
Rent comps 2 comps
| Address | Beds | Baths | Sqft | Rent | $/sqft | DOM | Units | Dist |
|---|---|---|---|---|---|---|---|---|
| 15 Clark St Ludowici, GA | 3.0 | 2.0 | 1497 | $1,995 | $1.33 | 45d | 1 | 0.99mi |
| 59 Forest St NE Ludowici, GA | 4.0 | 2.0 | 1800 | $1,900 | $1.06 | 45d | 1 | 1.45mi |
HOA detail
- Monthly dues
- $45 · $540/yr
Listing history 20 events
-
2026-06-21days on market $272,475 Active 62 DOM
-
2026-06-19days on market $272,475 Active 60 DOM
-
2026-06-18days on market $272,475 Active 59 DOM
-
2026-06-17days on market $272,475 Active 58 DOM
-
2026-06-16days on market $272,475 Active 57 DOM
-
2026-06-15days on market $272,475 Active 56 DOM
-
2026-06-14days on market $272,475 Active 54 DOM
-
2026-06-13days on market $272,475 Active 53 DOM
-
2026-06-10days on market $272,475 Active 51 DOM
-
2026-06-09days on market $272,475 Active 50 DOM
-
2026-06-08days on market $272,475 Active 49 DOM
-
2026-06-07days on market $272,475 Active 48 DOM
-
2026-06-05days on market $272,475 Active 45 DOM
-
2026-06-03days on market $272,475 Active 44 DOM
-
2026-06-02days on market $272,475 Active 43 DOM
-
2026-06-01days on market $272,475 Active 42 DOM
-
2026-05-31days on market $272,475 Active 41 DOM
-
2026-05-30days on market $272,475 Active 40 DOM
-
2026-04-20$272,475 Active 597-char remark
Show marketing remark (597 chars)
Introducing the Powell Plan! Designed for all families, the Powell offers a ranch-style layout comprising 3 bedrooms and 2 bathrooms. The open kitchen, featuring a generous corner pantry and a spacious island, seamlessly connecting to the dining room and great room, with the option for a fireplace. Two secondary bedrooms include ample closet space and share a lavish 3-piece hall bath located near the front of the house. The primary suite includes a private en-suite and large walk-in closet. Artistic rendering(s) is for informational purposes only. Actual floor plans and inclusions may vary.
ⓘ Source: listings_history table (triggers on properties + properties_extension) + one-shot
backfill from property_details.listing_events for pre-trigger history.
Climate risk First Street
- Flood 1/10 Low FEMA zone X (unshaded) · 0% chance over 30 yrs
- Wildfire 7/10 Severe
- Heat 8/10 Severe 7 d/yr ≥109°F today · 18 d/yr by 30 yrs out
- Wind 8/10 Severe 99% chance of damaging wind over 30 yrs
- Air quality 2/10 Low 2 unhealthy d/yr today · 2 by 30 yrs out
Nearby sold comps map
Loading sold comps map…
Walkable amenities ~0.75 mi
Loading nearby amenities…
Taxation est. · year 1
- Rental income
- $26,740
- − Mortgage interest
- −$15,622
- − Property taxes
- −$4,183
- − Insurance
- −$1,394
- − Repairs & maintenance
- −$2,139
- − Management
- −$2,139
- − HOA
- −$540
- − Depreciation
- −$8,113
- Taxable loss
- −$7,392
- Est. tax savings @ 24.0%
- +$1,774
- After-tax cash flow
- $-770/yr
For passive investors: Depreciation is non-cash, so a rental often shows a tax loss while cash-flowing — sheltering income. Rental losses are passive: they offset passive income freely, and up to $25,000/yr can offset ordinary (W-2) income if you actively participate and your MAGI is under $100k (phasing out to $0 by $150k); unused losses carry forward. On sale, claimed depreciation is recaptured at up to 25%, and gains may owe capital-gains tax (a 1031 exchange can defer both). Figures are a year-1 estimate at your 24.0% rate — not tax advice; consult a CPA.
Condition & rehab AI · 0 photos
This home requires significant updates to its kitchen, bathrooms, and exterior to improve its condition and value. A comprehensive renovation would significantly increase its resale and rental potential.
Repairs flagged
- Major Kitchen cabinets — Significant wear and tear, possibly requiring replacement.
- Major Bathroom fixtures — Outdated and worn, likely in need of replacement.
- Major Flooring — Worn and possibly damaged, requiring replacement.
- Major Paint — Significant discoloration and wear, needs repainting.
- Major Exterior siding — Worn and discolored, possibly requiring replacement.
- Major Windows — Old and possibly in need of replacement or caulking.
Value-add opportunities
- Resale Kitchen renovation — A modern kitchen with updated appliances and cabinets can significantly increase the home's appeal to potential buyers.
- Resale Bathroom updates — Upgrading outdated fixtures and tiles can enhance the home's value and attract more buyers.
- Both Exterior painting and landscaping — Fresh paint and well-maintained landscaping can improve curb appeal and attract both buyers and renters.
Renovation cost estimate screening
| Repair item | Severity | Est. cost |
|---|---|---|
| Kitchen cabinets · Significant wear and tear, possibly requiring replacement. | Major | $15,000–50,000 |
| Bathroom fixtures · Outdated and worn, likely in need of replacement. | Major | $15,000–50,000 |
| Flooring · Worn and possibly damaged, requiring replacement. | Major | $15,000–50,000 |
| Paint · Significant discoloration and wear, needs repainting. | Major | $15,000–50,000 |
| Exterior siding · Worn and discolored, possibly requiring replacement. | Major | $15,000–50,000 |
| Windows · Old and possibly in need of replacement or caulking. | Major | $15,000–50,000 |
| Total estimated repair cost · 6 items | $90,000–300,000 |
Value-add ROI direction
- Resale Kitchen renovation — A modern kitchen with updated appliances and cabinets can significantly increase the home's appeal to potential buyers. ↑
- Resale Bathroom updates — Upgrading outdated fixtures and tiles can enhance the home's value and attract more buyers. ↑
- Both Exterior painting and landscaping — Fresh paint and well-maintained landscaping can improve curb appeal and attract both buyers and renters. ↑
ⓘ Cost ranges are severity-bucket heuristics (US national rule-of-thumb). Get contractor quotes + a written scope before underwriting a rehab budget.
Schools (NCES district)
- District
- Long County
- NCES district ID
- 1303360
- Math proficiency
- 26% ▼ -14.00%
- Reading proficiency
- 26% ▼ -13.00%
- Median HH income
- $45,958
- Composite
- 22.51/100
- National rank
- #8090
- State rank
- #115 of 174 in GA
Livability — Ludowici
- Score
- 72/100
- State rank
- #74
- US rank
- #6449
Category grades
Schools grade is shown separately in the Schools card above.
Census & demographics
- County
- Long County · 13,812 people
- City population
- 13,812
- Metro
- Hinesville, GA
- Population (ZIP)
- 13,812
- Household income
- $74,766
- Rent vs Own
- Severe rent burden
- 109.0
Population outlook (Long County) Hauer SSP2
- Today (2025)
- 24,669 people
- By 2030
- 28,223 · +14.4%
- By 2040
- 35,430 · +43.6%
- By 2050
- 42,403 · +71.9%
- By 2075
- 56,996 · +131.0%
- By 2100
- 64,185 · +160.2%
Race, ethnicity, and origin ACS 2023
- Neighborhood character
- Diverse neighborhood (Simpson 0.56)
- Race & ethnicity
- White 61% Black 23% Hispanic / Latino 8% Two or more races 8%
- Hispanic origin (detail)
- Mexican 2% Puerto Rican 5%
- Common ancestry
- Serbian 1% Italian 1% Romanian 1%
- Foreign-born
- 3% · Canada
- Languages at home
- 92% English-only · Spanish 6% Other Asian/Pacific 1% German/W. Germanic 1%
Political lean MEDSL · Long
- 2024 margin
- Strong R (+29.5) · D 35.1% · R 64.6%
- 2008→2024 swing
- -5.4pp toward R · 2008: -24.1pp · 2024: -29.5pp
- All cycles
- 2024: R+29.5 2020: R+26.4 2016: R+30.8 2012: R+22.9 2008: R+24.1
Not yet ingested
- Civics
- —
Market trends
- HPI YoY
- ▲ 1.16%
- Current HPI
- 195.2978
- Rent YoY
- —
- Metro
- Hinesville, GA
- State GDP YoY
- ▲ 2.66%
- F500 in state
- 28
Industry mix (Fortune 500 HQ in GA)
| Industry | F500 HQs | Revenue |
|---|---|---|
| Paper / Packaging | 2 | $29B |
|
||
| Retail | 1 | $160B |
|
||
| Transportation / Logistics | 1 | $91B |
|
||
| Airlines | 1 | $62B |
|
||
| Consumer Goods | 1 | $47B |
|
||
| Utilities | 1 | $25B |
|
||
Price history
+0.0% since first listed2 events — show timeline
- 2026-04-20 Listed $272,475 Hive MLS
- 2026-04-20 Listed $272,475 HABR
Cash-flow waterfall
monthlySold comps — $/sqft
last 12 mo · ≤1 miLoading sold comps…