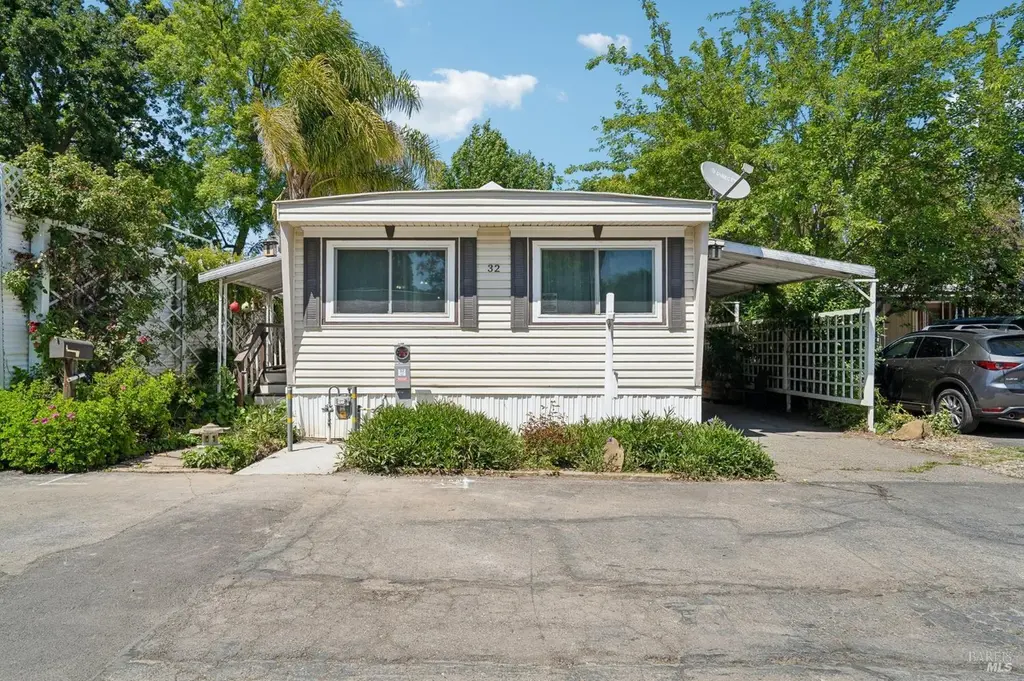
32 Avenida Corrida de Toros · Vacaville, CA
Flood risk 1/10 · Minimal
- FEMA flood zone
- X (shaded)
- Chance of flooding over 30 yrs
- 0.0%
- Est. flood insurance / yr
- $507 – $1,088
Fire risk 7/10 · Major
- Est. fire insurance / yr
- $659 – $1,223
Heat risk 6/10 · Moderate
- Hot days now (above 101°F)
- 7 days/yr
- Hot days in 30 yrs
- 14 days/yr
Wind risk 1/10 · Minimal
- Chance of severe wind over 30 yrs
- —
Air-quality risk 10/10 · Severe
- Unhealthy air days now
- 21 days/yr
- Unhealthy air days in 30 yrs
- 22 days/yr
Risk factors via First Street. Map © Google.
Why this score? — see what drove the B+ grade
The composite is a weighted blend of 9 inputs, each scored 0–100. Each bar is that input's sub-score; the figure is the points it added to the 100-point composite (weight × sub-score).
- Cash flow +29.8/30.0
- ARV discount +14.0/15.0
- DSCR +10.0/10.0
- 1% rule +8.4/10.0
- Schools +4.2/10.0
- Livability +3.9/5.0
- Condition / age +3.8/5.0
- Rent growth +2.4/5.0
- Appreciation +0.0/10.0
$179,900
🖨 Deal sheet 📄 Offer letter ✓ Due diligence
Listing remarks
Welcome to this meticulously maintained 2-bedroom, 2-bathroom mobile home located in the desirable El Matador Mobile Home Park. Offering approximately 1100sf of comfortable living space, this charming residence is move-in ready and full of thoughtful updates. This home has a bright and inviting interior featuring updated dual-pane vinyl windows, newer hardwood flooring, brand-new carpet, and an updated kitchen complete with a stylish butcher block island: perfect for meal prep and entertaining. The spacious layout also includes indoor laundry and a walk-in bathtub designed for comfort and accessibility. Enjoy your own private yard for relaxing, gardening, or spending time outdoors, as well
Key facts
- Resealed roof
- Private yard
- Butcher block island
Tags
Property features AI
Finance
- Financial info: Land lease amount: $661
- HOA & community: No association; Not a senior community; Located in El Matador Mobile Home Park
Exterior
- Parking: Covered parking (1 space)
- Utilities: Public sewer
- Home design: Manufactured in-park double wide; Land lease community
- Construction: Metal roof; Skyline manufactured home with aluminum skirt
- Exterior features: Regular-shaped lot
Interior
- Kitchen: Kitchen with island
- Bedrooms: Two bedrooms
- Flooring: Carpet; Laminate
- Bathrooms: Two full bathrooms
- Heating & cooling: Central heating; Central cooling and window unit(s)
- Interior features: One free-standing fireplace; Shower stall(s) and sunken tub; Dining and living areas combined; Updated/remodeled condition; Furnished negotiable
- Laundry & utility: Indoor laundry area with stacked washer/dryer included
Neighborhood map
What this means for you Summary
Snapshot
- This is a 2-bed/2.0-bath manufactured listed at $180k. Condition is rated good.
Deal economics
- At list price, monthly cash flow is $661 ($8k/yr) — positive.
- The deal already cash-flows at list — no discount required.
- Meets the 1% rule at list price ($2k rent vs $180k).
- Recommended offer: $175k (3.0% below list) — sets the bar for market timing.
- Cap rate 10.7% vs local median 3.0% in Vacaville — top-decile yield for the area; either an underpriced asset or a hidden risk that comps aren't pricing in. Stress-test before assuming the spread holds.
Location & tenants
- Location reads 77/100 on livability (#88 in CA, #3,156 nationally) — a middle-class / working-renter tenant base. Strengths: amenities A+, employment A+, housing A+; Watch: schools C-, cost of living F.
- Vacaville Unified (suburban): math 37% / reading 52% proficiency, ranked #522 of 1,400 in CA (top 37%) — families likely to look elsewhere, expect single-tenant / working-renter base with shorter leases.
- Market conditions: Rents soft (-0.6%/yr); 263 active listings in the ZIP; 18 comparable units currently listed for rent nearby; rentals leasing fast (median 14d on market — plan ~1-2 weeks tenant-placement turnaround); solid renter incomes; 1,472 units permitted in Solano County in 2024 (131 in 5+ unit buildings).
Forward outlook
- Local home prices are declining (-3.0%/yr); year-one equity from $1k of loan paydown is wiped out by about $5k of value loss. Plan a longer hold.
- Solano County population projected at +15% by 2050 — modest demand growth; plan on rents tracking national, not racing it.
Negotiation context
- It's been on market 48 days — a 3% lower offer ($175k) is reasonable based on typical stale-listing flexibility.
Risks & watch-outs
- Climate carrying-cost: major wildfire risk; extreme-heat days projected 7→14/yr by 2055 (HVAC capex compounding) — expect insurance premiums to compound above CPI over the hold.
Questions for the listing agent
- It's been on market 48 days. Have you received any prior offers? Is the seller open to a 3% concession, seller financing, or rate buy-down credit?
- Is there a deadline driving the sale (1031 exchange, divorce, estate, relocation)? That informs how much negotiation room exists.
- What's the average days-on-market for RENTAL listings here right now (not sales)? A rising rental-DOM trend means longer vacancies and softer asking-rent achievability than the comps imply.
- What's the recent tenant-quality profile in this submarket — average credit score on applications, eviction rate, late-payment / NSF rate, and stable-employment percentage? A property-management company in the area should have these aggregated.
- How much new for-sale + rental construction is in the pipeline within 1–3 miles? Heavy new supply typically softens prices + rents 12–24 months out; constrained supply supports both.
Investment metrics
- 1% rule
- 1.34% ✓
- Cap rate
- 10.70%
- Cash-on-cash
- 15.74%
- DSCR
- 1.70
- GRM
- 6.2
CMA / ARV
- ARV (median comp)
- $210,525
- List price
- $179,900
- Delta
- -14.55%
- Verdict
- UNDERPRICED
- Comps
- 20 within 1.0 mi
Show comp detail 11 sales within ~0.75 mi
| Address | Dist | Beds/Ba | Sqft | Sold | Price | $/sf | Match |
|---|---|---|---|---|---|---|---|
| 7 Calle Francisca | 0.08mi | 2/2.0 | 1,152 (+5%) | 13mo | $80,000 | $69 | 77 |
| 61 Calle Chapala | 0.16mi | 3/2.0 (+1) | 1,152 (+5%) | 8mo | $179,900 | $156 | 73 |
| 123 Calle Chapultepec St | 0.10mi | 3/2.0 (+1) | 1,152 (+5%) | 12mo | $220,000 | $191 | 73 |
| 91 Calle Jalisco | 0.11mi | 3/2.0 (+1) | 1,248 (+14%) | 1mo | $229,000 | $183 | 66 |
| 118 Calle Chapultepec | 0.09mi | 3/2.0 (+1) | 1,248 (+14%) | 3mo | $186,000 | $149 | 65 |
| 121 Calle Chapultepec | 0.08mi | 3/2.0 (+1) | 1,248 (+14%) | 10mo | $234,000 | $188 | 61 |
| 68 Calle Chapala | 0.19mi | 3/2.0 (+1) | 1,152 (+5%) | 23mo | $188,000 | $163 | 59 |
| 163 Avenida Hidalgo Ave | 0.18mi | 3/2.0 (+1) | 1,213 (+10%) | 23mo | $210,000 | $173 | 51 |
| 110 Calle Jalisco | 0.15mi | 3/2.0 (+1) | 1,222 (+11%) | 24mo | $230,000 | $188 | 50 |
| 110 Calle Jalisco | 0.16mi | 3/2.0 (+1) | 1,222 (+11%) | 24mo | $230,000 | $188 | 50 |
| 1597 Alamo Dr #187 | 0.39mi | 2/2.0 | 1,250 (+14%) | 21mo | $193,000 | $154 | 42 |
Match score weights: distance 35% · size 25% · config 20% · recency 20%. Top-matched comps best support the ARV.
Projected returns pro-forma
-3.0% appreciation · 0.0% rent growth · sell at horizon
- IRR
- 3.2%
- Equity multiple
- 1.12×
- Total profit
- $5,912
- Equity at exit
- $26,824
- IRR
- 9.6%
- Equity multiple
- 1.64×
- Total profit
- $32,197
- Equity at exit
- $15,554
Cash invested: $50,372 (down + closing). Projections, not guarantees.
Landlord ↔ Tenant lean methodology
- Overall (STATE)
- 18 Strongly Tenant-Friendly
- State California
- 18 Strongly Tenant-Friendly · D+13
- County
- — inherits STATE
- City
- — inherits STATE
ZIP-level market 95687
- Rents YoY
- -0.6%
- Active inventory
- 263
- Price-to-rent
- 6.2×
Monthly cashflow live
- Estimated rent
- $2,410 high interval (Pro) →
- Mortgage (P&I)
- −$943
- Tax est. 1.5%
- −$225 /mo · $2,698/yr
- Insurance
- −$75
- HOA
- −$0
- Vacancy / Maint / Mgmt
- −$506
- Net cashflow
- $661
Break-even live
UW: 25.0% down · 7.5% · 30yr · 1.5% tax · 5.0% vac · 8.0% maint · 8.0% mgmt
Financing live
Cash to close
- Down payment
- $44,975
- Closing costs
- $5,397
- Reserves months
- —
- Total cash needed
- —
Loan-product check · same deal, 3 products live
Conventional
25% down · 7.5% · 30yr
- Down + closing
- —
- Monthly P&I
- —
- Monthly cashflow
- —
- DSCR
- —
- Eligible?
- —
Personal DTI + credit; lowest rate.
DSCR
20% down · 8.5% · 30yr
- Down + closing
- —
- Monthly P&I
- —
- Monthly cashflow
- —
- DSCR
- —
- Eligible?
- —
No personal income docs; deal must DSCR.
Hard money
10% down · 12.0% · 12mo
- Down + closing
- —
- Monthly P&I
- —
- Monthly cashflow
- —
- DSCR
- —
- Eligible?
- —
Short-term bridge; refi at stabilization.
Rent comps 18 comps
| Address | Beds | Baths | Sqft | Rent | $/sqft | DOM | Units | Dist |
|---|---|---|---|---|---|---|---|---|
| 1510 Alamo Dr Vacaville, CA | 2.0 | 1.5 | 1047 | $2,425 | $2.32 | 13d | 2 | 0.21mi |
| 343 Moon River Pl Vacaville, CA | 1.0–3.0 | 1.0–2.5 | 893 | $2,720 | $3.05 | 13d | 22 | 0.26mi |
| 1567 Alamo Dr #22 Vacaville, CA | 1.0 | 1.0 | 800 | $1,500 | $1.88 | 43d | 1 | 0.30mi |
| 1797 Brookwood Dr Vacaville, CA | 3.0 | 2.0 | 1258 | $2,800 | $2.23 | 13d | 1 | 0.52mi |
| 945 Davis St Vacaville, CA | 3.0 | 2.0 | 1248 | $2,800 | $2.24 | 13d | 1 | 0.81mi |
| 361 Gabiano Ct Vacaville, CA | 3.0 | 2.5 | 1229 | $3,000 | $2.44 | 43d | 1 | 0.82mi |
| 1970 Peabody Rd #4 Vacaville, CA | 2.0 | 1.0 | 819 | $1,800 | $2.20 | 43d | 1 | 0.85mi |
| 2001 Eastwood Dr Vacaville, CA | 2.0 | 1.0 | 896 | $1,950 | $2.18 | 23d | 2 | 0.87mi |
| 999 Marshall Rd Vacaville, CA | 1.0–2.0 | 1.0–2.0 | 847 | $2,482 | $2.93 | 13d | 8 | 0.96mi |
| 591 Peabody Rd Vacaville, CA | 1.0–2.0 | 1.0–2.0 | 735 | $2,339 | $3.18 | 13d | 13 | 1.03mi |
| 901 Sara Ct Vacaville, CA | 2.0 | 1.0–2.0 | 643 | $2,475 | $3.85 | 13d | 14 | 1.23mi |
| 520 McKnight Ln Vacaville, CA | 3.0 | 2.0 | 1129 | $2,895 | $2.56 | 43d | 1 | 1.30mi |
| 148 Peabody Rd Vacaville, CA | 1.0–3.0 | 1.0–3.0 | 1046 | $2,998 | $2.86 | 2d | 15 | 1.31mi |
| 800 El Camino Ave Vacaville, CA | 2.0–3.0 | 1.0–2.0 | 899 | $1,795 | $2.00 | 12d | 2 | 1.31mi |
| 116 Elm St Vacaville, CA | 2.0 | 1.0 | 948 | $2,100 | $2.22 | 43d | 1 | 1.34mi |
| 212 Stonyford Dr Vacaville, CA | 3.0 | 2.0 | 1296 | $3,000 | $2.31 | 43d | 1 | 1.36mi |
| 293 Shasta Dr Vacaville, CA | 1.0–2.0 | 1.0–2.0 | 735 | $2,250 | $3.06 | 13d | 5 | 1.37mi |
| 500 Elizabeth St Unit C Vacaville, CA | 1.0 | 1.0 | 800 | $1,995 | $2.49 | 23d | 1 | 1.37mi |
Listing history 17 events
-
2026-06-18days on market $179,900 Active 48 DOM
-
2026-06-17days on market $179,900 Active 47 DOM
-
2026-06-16days on market $179,900 Active 46 DOM
-
2026-06-15days on market $179,900 Active 45 DOM
-
2026-06-14days on market $179,900 Active 43 DOM
-
2026-06-13days on market $179,900 Active 42 DOM
-
2026-06-10days on market $179,900 Active 40 DOM
-
2026-06-09days on market $179,900 Active 39 DOM
-
2026-06-08days on market $179,900 Active 38 DOM
-
2026-06-07days on market $179,900 Active 37 DOM
-
2026-06-05days on market $179,900 Active 34 DOM
-
2026-06-03days on market $179,900 Active 33 DOM
-
2026-06-02days on market $179,900 Active 32 DOM
-
2026-06-01days on market $179,900 Active 31 DOM
-
2026-05-31days on market $179,900 Active 30 DOM
-
2026-05-30days on market $179,900 Active 29 DOM
-
2026-05-01$179,900 Active 1166-char remark
ⓘ Source: listings_history table (triggers on properties + properties_extension) + one-shot
backfill from property_details.listing_events for pre-trigger history.
Climate risk First Street
- Flood 1/10 Low FEMA zone X (shaded) · 0% chance over 30 yrs
- Wildfire 7/10 Severe
- Heat 6/10 Major 7 d/yr ≥101°F today · 14 d/yr by 30 yrs out
- Wind 1/10 Low
- Air quality 10/10 Extreme 21 unhealthy d/yr today · 22 by 30 yrs out
Nearby sold comps map
Loading sold comps map…
Walkable amenities ~0.75 mi
Loading nearby amenities…
Taxation est. · year 1
- Rental income
- $28,923
- − Mortgage interest
- −$10,077
- − Property taxes
- −$2,698
- − Insurance
- −$900
- − Repairs & maintenance
- −$2,314
- − Management
- −$2,314
- − Depreciation
- −$5,233
- Taxable income
- $5,387
- Est. tax owed @ 24.0%
- −$1,293
- After-tax cash flow
- $6,638/yr
For passive investors: Depreciation is non-cash, so a rental often shows a tax loss while cash-flowing — sheltering income. Rental losses are passive: they offset passive income freely, and up to $25,000/yr can offset ordinary (W-2) income if you actively participate and your MAGI is under $100k (phasing out to $0 by $150k); unused losses carry forward. On sale, claimed depreciation is recaptured at up to 25%, and gains may owe capital-gains tax (a 1031 exchange can defer both). Figures are a year-1 estimate at your 24.0% rate — not tax advice; consult a CPA.
Condition & rehab AI · 6 photos
This move-in ready mobile home in El Matador Mobile Home Park offers a good condition with updates in the kitchen and bathroom. It has a good curb appeal and is ready for a fresh paint job to enhance its value.
Value-add opportunities
- Both Paint exterior siding — Enhances curb appeal and value.
- Both Replace carpet with hardwood flooring — Improves aesthetics and increases value.
- Both Update kitchen cabinets — Modernizes the kitchen and adds value.
- Both Replace dual-pane windows with energy-efficient windows — Reduces energy costs and enhances curb appeal.
Renovation cost estimate screening
Value-add ROI direction
- Both Paint exterior siding — Enhances curb appeal and value. ↑
- Both Replace carpet with hardwood flooring — Improves aesthetics and increases value. ↑
- Both Update kitchen cabinets — Modernizes the kitchen and adds value. ↑
- Both Replace dual-pane windows with energy-efficient windows — Reduces energy costs and enhances curb appeal. ↑
ⓘ Cost ranges are severity-bucket heuristics (US national rule-of-thumb). Get contractor quotes + a written scope before underwriting a rehab budget.
Schools (NCES district)
- District
- Vacaville Unified
- NCES district ID
- 0640590
- Math proficiency
- 37% ▼ -1.00%
- Reading proficiency
- 52% ▲ 2.00%
- Median HH income
- $71,383
- Composite
- 42.48/100
- National rank
- #6877
- State rank
- #522 of 1400 in CA
Livability — Vacaville
- Score
- 77/100
- State rank
- #88
- US rank
- #3156
Category grades
Schools grade is shown separately in the Schools card above.
Census & demographics
- Census place
- Vacaville, CA
- County
- Solano County · 433,239 people
- City population
- 109,591
- Metro
- Vallejo, CA
- Population (ZIP)
- 69,390
- Household income
- $109,566
- Rent vs Own
- Severe rent burden
- 1761.0
Population outlook (Solano County) Hauer SSP2
- Today (2025)
- 478,685 people
- By 2030
- 497,974 · +4.0%
- By 2040
- 528,515 · +10.4%
- By 2050
- 549,115 · +14.7%
- By 2075
- 587,229 · +22.7%
- By 2100
- 571,378 · +19.4%
Race, ethnicity, and origin ACS 2023
- Neighborhood character
- Highly diverse neighborhood (Simpson 0.71)
- Race & ethnicity
- White 44% Hispanic / Latino 26% Two or more races 13% Black 10% Asian 10% Native American 1%
- Hispanic origin (detail)
- Mexican 18% Puerto Rican 2%
- Common ancestry
- Italian 13% Lithuanian 2% Portuguese 1%
- Foreign-born
- 12% · Canada, China
- Languages at home
- 80% English-only · Spanish 12% Tagalog/Filipino 3% Other Indo-European 2%
Political lean MEDSL · Solano
- 2024 margin
- Strong D (+23.0) · D 60.0% · R 37.1% · Other 2.9%
- 2008→2024 swing
- -5.6pp toward R · 2008: 28.6pp · 2024: 23.0pp
- All cycles
- 2024: D+23.0 2020: D+30.3 2016: D+30.5 2012: D+28.1 2008: D+28.6
Not yet ingested
- Civics
- —
Market trends
- HPI YoY
- ▼ -299.59%
- Current HPI
- 268.0777
- Rent YoY
- ▼ -0.55%
- Metro
- Vallejo, CA
- State GDP YoY
- ▲ 3.21%
- F500 in state
- 116
Industry mix (Fortune 500 HQ in CA)
| Industry | F500 HQs | Revenue |
|---|---|---|
| Technology | 27 | $1,492B |
|
||
| Financial Services | 3 | $174B |
|
||
| Retail | 3 | $44B |
|
||
| Insurance | 3 | $26B |
|
||
| Media / Entertainment | 2 | $115B |
|
||
| Pharmaceuticals / Biotech | 2 | $62B |
|
||
Price history
1 event — show timeline
- 2026-05-01 Listed $179,900 BAREIS
Cash-flow waterfall
monthlySold comps — $/sqft
last 12 mo · ≤1 miLoading sold comps…