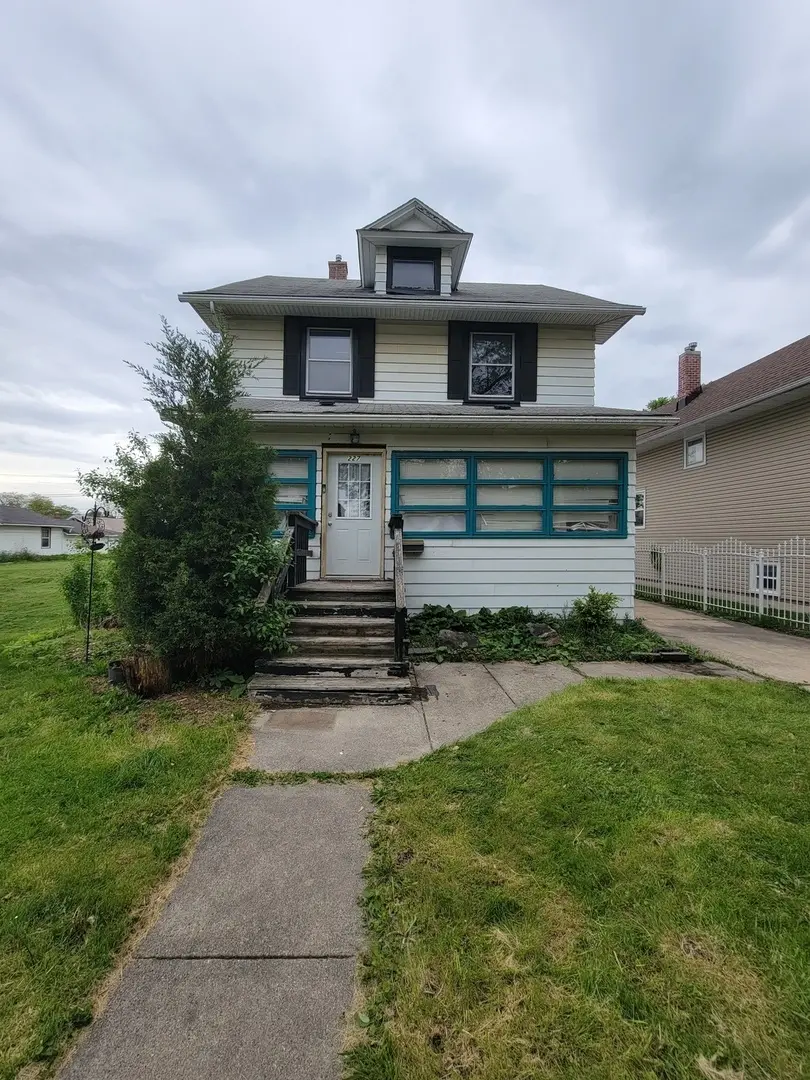
227 W 16th Pl · Chicago Heights, IL
Flood risk 1/10 · Minimal
- FEMA flood zone
- X (unshaded)
- Chance of flooding over 30 yrs
- 0.0%
- Est. flood insurance / yr
- $473 – $860
Fire risk 1/10 · Minimal
- Est. fire insurance / yr
- $804 – $1,492
Heat risk 3/10 · Minor
- Hot days now (above 101°F)
- 7 days/yr
- Hot days in 30 yrs
- 16 days/yr
Wind risk 2/10 · Minimal
- Chance of severe wind over 30 yrs
- —
Air-quality risk 2/10 · Minimal
- Unhealthy air days now
- 1 days/yr
- Unhealthy air days in 30 yrs
- 1 days/yr
Risk factors via First Street. Map © Google.
Why this score? — see what drove the B- grade
The composite is a weighted blend of 9 inputs, each scored 0–100. Each bar is that input's sub-score; the figure is the points it added to the 100-point composite (weight × sub-score).
- Cash flow +30.0/30.0
- 1% rule +10.0/10.0
- DSCR +10.0/10.0
- ARV discount +7.5/15.0
- Rent growth +4.1/5.0
- Livability +3.6/5.0
- Condition / age +2.5/5.0
- Schools +0.7/10.0
- Appreciation +0.0/10.0
$115,000
🖨 Deal sheet 📄 Offer letter ✓ Due diligence
Listing remarks MLS
ROOMY 4 BDRM/2 BATH 2-STORY W/DET'D GARAGE BEING SOLD AS IS. PROOF OF FUNDS OR LETTER FROM BANK/MTG COMPANY REQUESTED. ADDENDUMS REQ'D-ACCESS VIA MLS. SELLER RESERVES RIGHT TO NEGOTIATE OWNER OCCUPANT OR PUBLIC ENTITY OFFERS FOR FIRST 15 DAYS OF LISTING. THIS IS A FANNIE MAE HOMEPATH PROPERTY-ELIGIBLE FOR HOMEPATH AND HOMEPATH RENO FINANCING-FOR AS LITTLE AT 3% DOWN.
Key facts
- 2 garage spots
- Built 1910
- Listed 42 days
Property features AI
Finance
- Other: Property currently not leased; Possession at closing
- HOA & community: No master association fee required
Exterior
- Parking: Detached owned garage (2 garage spaces, 2 total parking spaces)
- Utilities: Public water; Public sewer
- Home design: Detached single-family home; 2 stories; Fee simple ownership; Built over 100 years ago; Built before 1978
- Construction: Vinyl siding exterior; Asphalt roof
- Exterior features: Lot less than 0.25 acre; Lot dimensions: 5720 (source: county records)
Interior
- Kitchen: Kitchen (main level, 14 x 12)
- Bedrooms: 4 bedrooms total; Master bedroom (second level, 12 x 11); Bedroom 2 (second level, 12 x 11); Bedroom 3 (second level, 12 x 9); Bedroom 4 (second level, 12 x 8)
- Bathrooms: 2 full bathrooms
- Heating & cooling: Natural gas forced-air heating; Central air conditioning
- Interior features: 8 total rooms; Unfinished full basement; Bonus room (third level, 24 x 24); Mud room (main level, 22 x 7)
- Laundry & utility: Laundry room (basement, 10 x 10)
Neighborhood map
What this means for you Summary
Snapshot
- This is a 4-bed/2.0-bath single-family listed at $115k.
Deal economics
- At list price, monthly cash flow is $898 ($11k/yr) — positive.
- The deal already cash-flows at list — no discount required.
- Meets the 1% rule at list price ($2k rent vs $115k).
- Recommended offer: $112k (3.0% below list) — sets the bar for market timing.
- Cap rate 15.7% vs local median 6.4% in Chicago Heights — top-decile yield for the area; either an underpriced asset or a hidden risk that comps aren't pricing in. Stress-test before assuming the spread holds.
Location & tenants
- Location reads 71/100 on livability (#339 in IL) — a middle-class / working-renter tenant base. Strengths: commute A+, cost of living A+, housing A+; Watch: employment C-, schools F, crime F.
- Bloom Twp Hsd 206 (suburban): math 8% / reading 9% proficiency, ranked #591 of 620 in IL (top 95%) — low school quality limits family demand, transient renter base, plan for 1-2y turnover.
- Market conditions: Rents rising fast (+6.5%/yr); 222 active listings in the ZIP; 1 comparable units currently listed for rent nearby; 6,272 units permitted in Cook County in 2024 (4,658 in 5+ unit buildings).
- This rent runs 41% of the median local income ($62k/yr) — at the standard rent-burdened threshold; future hikes will face affordability resistance.
Forward outlook
- Local home prices are declining (-3.0%/yr); year-one equity from $795 of loan paydown is wiped out by about $3k of value loss. Plan a longer hold.
- At projected returns (-3.0% appreciation + 6.5% rent growth), your $32k cash investment doubles in ~4 years — after that, you're playing with house money.
Negotiation context
- It's been on market 42 days — a 3% lower offer ($112k) is reasonable based on typical stale-listing flexibility.
- 2 sale attempts since 14y ago; this cycle's ask is 135% above the opening price — seller raised mid-cycle; expect resistance to lowballs.
- Current owner paid $28k; list at $115k implies a 318% gain — meaningful room to come down on a strong offer.
Risks & watch-outs
- Watch-outs: built in 1910 — expect roof / HVAC / electrical / plumbing capex.
Questions for the listing agent
- It's been on market 42 days. Have you received any prior offers? Is the seller open to a 3% concession, seller financing, or rate buy-down credit?
- Built in 1910 — when were the roof, HVAC, electrical panel, plumbing, and water heater last replaced?
- Is there a deadline driving the sale (1031 exchange, divorce, estate, relocation)? That informs how much negotiation room exists.
- Schools are F-rated, which usually means shorter tenancies and higher turnover. Who's the typical renter profile here, and what's been the actual vacancy rate?
- Crime grade is F in this area — have there been break-ins, vandalism, or insurance claims at this property in the last 3 years? What carrier currently insures it and at what premium?
- What's the average days-on-market for RENTAL listings here right now (not sales)? A rising rental-DOM trend means longer vacancies and softer asking-rent achievability than the comps imply.
- What's the recent tenant-quality profile in this submarket — average credit score on applications, eviction rate, late-payment / NSF rate, and stable-employment percentage? A property-management company in the area should have these aggregated.
- How much new for-sale + rental construction is in the pipeline within 1–3 miles? Heavy new supply typically softens prices + rents 12–24 months out; constrained supply supports both.
Investment metrics
- 1% rule
- 1.86% ✓
- Cap rate
- 15.66%
- Cash-on-cash
- 33.46%
- DSCR
- 2.49
- GRM
- 4.5
CMA / ARV
- ARV (on-the-fly)
- $263,040
- Comps found
- 12
Show comp detail 12 sales within ~0.75 mi
| Address | Dist | Beds/Ba | Sqft | Sold | Price | $/sf | Match |
|---|---|---|---|---|---|---|---|
| 210 W 16th Pl | 0.04mi | 5/3.0 (+1) | 2,016 (-8%) | 1mo | $310,900 | $154 | 75 |
| 260 W 15th Pl | 0.13mi | 4/2.0 | 1,886 (-14%) | 3mo | $190,556 | $101 | 68 |
| 208 Country Club Rd | 0.48mi | 4/3.0 | 2,180 (-0%) | 11mo | $300,000 | $138 | 64 |
| 213 Country Club Rd | 0.52mi | 4/2.5 | 2,374 (+8%) | 1mo | $350,000 | $147 | 59 |
| 119 W 16th Pl | 0.26mi | 5/1.5 (+1) | 2,038 (-7%) | 15mo | $245,000 | $120 | 57 |
| 141 W 13th St | 0.49mi | 3/3.0 (-1) | 2,143 (-2%) | 10mo | $234,900 | $110 | 56 |
| 1305 Campbell Ave | 0.42mi | 4/2.0 | 1,995 (-9%) | 14mo | $220,000 | $110 | 54 |
| 1241 Franklin Ave | 0.47mi | 3/2.0 (-1) | 2,300 (+5%) | 13mo | $283,000 | $123 | 54 |
| 351 16th Pl | 0.26mi | 3/1.0 (-1) | 1,864 (-15%) | 3mo | $120,000 | $64 | 51 |
| 1328 Otto Blvd | 0.74mi | 4/3.0 | 2,400 (+10%) | 1mo | $285,000 | $119 | 45 |
| 36 Forest Ave | 0.73mi | 4/1.5 | 2,076 (-5%) | 14mo | $55,000 | $26 | 44 |
| 61 W Main St | 0.52mi | 3/2.0 (-1) | 1,900 (-13%) | 15mo | $270,000 | $142 | 36 |
Match score weights: distance 35% · size 25% · config 20% · recency 20%. Top-matched comps best support the ARV.
Projected returns pro-forma
-3.0% appreciation · 6.48% rent growth · sell at horizon
- IRR
- 32.6%
- Equity multiple
- 2.44×
- Total profit
- $46,340
- Equity at exit
- $17,147
- IRR
- 41.5%
- Equity multiple
- 5.61×
- Total profit
- $148,333
- Equity at exit
- $9,943
Cash invested: $32,200 (down + closing). Projections, not guarantees.
Landlord ↔ Tenant lean methodology
- Overall (STATE)
- 43 Moderately Tenant-Leaning
- State Illinois
- 43 Moderately Tenant-Leaning · D+7
- County
- — inherits STATE
- City
- — inherits STATE
ZIP-level market 60411
- Home prices YoY
- -33.9%
- Rents YoY
- 6.5%
- Active inventory
- 222
- Price-to-rent
- 4.5×
Monthly cashflow live
- Estimated rent
- $2,142 medium interval (Pro) →
- Mortgage (P&I)
- −$603
- Tax est. 1.5%
- −$144 /mo · $1,725/yr
- Insurance
- −$48
- HOA
- −$0
- Vacancy / Maint / Mgmt
- −$450
- Net cashflow
- $898
Break-even live
UW: 25.0% down · 7.5% · 30yr · 1.5% tax · 5.0% vac · 8.0% maint · 8.0% mgmt
Financing live
Cash to close
- Down payment
- $28,750
- Closing costs
- $3,450
- Reserves months
- —
- Total cash needed
- —
Loan-product check · same deal, 3 products live
Conventional
25% down · 7.5% · 30yr
- Down + closing
- —
- Monthly P&I
- —
- Monthly cashflow
- —
- DSCR
- —
- Eligible?
- —
Personal DTI + credit; lowest rate.
DSCR
20% down · 8.5% · 30yr
- Down + closing
- —
- Monthly P&I
- —
- Monthly cashflow
- —
- DSCR
- —
- Eligible?
- —
No personal income docs; deal must DSCR.
Hard money
10% down · 12.0% · 12mo
- Down + closing
- —
- Monthly P&I
- —
- Monthly cashflow
- —
- DSCR
- —
- Eligible?
- —
Short-term bridge; refi at stabilization.
Rent comps 1 comps
| Address | Beds | Baths | Sqft | Rent | $/sqft | DOM | Units | Dist |
|---|---|---|---|---|---|---|---|---|
| 1665 Buena Vista Ave Unit 3 Chicago Heights, IL | 4.0 | 1.0 | 1700 | $1,800 | $1.06 | 18d | 1 | 0.28mi |
Listing history 24 events
-
2026-06-18days on market $115,000 Active 42 DOM
-
2026-06-17days on market $115,000 Active 41 DOM
-
2026-06-16days on market $115,000 Active 40 DOM
-
2026-06-15price $115,000 Active 39 DOM
-
2026-06-15days on market $130,000 Active 39 DOM
-
2026-06-13days on market $130,000 Active 37 DOM
-
2026-06-13days on market $130,000 Active 36 DOM
-
2026-06-09days on market $130,000 Active 33 DOM
-
2026-06-08days on market $130,000 Active 32 DOM
-
2026-06-07days on market $130,000 Active 31 DOM
-
2026-06-04days on market $130,000 Active 28 DOM
-
2026-06-03days on market $130,000 Active 27 DOM
-
2026-06-02days on market $130,000 Active 26 DOM
-
2026-06-01days on market $130,000 Active 25 DOM
-
2026-05-31days on market $130,000 Active 24 DOM
-
2013-08-23soldstatus $27,500 Closed Sale 369-char remark
Show marketing remark (369 chars)
ROOMY 4 BDRM/2 BATH 2-STORY W/DET'D GARAGE BEING SOLD AS IS. PROOF OF FUNDS OR LETTER FROM BANK/MTG COMPANY REQUESTED. ADDENDUMS REQ'D-ACCESS VIA MLS. SELLER RESERVES RIGHT TO NEGOTIATE OWNER OCCUPANT OR PUBLIC ENTITY OFFERS FOR FIRST 15 DAYS OF LISTING. THIS IS A FANNIE MAE HOMEPATH PROPERTY-ELIGIBLE FOR HOMEPATH AND HOMEPATH RENO FINANCING-FOR AS LITTLE AT 3% DOWN.
-
2013-06-17status Pending 369-char remark
Show marketing remark (369 chars)
ROOMY 4 BDRM/2 BATH 2-STORY W/DET'D GARAGE BEING SOLD AS IS. PROOF OF FUNDS OR LETTER FROM BANK/MTG COMPANY REQUESTED. ADDENDUMS REQ'D-ACCESS VIA MLS. SELLER RESERVES RIGHT TO NEGOTIATE OWNER OCCUPANT OR PUBLIC ENTITY OFFERS FOR FIRST 15 DAYS OF LISTING. THIS IS A FANNIE MAE HOMEPATH PROPERTY-ELIGIBLE FOR HOMEPATH AND HOMEPATH RENO FINANCING-FOR AS LITTLE AT 3% DOWN.
-
2013-05-31price $32,000 Price Change 369-char remark
Show marketing remark (369 chars)
ROOMY 4 BDRM/2 BATH 2-STORY W/DET'D GARAGE BEING SOLD AS IS. PROOF OF FUNDS OR LETTER FROM BANK/MTG COMPANY REQUESTED. ADDENDUMS REQ'D-ACCESS VIA MLS. SELLER RESERVES RIGHT TO NEGOTIATE OWNER OCCUPANT OR PUBLIC ENTITY OFFERS FOR FIRST 15 DAYS OF LISTING. THIS IS A FANNIE MAE HOMEPATH PROPERTY-ELIGIBLE FOR HOMEPATH AND HOMEPATH RENO FINANCING-FOR AS LITTLE AT 3% DOWN.
-
2013-04-26price $36,500 Price Change 369-char remark
Show marketing remark (369 chars)
ROOMY 4 BDRM/2 BATH 2-STORY W/DET'D GARAGE BEING SOLD AS IS. PROOF OF FUNDS OR LETTER FROM BANK/MTG COMPANY REQUESTED. ADDENDUMS REQ'D-ACCESS VIA MLS. SELLER RESERVES RIGHT TO NEGOTIATE OWNER OCCUPANT OR PUBLIC ENTITY OFFERS FOR FIRST 15 DAYS OF LISTING. THIS IS A FANNIE MAE HOMEPATH PROPERTY-ELIGIBLE FOR HOMEPATH AND HOMEPATH RENO FINANCING-FOR AS LITTLE AT 3% DOWN.
-
2013-03-15price $42,900 Price Change 369-char remark
Show marketing remark (369 chars)
ROOMY 4 BDRM/2 BATH 2-STORY W/DET'D GARAGE BEING SOLD AS IS. PROOF OF FUNDS OR LETTER FROM BANK/MTG COMPANY REQUESTED. ADDENDUMS REQ'D-ACCESS VIA MLS. SELLER RESERVES RIGHT TO NEGOTIATE OWNER OCCUPANT OR PUBLIC ENTITY OFFERS FOR FIRST 15 DAYS OF LISTING. THIS IS A FANNIE MAE HOMEPATH PROPERTY-ELIGIBLE FOR HOMEPATH AND HOMEPATH RENO FINANCING-FOR AS LITTLE AT 3% DOWN.
-
2013-02-13$48,900 New 369-char remark
Show marketing remark (369 chars)
ROOMY 4 BDRM/2 BATH 2-STORY W/DET'D GARAGE BEING SOLD AS IS. PROOF OF FUNDS OR LETTER FROM BANK/MTG COMPANY REQUESTED. ADDENDUMS REQ'D-ACCESS VIA MLS. SELLER RESERVES RIGHT TO NEGOTIATE OWNER OCCUPANT OR PUBLIC ENTITY OFFERS FOR FIRST 15 DAYS OF LISTING. THIS IS A FANNIE MAE HOMEPATH PROPERTY-ELIGIBLE FOR HOMEPATH AND HOMEPATH RENO FINANCING-FOR AS LITTLE AT 3% DOWN.
-
2013-01-11historical
-
2012-02-29New
-
1997-01-21soldstatus $94,900
ⓘ Source: listings_history table (triggers on properties + properties_extension) + one-shot
backfill from property_details.listing_events for pre-trigger history.
Climate risk First Street
- Flood 1/10 Low FEMA zone X (unshaded) · 0% chance over 30 yrs
- Wildfire 1/10 Low
- Heat 3/10 Moderate 7 d/yr ≥101°F today · 16 d/yr by 30 yrs out
- Wind 2/10 Low
- Air quality 2/10 Low 1 unhealthy d/yr today · 1 by 30 yrs out
Nearby sold comps map
Loading sold comps map…
Walkable amenities ~0.75 mi
Loading nearby amenities…
Taxation est. · year 1
- Rental income
- $25,709
- − Mortgage interest
- −$6,442
- − Property taxes
- −$1,725
- − Insurance
- −$575
- − Repairs & maintenance
- −$2,057
- − Management
- −$2,057
- − Depreciation
- −$3,345
- Taxable income
- $9,508
- Est. tax owed @ 24.0%
- −$2,282
- After-tax cash flow
- $8,491/yr
For passive investors: Depreciation is non-cash, so a rental often shows a tax loss while cash-flowing — sheltering income. Rental losses are passive: they offset passive income freely, and up to $25,000/yr can offset ordinary (W-2) income if you actively participate and your MAGI is under $100k (phasing out to $0 by $150k); unused losses carry forward. On sale, claimed depreciation is recaptured at up to 25%, and gains may owe capital-gains tax (a 1031 exchange can defer both). Figures are a year-1 estimate at your 24.0% rate — not tax advice; consult a CPA.
Schools (NCES district)
- District
- Bloom Twp Hsd 206
- NCES district ID
- 1706420
- Math proficiency
- 8% ▼ -3.00%
- Reading proficiency
- 9% ▼ -8.00%
- Median HH income
- $39,795
- Composite
- 7.4/100
- National rank
- #9952
- State rank
- #591 of 620 in IL
Livability — Chicago Heights
- Score
- 71/100
- State rank
- #339
- US rank
- #6836
Category grades
Schools grade is shown separately in the Schools card above.
Census & demographics
- Census place
- Chicago Heights, IL
- County
- Cook County · 4,486,803 people
- City population
- 52,175
- Metro
- Chicago-Naperville-Elgin, IL-IN-WI
- Population (ZIP)
- 52,175
- Household income
- $62,073
- Rent vs Own
- Severe rent burden
- 1714.0
Population outlook (Cook County) Hauer SSP2
- Today (2025)
- 5,347,519 people
- By 2030
- 5,357,703 · +0.2%
- By 2040
- 5,324,924 · -0.4%
- By 2050
- 5,230,762 · -2.2%
- By 2075
- 4,785,735 · -10.5%
- By 2100
- 4,188,836 · -21.7%
Race, ethnicity, and origin ACS 2023
- Neighborhood character
- Diverse neighborhood (Simpson 0.66)
- Race & ethnicity
- Black 49% Hispanic / Latino 26% White 19% Two or more races 11%
- Hispanic origin (detail)
- Mexican 22% Puerto Rican 2%
- Common ancestry
- Romanian 4% Portuguese 1% Lithuanian 1%
- Foreign-born
- 12% · Canada
- Languages at home
- 76% English-only · Spanish 21% Russian/Polish/Slavic 1% Other Indo-European 1%
Political lean MEDSL · Cook
- 2024 margin
- Solid D (+42.0) · D 70.4% · R 28.4% · Other 1.2%
- 2008→2024 swing
- -11.4pp toward R · 2008: 53.4pp · 2024: 42.0pp
- All cycles
- 2024: D+42.0 2020: D+50.3 2016: D+53.0 2012: D+49.4 2008: D+53.4
Not yet ingested
- Civics
- —
Market trends
- HPI YoY
- ▼ -108.75%
- Current HPI
- 212.4058
- Rent YoY
- ▲ 6.48%
- Metro
- Chicago-Naperville-Elgin, IL-IN-WI
- State GDP YoY
- ▲ 1.59%
- F500 in state
- 60
Industry mix (Fortune 500 HQ in IL)
| Industry | F500 HQs | Revenue |
|---|---|---|
| Insurance | 4 | $201B |
|
||
| Consumer Goods | 4 | $87B |
|
||
| Industrial Machinery | 3 | $64B |
|
||
| Healthcare | 2 | $55B |
|
||
| Retail / Pharmacy | 1 | $148B |
|
||
| Agriculture / Food | 1 | $86B |
|
||
Price history
-71.0% since first listed9 events — show timeline
- 2013-08-23 Sold (MLS) $27,500 MRED as Distributed by MLS Grid
- 2013-06-17 Pending — MRED as Distributed by MLS Grid
- 2013-05-31 Price Changed $32,000 MRED as Distributed by MLS Grid
- 2013-04-26 Price Changed $36,500 MRED as Distributed by MLS Grid
- 2013-03-15 Price Changed $42,900 MRED as Distributed by MLS Grid
- 2013-02-13 Listed $48,900 MRED as Distributed by MLS Grid
- 2013-01-11 Listing Removed — MRED as Distributed by MLS Grid
- 2012-02-29 Listed — MRED as Distributed by MLS Grid
- 1997-01-21 Sold (Public Records) $94,900 Public Records
Property tax history
+3.4%/yrLatest (2023): $5,757 · -5.7% YoY. Source: county tax records.
Cash-flow waterfall
monthlySold comps — $/sqft
last 12 mo · ≤1 miLoading sold comps…