187 Ballard St #62 · El Cajon, CA
Flood risk 4/10 · Minor
- FEMA flood zone
- X (unshaded)
- Chance of flooding over 30 yrs
- 0.2%
- Est. flood insurance / yr
- $507 – $1,088
Fire risk 1/10 · Minimal
- Est. fire insurance / yr
- $659 – $1,223
Heat risk 5/10 · Moderate
- Hot days now (above 99°F)
- 7 days/yr
- Hot days in 30 yrs
- 20 days/yr
Wind risk 1/10 · Minimal
- Chance of severe wind over 30 yrs
- —
Air-quality risk 4/10 · Minor
- Unhealthy air days now
- 6 days/yr
- Unhealthy air days in 30 yrs
- 7 days/yr
Risk factors via First Street. Map © Google.
Why this score? — see what drove the B- grade
The composite is a weighted blend of 9 inputs, each scored 0–100. Each bar is that input's sub-score; the figure is the points it added to the 100-point composite (weight × sub-score).
- Cash flow +30.0/30.0
- 1% rule +10.0/10.0
- DSCR +10.0/10.0
- ARV discount +7.5/15.0
- Schools +4.0/10.0
- Livability +3.5/5.0
- Condition / age +2.5/5.0
- Rent growth +1.8/5.0
- Appreciation +0.0/10.0
$139,900
🖨 Deal sheet 📄 Offer letter ✓ Due diligence
Listing remarks
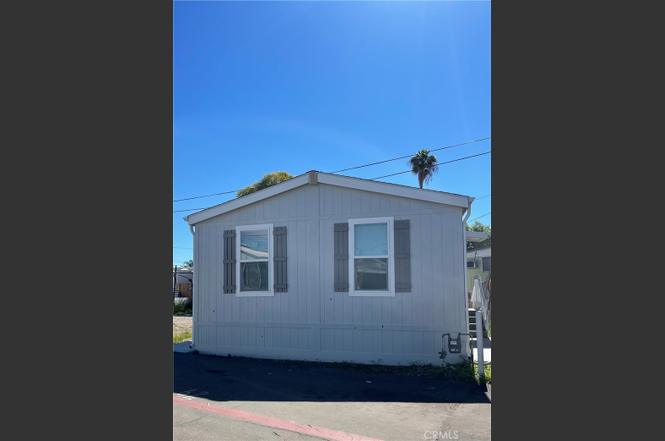
This brand new 2025 manufactured home features 2 bedrooms and 1 bathroom. Upgraded kitchen packages includes: Walk-In pantry, hardwood cabinets with shaker style doors, adjustable shelving, and soft-close, hidden hinges. Stainless steel appliance package includes: 21 CF SxS refrigerator with ice/water, self-cleaning gas range, microwave over range, and garbage disposal. Counters are granite w/ 6" granite backsplash, and granite behind the range, with square edges. Bathroom vanity also has granite counter w/ 6" granite backsplash, tub/shower and rectangular, undermount sink. Recessed canned lighting throughout, 2' faux wood blinds, and more. New home construction nearly complete!
Key facts
- Quartz backsplash
- Hardwood cabinets
- Adjustable shelving
Tags
Property features AI
Finance
- Other: Lot density: 0–1 unit per acre; Paved road access via city streets; Directions: Off Main & Ballard
- Financial info: Land lease payment required (park-provided amount listed separately)
- HOA & community: Located in El Cajon Mobile Home Park; Community features include street lighting; Park manager approval required; Pets allowed with size/breed/number restrictions
Exterior
- Parking: Assigned parking; Street parking; No driveway
- Security: Carbon monoxide detector(s); Smoke detector(s)
- Utilities: Public water (district); Public sewer / sewer connected; Natural gas connected; Electricity connected (standard); Cable available; Telephone available in street
- Home design: Single-story mobile home; Turnkey condition; Mobile home model: Canyon Lake; Mobile dimensions approximately 20' x 35'; Two or more access exits
- Construction: Composition roof; Hardboard siding; Drywall interior walls; Cement board skirt; Pier jack foundation
- Exterior features: Rain gutters; Exterior lighting; Patio (has patio); In-ground community pool with fencing
Interior
- Kitchen: Stone counters; Self-closing cabinet doors and drawers; Gas range; Self-cleaning oven; Microwave; Refrigerator; Garbage disposal; Dishwasher; Water line to refrigerator; Ice maker; Gas water heater
- Bedrooms: All bedrooms located on the main level
- Flooring: Carpet; Laminate
- Bathrooms: One full bathroom; Shower-in-tub; Stone counters in bathroom; Exhaust fan
- Heating & cooling: Forced air heating
- Interior features: Ceiling fan; Pantry; Recessed lighting; Stone counters; Panel doors; Shutters, blinds and screens on windows; Carbon monoxide and smoke detectors; One-level living (all bedrooms on main level)
- Laundry & utility: Community laundry area
Neighborhood map
What this means for you Summary
Snapshot
- This is a 2-bed/1.0-bath manufactured listed at $140k.
Deal economics
- At list price, monthly cash flow is $720 ($9k/yr) — positive.
- The deal already cash-flows at list — no discount required.
- Meets the 1% rule at list price ($2k rent vs $140k).
- Recommended offer: $127k (9.0% below list) — sets the bar for market timing.
- Cap rate 12.5% vs local median 2.4% in El Cajon — top-decile yield for the area; either an underpriced asset or a hidden risk that comps aren't pricing in. Stress-test before assuming the spread holds.
Location & tenants
- Location reads 70/100 on livability (#230 in CA) — a middle-class / working-renter tenant base. Strengths: amenities A+, commute A+; Watch: health & safety C-, crime D+, cost of living F.
- Grossmont Union High (suburban): math 31% / reading 60% proficiency, ranked #173 of 517 in CA (top 34%) — families likely to look elsewhere, expect single-tenant / working-renter base with shorter leases; only 17% free/reduced lunch — higher-income household profile.
- Market conditions: Rents soft (-2.6%/yr); 137 active listings in the ZIP; 40 comparable units currently listed for rent nearby; rentals leasing fast (median 2d on market — plan ~1-2 weeks tenant-placement turnaround); solid renter incomes; 11,759 units permitted in San Diego County in 2024 (7,244 in 5+ unit buildings).
Forward outlook
- Local home prices are declining (-3.0%/yr); year-one equity from $967 of loan paydown is wiped out by about $4k of value loss. Plan a longer hold.
- San Diego County population projected at +20% by 2050 — long-run rental-demand tailwind backs the buy-and-hold thesis.
- At projected returns (-3.0% appreciation + 0.0% rent growth), your $39k cash investment doubles in ~7 years — after that, you're playing with house money.
Negotiation context
- It's been on market 104 days — a 9% lower offer ($127k) is reasonable based on typical stale-listing flexibility.
Risks & watch-outs
- Climate carrying-cost: extreme-heat days projected 7→20/yr by 2055 (HVAC capex compounding) — expect insurance premiums to compound above CPI over the hold.
Questions for the listing agent
- It's been on market 104 days. Have you received any prior offers? Is the seller open to a 9% concession, seller financing, or rate buy-down credit?
- Why hasn't it sold? Are there any deal-killer items the seller is aware of (foundation, flood, title, zoning, code violations)?
- Is there a deadline driving the sale (1031 exchange, divorce, estate, relocation)? That informs how much negotiation room exists.
- Crime grade is D in this area — have there been break-ins, vandalism, or insurance claims at this property in the last 3 years? What carrier currently insures it and at what premium?
- What's the average days-on-market for RENTAL listings here right now (not sales)? A rising rental-DOM trend means longer vacancies and softer asking-rent achievability than the comps imply.
- What's the recent tenant-quality profile in this submarket — average credit score on applications, eviction rate, late-payment / NSF rate, and stable-employment percentage? A property-management company in the area should have these aggregated.
- How much new for-sale + rental construction is in the pipeline within 1–3 miles? Heavy new supply typically softens prices + rents 12–24 months out; constrained supply supports both.
Investment metrics
- 1% rule
- 1.53% ✓
- Cap rate
- 12.47%
- Cash-on-cash
- 22.04%
- DSCR
- 1.98
- GRM
- 5.5
CMA / ARV
- ARV (on-the-fly)
- $69,336
- Comps found
- 9
Show comp detail 9 sales within ~0.75 mi
| Address | Dist | Beds/Ba | Sqft | Sold | Price | $/sf | Match |
|---|---|---|---|---|---|---|---|
| 1174 E Main St #62 | 0.24mi | 2/2.0 | 691 (+7%) | 2mo | $175,000 | $253 | 72 |
| 187 Ballard St #115 | 0.06mi | 2/1.0 | 562 (-13%) | 14mo | $85,000 | $151 | 63 |
| 1174 E Main St Spc 151 | 0.24mi | 2/1.0 | 576 (-11%) | 14mo | $60,000 | $104 | 58 |
| 998 E Main St #46 | 0.54mi | 3/1.5 (+1) | 676 (+4%) | 9mo | $135,000 | $200 | 53 |
| 410 S 1st St Spc 145 | 0.42mi | 2/1.5 | 742 (+14%) | 5mo | $85,575 | $115 | 50 |
| 1285 E Washington Ave #51 | 0.62mi | 1/1.0 (-1) | 624 (-4%) | 15mo | $65,000 | $104 | 48 |
| 150 S Anza St #41 | 0.51mi | 2/1.0 | 600 (-7%) | 20mo | $35,000 | $58 | 48 |
| 410 S 1st St Spc 142 | 0.50mi | 1/1.0 (-1) | 550 (-15%) | 13mo | $52,000 | $95 | 36 |
| 1425 E Madison Ave Spc 57 | 0.68mi | 1/1.0 (-1) | 560 (-14%) | 12mo | $60,000 | $107 | 31 |
Match score weights: distance 35% · size 25% · config 20% · recency 20%. Top-matched comps best support the ARV.
Projected returns pro-forma
-3.0% appreciation · 0.0% rent growth · sell at horizon
- IRR
- 11.3%
- Equity multiple
- 1.43×
- Total profit
- $16,938
- Equity at exit
- $20,860
- IRR
- 17.8%
- Equity multiple
- 2.27×
- Total profit
- $49,719
- Equity at exit
- $12,096
Cash invested: $39,172 (down + closing). Projections, not guarantees.
Landlord ↔ Tenant lean methodology
- Overall (STATE)
- 18 Strongly Tenant-Friendly
- State California
- 18 Strongly Tenant-Friendly · D+13
- County
- — inherits STATE
- City
- — inherits STATE
ZIP-level market 92019
- Rents YoY
- -2.6%
- Active inventory
- 137
- Price-to-rent
- 5.5×
Monthly cashflow live
- Estimated rent
- $2,135 high interval (Pro) →
- Mortgage (P&I)
- −$734
- Tax est. 1.5%
- −$175 /mo · $2,098/yr
- Insurance
- −$58
- HOA
- −$0
- Vacancy / Maint / Mgmt
- −$448
- Net cashflow
- $720
Break-even live
UW: 25.0% down · 7.5% · 30yr · 1.5% tax · 5.0% vac · 8.0% maint · 8.0% mgmt
Financing live
Cash to close
- Down payment
- $34,975
- Closing costs
- $4,197
- Reserves months
- —
- Total cash needed
- —
Loan-product check · same deal, 3 products live
Conventional
25% down · 7.5% · 30yr
- Down + closing
- —
- Monthly P&I
- —
- Monthly cashflow
- —
- DSCR
- —
- Eligible?
- —
Personal DTI + credit; lowest rate.
DSCR
20% down · 8.5% · 30yr
- Down + closing
- —
- Monthly P&I
- —
- Monthly cashflow
- —
- DSCR
- —
- Eligible?
- —
No personal income docs; deal must DSCR.
Hard money
10% down · 12.0% · 12mo
- Down + closing
- —
- Monthly P&I
- —
- Monthly cashflow
- —
- DSCR
- —
- Eligible?
- —
Short-term bridge; refi at stabilization.
Rent comps 40 comps
| Address | Beds | Baths | Sqft | Rent | $/sqft | DOM | Units | Dist |
|---|---|---|---|---|---|---|---|---|
| 187 Ballard St El Cajon, CA | 1.0–2.0 | 1.0–2.0 | 542 | $2,150 | $3.97 | 1d | 2 | 0.03mi |
| 233 Shady Ln El Cajon, CA | 1.0 | 1.0 | 650 | $1,795 | $2.76 | 1d | 1 | 0.24mi |
| 301 Shady Ln El Cajon, CA | 1.0–2.0 | 1.0 | 720 | $2,250 | $3.12 | 1d | 8 | 0.29mi |
| 368 Orlando St El Cajon, CA | 1.0 | 1.0 | 692 | $1,850 | $2.67 | 1d | 1 | 0.31mi |
| 368 Orlando St #21 El Cajon, CA | 1.0 | 1.0 | 692 | $1,850 | $2.67 | 10d | 1 | 0.31mi |
| 180 N 1st St El Cajon, CA | 1.0–2.0 | 1.0–2.0 | 830 | $2,125 | $2.56 | 1d | 3 | 0.34mi |
| 1041-89 E Lexington Ave El Cajon, CA | 1.0–2.0 | 1.0–2.0 | 838 | $2,425 | $2.89 | 1d | 8 | 0.35mi |
| 291 Jamacha Rd El Cajon, CA | 1.0–2.0 | 1.0 | 825 | $2,095 | $2.54 | 1d | 4 | 0.37mi |
| 1037 E Lexington Ave El Cajon, CA | 1.0–3.0 | 1.0–2.0 | 855 | $2,225 | $2.60 | 1d | 5 | 0.39mi |
| 422 Shady Ln El Cajon, CA | 1.0–3.0 | 1.0–2.0 | 900 | $2,304 | $2.56 | 1d | 18 | 0.39mi |
| 421 Shady Ln El Cajon, CA | 1.0 | 1.0 | 575 | $1,708 | $2.97 | 1d | 3 | 0.40mi |
| 1018 E Lexington Ave El Cajon, CA | 1.0 | 1.0 | 670 | $1,800 | $2.69 | 1d | 1 | 0.41mi |
| 359 N 1st St Apt 8 El Cajon, CA | 1.0 | 1.0 | 500 | $1,575 | $3.15 | 1d | 1 | 0.42mi |
| 360 N 1st St El Cajon, CA | 2.0 | 2.0 | 725 | $1,995 | $2.75 | 16d | 1 | 0.44mi |
| 1382 Ivory Ct Unit 1382B El Cajon, CA | 1.0 | 1.0 | 550 | $1,625 | $2.95 | 1d | 1 | 0.48mi |
| 541 N 1st St Apt 14 El Cajon, CA | 1.0 | 1.0 | 550 | $1,550 | $2.82 | 1d | 1 | 0.54mi |
| 588 S Anza St El Cajon, CA | 1.0–2.0 | 1.0 | 767 | $2,100 | $2.74 | 1d | 6 | 0.58mi |
| 233 N Mollison Ave El Cajon, CA | 1.0–2.0 | 1.0–2.0 | 843 | $2,202 | $2.61 | 1d | 10 | 0.62mi |
| 421 S Mollison Ave El Cajon, CA | 1.0–2.0 | 1.0 | 726 | $1,900 | $2.62 | 1d | 2 | 0.63mi |
| 1360 E Madison Ave El Cajon, CA | 1.0–2.0 | 1.0 | 550 | $2,595 | $4.72 | 1d | 22 | 0.63mi |
| 279 S Mollison Ave El Cajon, CA | 1.0 | 1.0 | 570 | $1,950 | $3.42 | 1d | 1 | 0.64mi |
| 1343 Oakdale Ave El Cajon, CA | 1.0–2.0 | 1.0–2.0 | 800 | $2,195 | $2.74 | 1d | 1 | 0.65mi |
| 150 S Mollison Ave El Cajon, CA | 1.0 | 1.0 | 515 | $1,800 | $3.50 | 1d | 1 | 0.66mi |
| 390 S Mollison Ave El Cajon, CA | 1.0 | 1.0 | 750 | $1,725 | $2.30 | 1d | 1 | 0.67mi |
| 523 Grape St El Cajon, CA | 1.0 | 1.0 | 648 | $1,695 | $2.62 | 1d | 2 | 0.69mi |
| 280 N Mollison Ave El Cajon, CA | 1.0–2.0 | 1.0 | 825 | $2,195 | $2.66 | 1d | 1 | 0.72mi |
| 917 E Madison Ave El Cajon, CA | 2.0 | 1.0 | 750 | $2,195 | $2.93 | 1d | 1 | 0.74mi |
| 545 N Mollison Ave El Cajon, CA | 2.0 | 1.0 | 700 | $2,000 | $2.86 | 7d | 9 | 0.77mi |
| 545 N Mollison Ave El Cajon, CA | 2.0 | 1.0 | 700 | $2,028 | $2.90 | 1d | 11 | 0.77mi |
| 444 S Lincoln Ave El Cajon, CA | 2.0 | 1.0 | 748 | $2,000 | $2.67 | 24d | 1 | 0.84mi |
| 633 E Park Ave El Cajon, CA | 1.0 | 1.0 | 650 | $1,675 | $2.58 | 11d | 1 | 0.89mi |
| 633 E Park Ave Unit 12 El Cajon, CA | 1.0 | 1.0 | 650 | $1,675 | $2.58 | 17d | 1 | 0.89mi |
| 570 S Lincoln Ave El Cajon, CA | 1.0–2.0 | 1.0 | 745 | $2,475 | $3.32 | 3d | 2 | 0.90mi |
| 1037 Peach Ave El Cajon, CA | 1.0 | 1.0 | 560 | $1,694 | $3.03 | 1d | 4 | 0.93mi |
| 1019 Peach Ave El Cajon, CA | 1.0–2.0 | 1.0–2.0 | 700 | $2,161 | $3.09 | 1d | 8 | 0.95mi |
| 195 Ballantyne St Unit 8 El Cajon, CA | 1.0 | 1.0 | 500 | $1,650 | $3.30 | 7d | 1 | 0.97mi |
| 181 Ballantyne St Unit 15 El Cajon, CA | 2.0 | 2.0 | 750 | $2,500 | $3.33 | 7d | 1 | 0.98mi |
| 181 Ballantyne St Apt 12 El Cajon, CA | 2.0 | 1.0 | 583 | $2,067 | $3.55 | 5d | 1 | 0.98mi |
| 200 Taft Ave El Cajon, CA | 2.0 | 2.0 | 700 | $2,175 | $3.11 | 1d | 6 | 0.98mi |
| 798 McClure St Apt 7 El Cajon, CA | 1.0 | 1.0 | 570 | $1,595 | $2.80 | 1d | 1 | 0.99mi |
Listing history 15 events
-
2026-06-18days on market $139,900 Active 104 DOM
-
2026-06-17days on market $139,900 Active 103 DOM
-
2026-06-16days on market $139,900 Active 102 DOM
-
2026-06-15days on market $139,900 Active 101 DOM
-
2026-06-13days on market $139,900 Active 99 DOM
-
2026-06-13days on market $139,900 Active 98 DOM
-
2026-06-09days on market $139,900 Active 95 DOM
-
2026-06-08days on market $139,900 Active 94 DOM
-
2026-06-07days on market $139,900 Active 93 DOM
-
2026-06-04days on market $139,900 Active 90 DOM
-
2026-06-03days on market $139,900 Active 89 DOM
-
2026-06-02days on market $139,900 Active 88 DOM
-
2026-06-01days on market $139,900 Active 87 DOM
-
2026-05-31days on market $139,900 Active 86 DOM
-
2026-03-06$139,900 Active
ⓘ Source: listings_history table (triggers on properties + properties_extension) + one-shot
backfill from property_details.listing_events for pre-trigger history.
Climate risk First Street
- Flood 4/10 Moderate FEMA zone X (unshaded) · 20% chance over 30 yrs
- Wildfire 1/10 Low
- Heat 5/10 Major 7 d/yr ≥99°F today · 20 d/yr by 30 yrs out
- Wind 1/10 Low
- Air quality 4/10 Moderate 6 unhealthy d/yr today · 7 by 30 yrs out
Nearby sold comps map
Loading sold comps map…
Walkable amenities ~0.75 mi
Loading nearby amenities…
Taxation est. · year 1
- Rental income
- $25,617
- − Mortgage interest
- −$7,837
- − Property taxes
- −$2,098
- − Insurance
- −$700
- − Repairs & maintenance
- −$2,049
- − Management
- −$2,049
- − Depreciation
- −$4,070
- Taxable income
- $6,813
- Est. tax owed @ 24.0%
- −$1,635
- After-tax cash flow
- $7,000/yr
For passive investors: Depreciation is non-cash, so a rental often shows a tax loss while cash-flowing — sheltering income. Rental losses are passive: they offset passive income freely, and up to $25,000/yr can offset ordinary (W-2) income if you actively participate and your MAGI is under $100k (phasing out to $0 by $150k); unused losses carry forward. On sale, claimed depreciation is recaptured at up to 25%, and gains may owe capital-gains tax (a 1031 exchange can defer both). Figures are a year-1 estimate at your 24.0% rate — not tax advice; consult a CPA.
Schools (NCES district)
- District
- Grossmont Union High
- NCES district ID
- 0616230
- Math proficiency
- 31% ▼ -1.00%
- Reading proficiency
- 60% ▲ 5.00%
- Median HH income
- $61,801
- Composite
- 40.07/100
- National rank
- #3810
- State rank
- #173 of 517 in CA
Livability — El Cajon
- Score
- 70/100
- State rank
- #230
- US rank
- #7531
Category grades
Schools grade is shown separately in the Schools card above.
Census & demographics
- Census place
- El Cajon, CA
- County
- San Diego County · 3,178,799 people
- City population
- 173,694
- Metro
- San Diego-Chula Vista-Carlsbad, CA
- Population (ZIP)
- 45,351
- Household income
- $101,973
- Rent vs Own
- Severe rent burden
- 1897.0
Population outlook (San Diego County) Hauer SSP2
- Today (2025)
- 3,678,185 people
- By 2030
- 3,856,546 · +4.8%
- By 2040
- 4,171,407 · +13.4%
- By 2050
- 4,421,607 · +20.2%
- By 2075
- 4,831,599 · +31.4%
- By 2100
- 4,832,502 · +31.4%
Race, ethnicity, and origin ACS 2023
- Neighborhood character
- Predominantly White (67%)
- Race & ethnicity
- White 67% Hispanic / Latino 21% Two or more races 15% Asian 3% Black 2%
- Hispanic origin (detail)
- Mexican 19%
- Common ancestry
- Arab 6% Romanian 2% Lithuanian 2%
- Foreign-born
- 22% · Canada, China
- Languages at home
- 69% English-only · Spanish 11% Arabic 10% Other Indo-European 1%
Political lean MEDSL · San Diego
- 2024 margin
- D (+16.8) · D 56.9% · R 40.1% · Other 2.9%
- 2008→2024 swing
- +6.6pp toward D · 2008: 10.2pp · 2024: 16.8pp
- All cycles
- 2024: D+16.8 2020: D+22.8 2016: D+17.8 2012: D+5.1 2008: D+10.2
Not yet ingested
- Civics
- —
Market trends
- HPI YoY
- ▼ -553.81%
- Current HPI
- 349.3085
- Rent YoY
- ▼ -2.61%
- Metro
- San Diego-Chula Vista-Carlsbad, CA
- State GDP YoY
- ▲ 3.21%
- F500 in state
- 116
Industry mix (Fortune 500 HQ in CA)
| Industry | F500 HQs | Revenue |
|---|---|---|
| Technology | 27 | $1,492B |
|
||
| Financial Services | 3 | $174B |
|
||
| Retail | 3 | $44B |
|
||
| Insurance | 3 | $26B |
|
||
| Media / Entertainment | 2 | $115B |
|
||
| Pharmaceuticals / Biotech | 2 | $62B |
|
||
Price history
1 event — show timeline
- 2026-03-06 Listed $139,900 CRMLS
Cash-flow waterfall
monthlySold comps — $/sqft
last 12 mo · ≤1 miLoading sold comps…