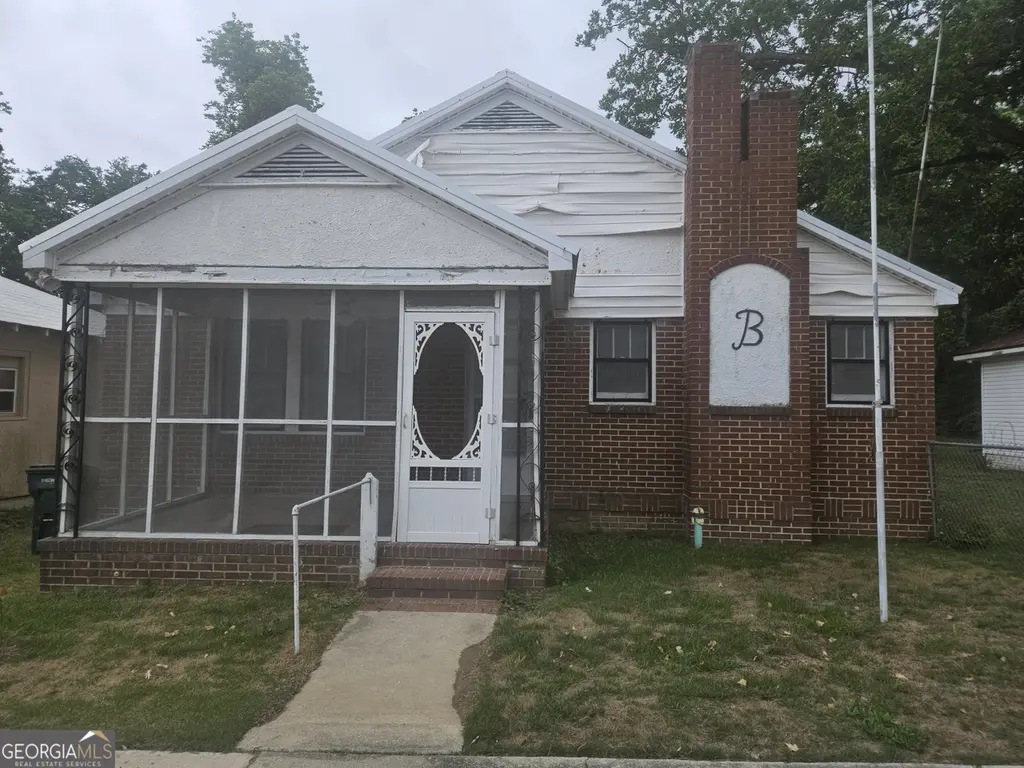
133 Hendrix St · Millen, GA
Flood risk 1/10 · Minimal
- FEMA flood zone
- X (unshaded)
- Chance of flooding over 30 yrs
- 0.0%
- Est. flood insurance / yr
- $507 – $1,088
Fire risk 4/10 · Minor
- Est. fire insurance / yr
- $963 – $1,789
Heat risk 8/10 · Major
- Hot days now (above 110°F)
- 7 days/yr
- Hot days in 30 yrs
- 19 days/yr
Wind risk 8/10 · Major
- Chance of severe wind over 30 yrs
- 80.0%
Air-quality risk 2/10 · Minimal
- Unhealthy air days now
- 2 days/yr
- Unhealthy air days in 30 yrs
- 2 days/yr
Risk factors via First Street. Map © Google.
Why this score? — see what drove the C+ grade
The composite is a weighted blend of 9 inputs, each scored 0–100. Each bar is that input's sub-score; the figure is the points it added to the 100-point composite (weight × sub-score).
- Cash flow +25.7/30.0
- DSCR +8.6/10.0
- Appreciation +6.8/10.0
- ARV discount +6.4/15.0
- 1% rule +6.0/10.0
- Livability +2.9/5.0
- Rent growth +2.5/5.0
- Condition / age +2.5/5.0
- Schools +2.2/10.0
$95,000
🖨 Deal sheet 📄 Offer letter ✓ Due diligence
Listing remarks
This is a great investment property. With 2 bedrooms and 2 bathrooms this makes for a great property for any investor. It has great bones with only little updates needed.
Key facts
- 3,484 sq ft lot
- Garage
- Built 1940
Property features AI
Finance
- Other: Lot size approximately 0.08 acre; Located at 133 Hendrix Street, Millen, GA 30442
- HOA & community: No HOA
Exterior
- Parking: Detached garage
- Utilities: Public water; Public sewer; Electricity available; Natural gas available; Cable available; High-speed internet available; Sewer connected; Water available
- Home design: Single-family house; One level; Residential resale
- Construction: Brick construction; Metal roof; Built in 1940; Crawl space foundation
- Exterior features: Level lot
Interior
- Kitchen: No appliances included
- Bedrooms: 2 bedrooms (both on the main level)
- Flooring: Carpet; Laminate; Vinyl
- Bathrooms: 2 full bathrooms (main level)
- Heating & cooling: Baseboard heating; Central air conditioning
- Interior features: Bookcases; Fireplace (1)
- Laundry & utility: Mud room/laundry area; Crawl space basement
Neighborhood map
What this means for you Summary
Snapshot
- This is a 3-bed/2.0-bath single-family listed at $95k.
Deal economics
- At list price, monthly cash flow is $227 ($3k/yr) — positive.
- The deal already cash-flows at list — no discount required.
- Meets the 1% rule at list price ($1k rent vs $95k).
- Recommended offer: $92k (3.0% below list) — sets the bar for market timing.
- Cap rate 9.2% vs local median 3.8% in Millen — top-decile yield for the area; either an underpriced asset or a hidden risk that comps aren't pricing in. Stress-test before assuming the spread holds.
Location & tenants
- Location reads 57/100 on livability (#464 in GA) — a working-class tenant base; expect higher turnover. Strengths: cost of living A+, housing A+; Watch: crime D, amenities F, commute F.
- Jenkins County (rural): math 26% / reading 29% proficiency, ranked #119 of 174 in GA (top 68%) — low school quality limits family demand, transient renter base, plan for 1-2y turnover; 72% free/reduced lunch — lower-income household profile, screen leases tightly.
- Zoned schools: Jenkins County High School (math 27% / reading 27%, grade F, #162 of 424 statewide, top 40%, 321 students, 93% FRL) — zoned schools average 93% FRL vs 72% district-wide (21 pts higher); higher-poverty schools than district average — tighter screening recommended.
- Market conditions: 44 active listings in the ZIP; 28 units permitted in Jenkins County in 2024 (0 in 5+ unit buildings).
Forward outlook
- In year one you build about $4k of equity ($657 loan paydown + $3k appreciation (3.7% local appreciation)).
- Jenkins County population projected at +19% by 2050 — long-run rental-demand tailwind backs the buy-and-hold thesis.
- At projected returns (3.7% appreciation + 3.0% rent growth), your $27k cash investment doubles in ~4 years — after that, you're playing with house money.
- By year 8, paydown + projected appreciation supports a ~$31k cash-out refi (75% LTV) — recoverable capital for the next deal without selling this one.
Negotiation context
- It's been on market 42 days — a 3% lower offer ($92k) is reasonable based on typical stale-listing flexibility.
Risks & watch-outs
- Watch-outs: built in 1940 — expect roof / HVAC / electrical / plumbing capex.
- Climate carrying-cost: severe wind risk, 80% chance of damaging wind over 30y; extreme-heat days projected 7→19/yr by 2055 (HVAC capex compounding) — expect insurance premiums to compound above CPI over the hold.
Questions for the listing agent
- It's been on market 42 days. Have you received any prior offers? Is the seller open to a 3% concession, seller financing, or rate buy-down credit?
- Built in 1940 — when were the roof, HVAC, electrical panel, plumbing, and water heater last replaced?
- Is there a deadline driving the sale (1031 exchange, divorce, estate, relocation)? That informs how much negotiation room exists.
- Schools are F-rated, which usually means shorter tenancies and higher turnover. Who's the typical renter profile here, and what's been the actual vacancy rate?
- Crime grade is D in this area — have there been break-ins, vandalism, or insurance claims at this property in the last 3 years? What carrier currently insures it and at what premium?
- What's the average days-on-market for RENTAL listings here right now (not sales)? A rising rental-DOM trend means longer vacancies and softer asking-rent achievability than the comps imply.
- What's the recent tenant-quality profile in this submarket — average credit score on applications, eviction rate, late-payment / NSF rate, and stable-employment percentage? A property-management company in the area should have these aggregated.
- How much new for-sale + rental construction is in the pipeline within 1–3 miles? Heavy new supply typically softens prices + rents 12–24 months out; constrained supply supports both.
Investment metrics
- 1% rule
- 1.10% ✓
- Cap rate
- 9.16%
- Cash-on-cash
- 10.25%
- DSCR
- 1.46
- GRM
- 7.5
CMA / ARV
- ARV (median comp)
- $92,796
- List price
- $95,000
- Delta
- 2.37%
- Verdict
- FAIR
- Comps
- 20 within 1.0 mi
Show comp detail 12 sales within ~0.75 mi
| Address | Dist | Beds/Ba | Sqft | Sold | Price | $/sf | Match |
|---|---|---|---|---|---|---|---|
| 423 Richards Ave | 0.38mi | 3/1.0 | 1,091 (+0%) | 2mo | $159,000 | $146 | 76 |
| 428 Riverview St | 0.51mi | 3/2.0 | 1,064 (-2%) | 5mo | $125,000 | $117 | 69 |
| 421 Plum Ave | 0.34mi | 3/1.0 | 984 (-10%) | 2mo | $40,000 | $41 | 62 |
| 827 Davis Ave | 0.42mi | 2/1.0 (-1) | 1,008 (-7%) | 2mo | $20,000 | $20 | 57 |
| 205 Drexel Ave | 0.52mi | 3/1.0 | 1,025 (-6%) | 11mo | $42,000 | $41 | 52 |
| 319 Brown Ave | 0.71mi | 3/1.0 | 1,025 (-6%) | 4mo | $129,900 | $127 | 50 |
| 528 Tarver Ave | 0.65mi | 3/1.0 | 1,000 (-8%) | 4mo | $59,900 | $60 | 48 |
| 522 Hillcrest St | 0.59mi | 3/1.0 | 975 (-10%) | 8mo | $100,000 | $103 | 45 |
| 443 Virginia Ave | 0.45mi | 2/1.0 (-1) | 1,224 (+12%) | 8mo | $117,000 | $96 | 43 |
| 528 Tarver St | 0.65mi | 3/1.0 | 1,000 (-8%) | 12mo | $35,106 | $35 | 42 |
| 647 S Masonic St | 0.71mi | 2/1.0 (-1) | 1,136 (+4%) | 10mo | $63,000 | $55 | 42 |
| 925 Anncliff St | 0.54mi | 2/1.0 (-1) | 1,200 (+10%) | 12mo | $19,800 | $17 | 39 |
Match score weights: distance 35% · size 25% · config 20% · recency 20%. Top-matched comps best support the ARV.
Projected returns pro-forma
3.66% appreciation · 3.0% rent growth · sell at horizon
- IRR
- 18.6%
- Equity multiple
- 2.10×
- Total profit
- $29,252
- Equity at exit
- $46,293
- IRR
- 19.5%
- Equity multiple
- 4.00×
- Total profit
- $79,807
- Equity at exit
- $74,258
Cash invested: $26,600 (down + closing). Projections, not guarantees.
Landlord ↔ Tenant lean methodology
- Overall (STATE)
- 90 Strongly Landlord-Friendly
- State Georgia
- 90 Strongly Landlord-Friendly · R+3
- County
- — inherits STATE
- City
- — inherits STATE
ZIP-level market 30442
- Home prices YoY
- 1.4%
- Active inventory
- 44
- Price-to-rent
- 7.5×
Monthly cashflow live
- Estimated rent
- $1,049 medium interval (Pro) →
- Mortgage (P&I)
- −$498
- Tax from tax record
- −$64 /mo · $762/yr
- Insurance
- −$40
- HOA
- −$0
- Vacancy / Maint / Mgmt
- −$220
- Net cashflow
- $227
Break-even live
UW: 25.0% down · 7.5% · 30yr · 1.5% tax · 5.0% vac · 8.0% maint · 8.0% mgmt
Financing live
Cash to close
- Down payment
- $23,750
- Closing costs
- $2,850
- Reserves months
- —
- Total cash needed
- —
Loan-product check · same deal, 3 products live
Conventional
25% down · 7.5% · 30yr
- Down + closing
- —
- Monthly P&I
- —
- Monthly cashflow
- —
- DSCR
- —
- Eligible?
- —
Personal DTI + credit; lowest rate.
DSCR
20% down · 8.5% · 30yr
- Down + closing
- —
- Monthly P&I
- —
- Monthly cashflow
- —
- DSCR
- —
- Eligible?
- —
No personal income docs; deal must DSCR.
Hard money
10% down · 12.0% · 12mo
- Down + closing
- —
- Monthly P&I
- —
- Monthly cashflow
- —
- DSCR
- —
- Eligible?
- —
Short-term bridge; refi at stabilization.
Listing history 16 events
-
2026-06-18days on market $95,000 Active 42 DOM
-
2026-06-17days on market $95,000 Active 41 DOM
-
2026-06-16days on market $95,000 Active 40 DOM
-
2026-06-15days on market $95,000 Active 39 DOM
-
2026-06-13days on market $95,000 Active 37 DOM
-
2026-06-12days on market $95,000 Active 36 DOM
-
2026-06-09days on market $95,000 Active 33 DOM
-
2026-06-08days on market $95,000 Active 32 DOM
-
2026-06-07days on market $95,000 Active 31 DOM
-
2026-06-07days on market $95,000 Active 30 DOM
-
2026-06-04days on market $95,000 Active 27 DOM
-
2026-06-02days on market $95,000 Active 26 DOM
-
2026-06-01days on market $95,000 Active 25 DOM
-
2026-05-31days on market $95,000 Active 24 DOM
-
2026-05-31days on market $95,000 Active 23 DOM
-
2026-05-06$95,000 New 170-char remark
ⓘ Source: listings_history table (triggers on properties + properties_extension) + one-shot
backfill from property_details.listing_events for pre-trigger history.
Tax reassessment forecast GA · Resets to sale price
- Current annual tax
- $762 · $64/mo
- Projected year-2 tax
- $874 · $73/mo
- Expected delta
- +$112/yr (+$9/mo · 14.6%)
ⓘ Screening estimate from a state-policy table — verify with the county assessor before closing.
Climate risk First Street
- Flood 1/10 Low FEMA zone X (unshaded) · 0% chance over 30 yrs
- Wildfire 4/10 Moderate
- Heat 8/10 Severe 7 d/yr ≥110°F today · 19 d/yr by 30 yrs out
- Wind 8/10 Severe 80% chance of damaging wind over 30 yrs
- Air quality 2/10 Low 2 unhealthy d/yr today · 2 by 30 yrs out
Nearby sold comps map
Loading sold comps map…
Walkable amenities ~0.75 mi
Loading nearby amenities…
Taxation est. · year 1
- Rental income
- $12,583
- − Mortgage interest
- −$5,321
- − Property taxes
- −$762
- − Insurance
- −$475
- − Repairs & maintenance
- −$1,007
- − Management
- −$1,007
- − Depreciation
- −$2,764
- Taxable income
- $1,248
- Est. tax owed @ 24.0%
- −$299
- After-tax cash flow
- $2,426/yr
For passive investors: Depreciation is non-cash, so a rental often shows a tax loss while cash-flowing — sheltering income. Rental losses are passive: they offset passive income freely, and up to $25,000/yr can offset ordinary (W-2) income if you actively participate and your MAGI is under $100k (phasing out to $0 by $150k); unused losses carry forward. On sale, claimed depreciation is recaptured at up to 25%, and gains may owe capital-gains tax (a 1031 exchange can defer both). Figures are a year-1 estimate at your 24.0% rate — not tax advice; consult a CPA.
Schools (NCES district)
- District
- Jenkins County
- NCES district ID
- 1303090
- Math proficiency
- 26% ▼ -6.00%
- Reading proficiency
- 29% ▲ 1.00%
- Median HH income
- $27,711
- Composite
- 21.99/100
- National rank
- #8207
- State rank
- #119 of 174 in GA
Livability — Millen
- Score
- 57/100
- State rank
- #464
- US rank
- #21989
Category grades
Schools grade is shown separately in the Schools card above.
Census & demographics
- Census place
- Millen, GA
- Population (ZIP)
- 8,484
Population outlook (Jenkins County) Hauer SSP2
- Today (2025)
- 10,173 people
- By 2030
- 10,704 · +5.2%
- By 2040
- 11,551 · +13.5%
- By 2050
- 12,087 · +18.8%
- By 2075
- 12,942 · +27.2%
- By 2100
- 11,684 · +14.9%
Race, ethnicity, and origin ACS 2023
- Neighborhood character
- Majority White (54%)
- Race & ethnicity
- White 54% Black 40% Hispanic / Latino 5% Two or more races 4%
- Common ancestry
- Scottish 1% Italian 1%
- Foreign-born
- 2% · Canada
- Languages at home
- 95% English-only · Spanish 4%
Political lean MEDSL · Jenkins
- 2024 margin
- Solid R (+30.4) · D 34.6% · R 65.0%
- 2008→2024 swing
- -17.2pp toward R · 2008: -13.2pp · 2024: -30.4pp
- All cycles
- 2024: R+30.4 2020: R+25.9 2016: R+25.8 2012: R+11.7 2008: R+13.2
Not yet ingested
- Civics
- —
Market trends
- HPI YoY
- ▲ 3.66%
- Current HPI
- 268.1339
- Rent YoY
- —
- Metro
- —
- State GDP YoY
- ▲ 2.66%
- F500 in state
- 28
Industry mix (Fortune 500 HQ in GA)
| Industry | F500 HQs | Revenue |
|---|---|---|
| Paper / Packaging | 2 | $29B |
|
||
| Retail | 1 | $160B |
|
||
| Transportation / Logistics | 1 | $91B |
|
||
| Airlines | 1 | $62B |
|
||
| Consumer Goods | 1 | $47B |
|
||
| Utilities | 1 | $25B |
|
||
Price history
1 event — show timeline
- 2026-05-06 Listed $95,000 GAMLS
Property tax history
+22.3%/yrLatest (2025): $762 · +15.3% YoY. Source: county tax records.
Cash-flow waterfall
monthlySold comps — $/sqft
last 12 mo · ≤1 miLoading sold comps…