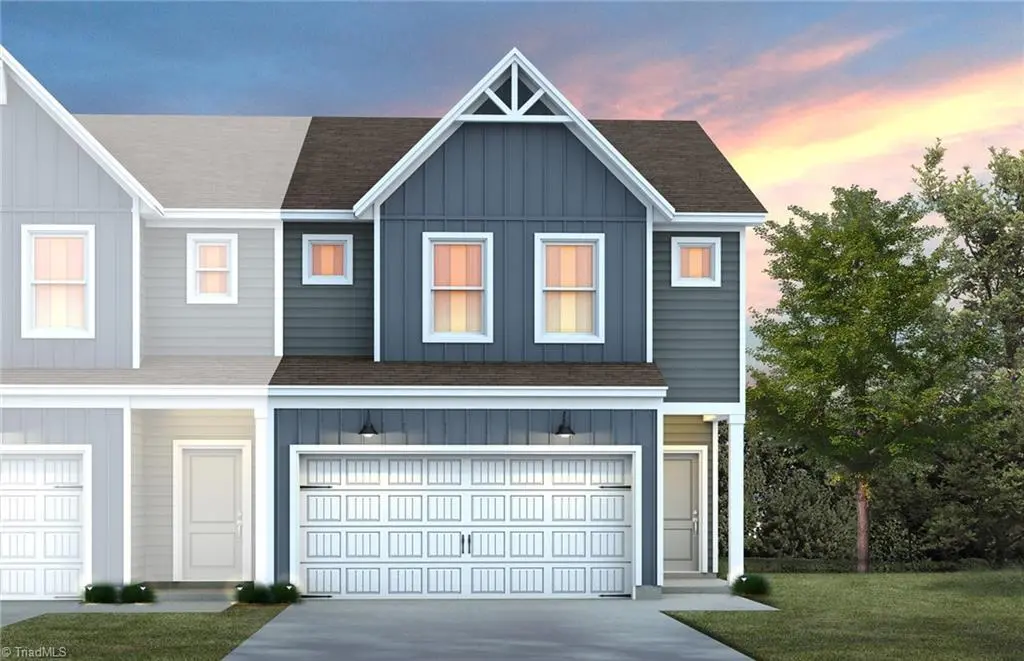
2400 Idol Mill Dr · Greensboro, NC
Flood risk No data
- FEMA flood zone
- —
- Chance of flooding over 30 yrs
- —
- Est. flood insurance / yr
- —
Fire risk No data
- Est. fire insurance / yr
- —
Heat risk No data
- Hot days now (above threshold)
- —
- Hot days in 30 yrs
- —
Wind risk No data
- Chance of severe wind over 30 yrs
- —
Air-quality risk No data
- Unhealthy air days now
- —
- Unhealthy air days in 30 yrs
- —
Risk factors via First Street. Map © Google.
Why this score? — see what drove the D- grade
The composite is a weighted blend of 9 inputs, each scored 0–100. Each bar is that input's sub-score; the figure is the points it added to the 100-point composite (weight × sub-score).
- Appreciation +10.0/10.0
- Cash flow +7.2/30.0
- ARV discount +4.8/15.0
- Livability +4.0/5.0
- Schools +3.6/10.0
- Rent growth +2.5/5.0
- Condition / age +2.5/5.0
- DSCR +1.4/10.0
- 1% rule +0.7/10.0
$296,960
🖨 Deal sheet (PDF) 📄 Offer letter ✓ Due diligence
Listing remarks
This light-filled, end-unit Sparrow floorplan offers a 2-car garage and a thoughtfully designed open-concept layout ideal for entertaining and everyday living. This home provides a modern, functional design that feels welcoming to both family and guests with a spacious gathering room and secondary rooms, coupled with a luxurious feeling owner's suite, this home provides the perfect balance of style and comfort.
Key facts
- Garage
- Pool
- Built 2026
Neighborhood map
What this means for you Summary
Snapshot
- This is a 3-bed/2.5-bath townhouse listed at $297k.
Deal economics
- At list price, monthly cash flow is $-411 ($-5k/yr) — negative.
- To cash-flow at today's rent, offer at most $224k (24.5% below list).
- To meet the 1% rule (rent ≥ 1% of price), the offer needs to be $170k (42.9% below list).
- Recommended offer: $170k (42.9% below list) — sets the bar for 1% rule.
- Cap rate 4.6% vs local median 3.7% in Greensboro — meaningfully above typical; check what's discounted (condition, days-on-market, listing class) to confirm the premium yield is real.
Location & tenants
- Location reads 81/100 on livability (#12 in NC, #1,335 nationally) — a professional / high-income tenant draw. Strengths: amenities A+, commute A+, cost of living A+; Watch: employment D, crime F.
- Guilford County Schools (urban): math 39% / reading 45% proficiency, ranked #99 of 178 in NC (top 56%) — families likely to look elsewhere, expect single-tenant / working-renter base with shorter leases.
- Zoned schools: Alamance Elementary (math 67% / reading 62%, grade B, #147 of 1,410 statewide, top 11%, 516 students, 42% FRL); Southeast Guilford Middle (math 37% / reading 40%, grade F, #244 of 475 statewide, top 53%, 830 students, 57% FRL); Southeast Guilford High (math 51% / reading 54%, grade C-, #287 of 535 statewide, top 54%, 1,273 students, 48% FRL) — zoned schools at 49% FRL track the district average.
- Market conditions: 69 active listings in the ZIP; 3,843 units permitted in Guilford County in 2024 (2,397 in 5+ unit buildings).
Forward outlook
- In year one you build about $32k of equity ($2k loan paydown + $30k appreciation (10.0% local appreciation)).
- Guilford County population projected at +26% by 2050 — long-run rental-demand tailwind backs the buy-and-hold thesis.
- By year 2, paydown + projected appreciation supports a ~$51k cash-out refi (75% LTV) — recoverable capital for the next deal without selling this one.
Negotiation context
- It's been on market 19 days — a 2% lower offer ($293k) is reasonable based on typical stale-listing flexibility.
Questions for the listing agent
- What do current leases actually rent for vs. the listed asking? Can we see a recent rent roll and the last 12 months of T-12 income?
- Is there a deadline driving the sale (1031 exchange, divorce, estate, relocation)? That informs how much negotiation room exists.
- Crime grade is F in this area — have there been break-ins, vandalism, or insurance claims at this property in the last 3 years? What carrier currently insures it and at what premium?
- The area grade is low — what's the realistic commute time and amenity access for the typical tenant pool here? Any planned neighborhood developments (good or bad) we should know about?
- What's the average days-on-market for RENTAL listings here right now (not sales)? A rising rental-DOM trend means longer vacancies and softer asking-rent achievability than the comps imply.
- What's the recent tenant-quality profile in this submarket — average credit score on applications, eviction rate, late-payment / NSF rate, and stable-employment percentage? A property-management company in the area should have these aggregated.
- How much new for-sale + rental construction is in the pipeline within 1–3 miles? Heavy new supply typically softens prices + rents 12–24 months out; constrained supply supports both.
Investment metrics
- 1% rule
- 0.57% ✗
- Cap rate
- 4.63%
- Cash-on-cash
- -5.93%
- DSCR
- 0.74
- GRM
- 14.6
CMA / ARV
- ARV (on-the-fly)
- $280,085
- Comps found
- 12
Show comp detail 12 sales within ~0.75 mi
| Address | Dist | Beds/Ba | Sqft | Sold | Price | $/sf | Match |
|---|---|---|---|---|---|---|---|
| 2410 Idol Mill Dr | 0.02mi | 3/2.5 | 1,807 (0%) | 2mo | $284,990 | $158 | 97 |
| 4555 Dillon Mill Dr | 0.05mi | 3/2.5 | 1,807 (0%) | 4mo | $245,839 | $136 | 95 |
| 4562 Dillon Mill Dr | 0.02mi | 3/2.5 | 1,807 (0%) | 6mo | $304,990 | $169 | 94 |
| 4558 Dillon Mill Dr | 0.02mi | 3/2.5 | 1,616 (-11%) | 1mo | $242,500 | $150 | 80 |
| 2406 Idol Mill Dr | 0.01mi | 3/2.5 | 1,616 (-11%) | 2mo | $249,990 | $155 | 80 |
| 4560 Dillon Mill Dr | 0.02mi | 3/2.5 | 1,616 (-11%) | 3mo | $253,580 | $157 | 79 |
| 4554 Dillon Mill Dr | 0.03mi | 3/2.5 | 1,616 (-11%) | 3mo | $244,990 | $152 | 79 |
| 2404 Idol Mill Dr | 0.01mi | 3/2.5 | 1,616 (-11%) | 4mo | $249,990 | $155 | 79 |
| 4539 Dillon Mill Dr | 0.07mi | 3/2.5 | 1,616 (-11%) | 1mo | $239,990 | $149 | 79 |
| 3435 Pilot Mill Dr | 0.04mi | 3/2.5 | 1,616 (-11%) | 4mo | $222,124 | $137 | 78 |
| 3429 Pilot Mill Dr | 0.07mi | 3/2.5 | 1,616 (-11%) | 3mo | $239,990 | $149 | 77 |
| 3425 Pilot Mill Dr | 0.07mi | 3/2.5 | 1,616 (-11%) | 7mo | $271,680 | $168 | 73 |
Match score weights: distance 35% · size 25% · config 20% · recency 20%. Top-matched comps best support the ARV.
Projected returns pro-forma
10.0% appreciation · 3.0% rent growth · sell at horizon
- IRR
- 20.1%
- Equity multiple
- 2.63×
- Total profit
- $135,383
- Equity at exit
- $267,525
- IRR
- 18.3%
- Equity multiple
- 6.04×
- Total profit
- $418,957
- Equity at exit
- $576,928
Cash invested: $83,149 (down + closing). Projections, not guarantees.
Landlord ↔ Tenant lean methodology
- Overall (STATE)
- 85 Strongly Landlord-Friendly
- State North Carolina
- 85 Strongly Landlord-Friendly · R+3
- County
- — inherits STATE
- City
- — inherits STATE
ZIP-level market 27301
- Home prices YoY
- 4.6%
- Active inventory
- 69
- Price-to-rent
- 14.6×
Monthly cashflow live
- Estimated rent
- $1,695 medium interval (Pro) →
- Mortgage (P&I)
- −$1,557
- Tax from tax record
- −$69 /mo · $833/yr
- Insurance
- −$124
- HOA
- −$0
- Vacancy / Maint / Mgmt
- −$356
- Net cashflow
- $-411
Break-even live
Sensitivity live
| Price | -10% $-243 | -5% $-327 | +0% $-411 | +5% $-495 | +10% $-579 |
|---|---|---|---|---|---|
| Rent | -10% $-545 | -5% $-478 | +0% $-411 | +5% $-344 | +10% $-277 |
| Rate | -1.0pp $-262 | -0.5pp $-336 | base $-411 | +0.5pp $-488 | +1.0pp $-566 |
UW: 25.0% down · 7.5% · 30yr · 1.5% tax · 5.0% vac · 8.0% maint · 8.0% mgmt
Financing live
Cash to close
- Down payment
- $74,240
- Closing costs
- $8,909
- Reserves months
- —
- Total cash needed
- —
Loan-product check · same deal, 3 products live
Conventional
25% down · 7.5% · 30yr
- Down + closing
- —
- Monthly P&I
- —
- Monthly cashflow
- —
- DSCR
- —
- Eligible?
- —
Personal DTI + credit; lowest rate.
DSCR
20% down · 8.5% · 30yr
- Down + closing
- —
- Monthly P&I
- —
- Monthly cashflow
- —
- DSCR
- —
- Eligible?
- —
No personal income docs; deal must DSCR.
Hard money
10% down · 12.0% · 12mo
- Down + closing
- —
- Monthly P&I
- —
- Monthly cashflow
- —
- DSCR
- —
- Eligible?
- —
Short-term bridge; refi at stabilization.
Listing history 2 events
-
2026-04-21status Pending
-
2026-04-02$296,960 Active
ⓘ Source: listings_history table (triggers on properties + properties_extension) + one-shot
backfill from property_details.listing_events for pre-trigger history.
Tax reassessment forecast NC · Resets to sale price
- Current annual tax
- $833 · $69/mo
- Projected year-2 tax
- $2,435 · $203/mo
- Expected delta
- +$1,602/yr (+$133/mo · 192.2%)
ⓘ Screening estimate from a state-policy table — verify with the county assessor before closing.
Nearby sold comps map
Loading sold comps map…
Walkable amenities ~0.75 mi
Loading nearby amenities…
Taxation est. · year 1
- Rental income
- $20,343
- − Mortgage interest
- −$16,634
- − Property taxes
- −$833
- − Insurance
- −$1,485
- − Repairs & maintenance
- −$1,627
- − Management
- −$1,627
- − Depreciation
- −$8,639
- Taxable loss
- −$10,503
- Est. tax savings @ 24.0%
- +$2,521
- After-tax cash flow
- $-2,414/yr
For passive investors: Depreciation is non-cash, so a rental often shows a tax loss while cash-flowing — sheltering income. Rental losses are passive: they offset passive income freely, and up to $25,000/yr can offset ordinary (W-2) income if you actively participate and your MAGI is under $100k (phasing out to $0 by $150k); unused losses carry forward. On sale, claimed depreciation is recaptured at up to 25%, and gains may owe capital-gains tax (a 1031 exchange can defer both). Figures are a year-1 estimate at your 24.0% rate — not tax advice; consult a CPA.
Schools (NCES district)
- District
- Guilford County Schools
- NCES district ID
- 3701920
- Math proficiency
- 39% ▲ 1.00%
- Reading proficiency
- 45% ▲ 1.00%
- Median HH income
- $46,315
- Composite
- 35.78/100
- National rank
- #4842
- State rank
- #99 of 178 in NC
Livability — Greensboro
- Score
- 81/100
- State rank
- #12
- US rank
- #1335
Category grades
Schools grade is shown separately in the Schools card above.
Census & demographics
- Census place
- Greensboro, NC
- City population
- 329,421
- Population (ZIP)
- 10,897
Population outlook (Guilford County) Hauer SSP2
- Today (2025)
- 584,596 people
- By 2030
- 616,851 · +5.5%
- By 2040
- 678,451 · +16.1%
- By 2050
- 734,788 · +25.7%
- By 2075
- 862,985 · +47.6%
- By 2100
- 948,704 · +62.3%
Race, ethnicity, and origin ACS 2023
- Neighborhood character
- Diverse neighborhood (Simpson 0.60)
- Race & ethnicity
- White 54% Black 32% Two or more races 11% Hispanic / Latino 5% Asian 1%
- Hispanic origin (detail)
- Mexican 2%
- Common ancestry
- Italian 6% Slovak 2% Lithuanian 2%
- Foreign-born
- 3% · Canada
- Languages at home
- 95% English-only · Spanish 3% Tagalog/Filipino 2%
Political lean MEDSL · Guilford
- 2024 margin
- Strong D (+21.8) · D 60.2% · R 38.4% · Other 1.4%
- 2008→2024 swing
- +3.5pp toward D · 2008: 18.4pp · 2024: 21.8pp
- All cycles
- 2024: D+21.8 2020: D+23.1 2016: D+20.0 2012: D+16.5 2008: D+18.4
Not yet ingested
- Civics
- —
Market trends
- HPI YoY
- ▲ 13.75%
- Current HPI
- 310.08
- Rent YoY
- —
- Metro
- —
- State GDP YoY
- ▲ 3.28%
- F500 in state
- 26
Industry mix (Fortune 500 HQ in NC)
| Industry | F500 HQs | Revenue |
|---|---|---|
| Financial Services | 2 | $213B |
|
||
| Retail | 2 | $95B |
|
||
| Industrial Conglomerate | 1 | $38B |
|
||
| Metals / Steel | 1 | $35B |
|
||
| Utilities | 1 | $30B |
|
||
| Industrial Machinery | 1 | $19B |
|
||
Price history
2 events — show timeline
- 2026-04-21 Pending — Triad MLS
- 2026-04-02 Listed $296,960 Triad MLS
Cash-flow waterfall
monthlySold comps — $/sqft
last 12 mo · ≤1 miLoading sold comps…