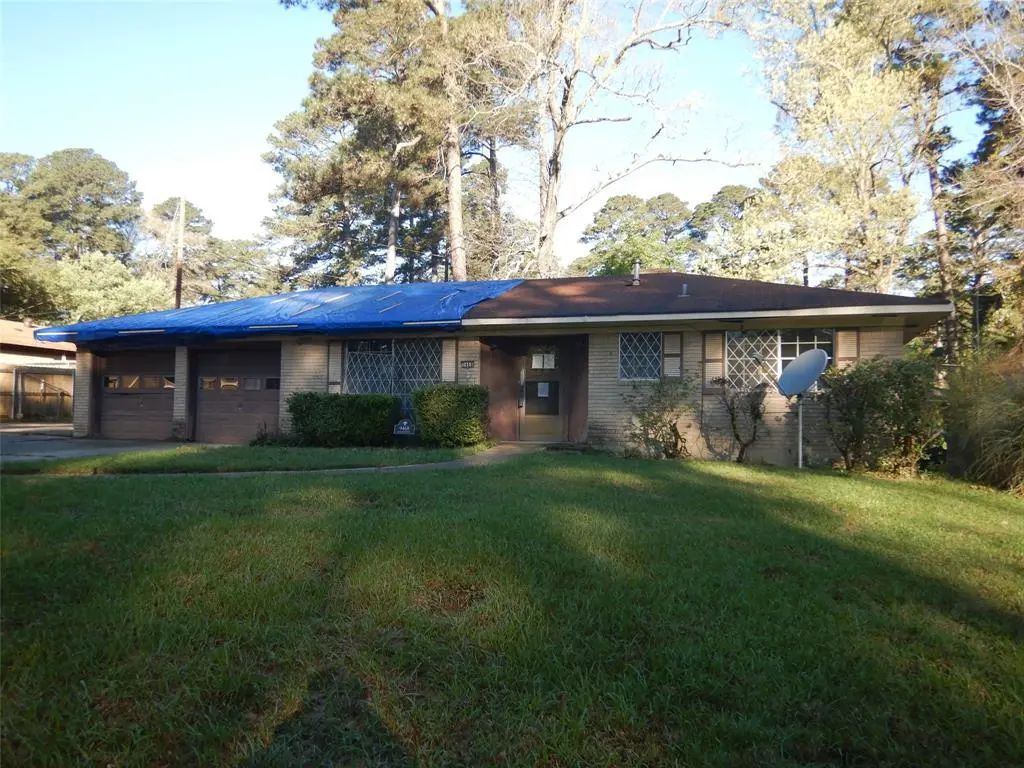
9468 Hemlock Cir · Shreveport, LA
Flood risk 1/10 · Minimal
- FEMA flood zone
- X (unshaded)
- Chance of flooding over 30 yrs
- 0.0%
- Est. flood insurance / yr
- $507 – $1,088
Fire risk 1/10 · Minimal
- Est. fire insurance / yr
- $1,269 – $2,357
Heat risk 7/10 · Major
- Hot days now (above 111°F)
- 7 days/yr
- Hot days in 30 yrs
- 22 days/yr
Wind risk 6/10 · Moderate
- Chance of severe wind over 30 yrs
- 73.0%
Air-quality risk 2/10 · Minimal
- Unhealthy air days now
- 1 days/yr
- Unhealthy air days in 30 yrs
- 1 days/yr
Risk factors via First Street. Map © Google.
Why this score? — see what drove the B- grade
The composite is a weighted blend of 9 inputs, each scored 0–100. Each bar is that input's sub-score; the figure is the points it added to the 100-point composite (weight × sub-score).
- Cash flow +30.0/30.0
- 1% rule +10.0/10.0
- DSCR +10.0/10.0
- ARV discount +7.5/15.0
- Livability +3.0/5.0
- Rent growth +2.9/5.0
- Condition / age +2.5/5.0
- Schools +2.2/10.0
- Appreciation +0.0/10.0
$69,000
🖨 Deal sheet (PDF) 📄 Offer letter ✓ Due diligence
Listing remarks
GREAT LOCATION AND LOTS OF POTENTIAL! THIS ONE HAS A LARGE LIVING ROOM, WITH A FIREPLACE, COZY EAT-IN KITCHEN, GOOD SIZE BEDROOMS, GARAGE, PATIO AND A FENCED YARD. HURRY, THIS ONE IS PRICED TO SELL FAST! Needs TLC. CASE # 222-173983. PROPERTY SOLD AS-IS. Purchaser should obtain expert assistance to evaluate the condition of the property. No repairs can be done before closing. SEE AGENT REMARKS
Key facts
- Fenced yard
- Great location
- Large living room
Tags
Neighborhood map
What this means for you Summary
Snapshot
- This is a 3-bed/2.0-bath single-family listed at $69k.
Deal economics
- At list price, monthly cash flow is $581 ($7k/yr) — positive.
- The deal already cash-flows at list — no discount required.
- Meets the 1% rule at list price ($1k rent vs $69k).
- Cap rate 16.4% vs local median 5.7% in Shreveport — top-decile yield for the area; either an underpriced asset or a hidden risk that comps aren't pricing in. Stress-test before assuming the spread holds.
Location & tenants
- Location reads 59/100 on livability (#270 in LA) — a working-class tenant base; expect higher turnover. Strengths: cost of living A+, housing A; Watch: schools D+, crime F, amenities F.
- Caddo Parish (urban): math 21% / reading 32% proficiency, ranked #53 of 98 in LA (top 54%) — low school quality limits family demand, transient renter base, plan for 1-2y turnover; 64% free/reduced lunch — lower-income household profile, screen leases tightly.
- Market conditions: Rents rising (+1.7%/yr); 115 active listings in the ZIP; 9 comparable units currently listed for rent nearby; rentals at typical pace (median 22d on market — plan ~3-4 weeks tenant-placement turnaround); 44% of comp listings sitting > 30 days — soft ceiling on asking rent; 221 units permitted in Caddo Parish in 2024 (0 in 5+ unit buildings).
- This rent runs 34% of the median local income ($50k/yr) — at the standard rent-burdened threshold; future hikes will face affordability resistance.
Forward outlook
- Local home prices are declining (-3.0%/yr); year-one equity from $477 of loan paydown is wiped out by about $2k of value loss. Plan a longer hold.
- Caddo County population projected at -15% by 2050 — secular population decline; favor cash flow + early exit over multi-decade hold.
- At projected returns (-3.0% appreciation + 1.7% rent growth), your $19k cash investment doubles in ~4 years — after that, you're playing with house money.
Negotiation context
- Only 10 days on market — expect competitive offers; lowballing is unlikely to land.
Risks & watch-outs
- Watch-outs: property tax is 2.5% of price.
- Climate carrying-cost: major wind risk, 73% chance of damaging wind over 30y; extreme-heat days projected 7→22/yr by 2055 (HVAC capex compounding) — expect insurance premiums to compound above CPI over the hold.
Questions for the listing agent
- Built in 1972 — when were the roof, HVAC, electrical panel, plumbing, and water heater last replaced?
- Property tax is high relative to price — has the assessment been appealed recently, and will the sale trigger a re-assessment?
- Is there a deadline driving the sale (1031 exchange, divorce, estate, relocation)? That informs how much negotiation room exists.
- Schools are D-rated, which usually means shorter tenancies and higher turnover. Who's the typical renter profile here, and what's been the actual vacancy rate?
- Crime grade is F in this area — have there been break-ins, vandalism, or insurance claims at this property in the last 3 years? What carrier currently insures it and at what premium?
- What's the average days-on-market for RENTAL listings here right now (not sales)? A rising rental-DOM trend means longer vacancies and softer asking-rent achievability than the comps imply.
- What's the recent tenant-quality profile in this submarket — average credit score on applications, eviction rate, late-payment / NSF rate, and stable-employment percentage? A property-management company in the area should have these aggregated.
- How much new for-sale + rental construction is in the pipeline within 1–3 miles? Heavy new supply typically softens prices + rents 12–24 months out; constrained supply supports both.
Investment metrics
- 1% rule
- 2.05% ✓
- Cap rate
- 16.40%
- Cash-on-cash
- 36.09%
- DSCR
- 2.61
- GRM
- 4.1
CMA / ARV
- ARV (on-the-fly)
- $166,968
- Comps found
- 12
Show comp detail 12 sales within ~0.75 mi
| Address | Dist | Beds/Ba | Sqft | Sold | Price | $/sf | Match |
|---|---|---|---|---|---|---|---|
| 9401 Pitch Pine Dr | 0.43mi | 3/2.0 | 1,534 (-1%) | 8mo | $165,000 | $108 | 72 |
| 9425 Pitch Pne | 0.42mi | 3/2.0 | 1,627 (+5%) | 3mo | $169,000 | $104 | 69 |
| 9449 Pitch Pine Dr | 0.36mi | 4/2.0 (+1) | 1,620 (+5%) | 3mo | $215,000 | $133 | 68 |
| 9633 Blom Blvd | 0.43mi | 3/2.0 | 1,483 (-4%) | 7mo | $189,900 | $128 | 67 |
| 1144 Hallmark Dr | 0.50mi | 3/2.0 | 1,620 (+5%) | 3mo | $199,000 | $123 | 66 |
| 1112 Southland Park Dr | 0.68mi | 3/1.5 | 1,536 (-1%) | 5mo | $142,000 | $92 | 61 |
| 1143 Southland Park Dr | 0.56mi | 4/2.0 (+1) | 1,621 (+5%) | 4mo | $60,000 | $37 | 57 |
| 9521 Palmetto Ln | 0.67mi | 4/1.5 (+1) | 1,536 (-1%) | 6mo | $129,900 | $85 | 56 |
| 2504 Somersworth Ct | 0.72mi | 3/2.0 | 1,644 (+6%) | 9mo | $194,500 | $118 | 49 |
| 9408 Fireside Dr | 0.75mi | 3/2.0 | 1,360 (-12%) | 2mo | $144,900 | $107 | 44 |
| 9425 Palmetto Ln | 0.63mi | 4/2.5 (+1) | 1,722 (+11%) | 6mo | $130,000 | $75 | 39 |
| 9804 E Homewood Cir | 0.66mi | 4/2.0 (+1) | 1,729 (+12%) | 9mo | $185,999 | $108 | 37 |
Match score weights: distance 35% · size 25% · config 20% · recency 20%. Top-matched comps best support the ARV.
Projected returns pro-forma
-3.0% appreciation · 1.74% rent growth · sell at horizon
- IRR
- 30.3%
- Equity multiple
- 2.25×
- Total profit
- $24,114
- Equity at exit
- $10,288
- IRR
- 36.8%
- Equity multiple
- 4.20×
- Total profit
- $61,801
- Equity at exit
- $5,966
Cash invested: $19,320 (down + closing). Projections, not guarantees.
Landlord ↔ Tenant lean methodology
- Overall (STATE)
- 90 Strongly Landlord-Friendly
- State Louisiana
- 90 Strongly Landlord-Friendly · R+12
- County
- — inherits STATE
- City
- — inherits STATE
ZIP-level market 71118
- Rents YoY
- 1.7%
- Active inventory
- 115
- Price-to-rent
- 4.1×
Monthly cashflow live
- Estimated rent
- $1,415 high interval (Pro) →
- Mortgage (P&I)
- −$362
- Tax from tax record
- −$146 /mo · $1,755/yr
- Insurance
- −$29
- HOA
- −$0
- Vacancy / Maint / Mgmt
- −$297
- Net cashflow
- $581
Break-even live
Sensitivity live
| Price | -10% $620 | -5% $601 | +0% $581 | +5% $562 | +10% $542 |
|---|---|---|---|---|---|
| Rent | -10% $469 | -5% $525 | +0% $581 | +5% $637 | +10% $693 |
| Rate | -1.0pp $616 | -0.5pp $599 | base $581 | +0.5pp $563 | +1.0pp $545 |
UW: 25.0% down · 7.5% · 30yr · 1.5% tax · 5.0% vac · 8.0% maint · 8.0% mgmt
Financing live
Cash to close
- Down payment
- $17,250
- Closing costs
- $2,070
- Reserves months
- —
- Total cash needed
- —
Loan-product check · same deal, 3 products live
Conventional
25% down · 7.5% · 30yr
- Down + closing
- —
- Monthly P&I
- —
- Monthly cashflow
- —
- DSCR
- —
- Eligible?
- —
Personal DTI + credit; lowest rate.
DSCR
20% down · 8.5% · 30yr
- Down + closing
- —
- Monthly P&I
- —
- Monthly cashflow
- —
- DSCR
- —
- Eligible?
- —
No personal income docs; deal must DSCR.
Hard money
10% down · 12.0% · 12mo
- Down + closing
- —
- Monthly P&I
- —
- Monthly cashflow
- —
- DSCR
- —
- Eligible?
- —
Short-term bridge; refi at stabilization.
Rent comps 9 comps
| Address | Beds | Baths | Sqft | Rent | $/sqft | DOM | Units | Dist |
|---|---|---|---|---|---|---|---|---|
| 9471 Blom Blvd Shreveport, LA | 3.0 | 1.5 | 1303 | $1,200 | $0.92 | 14d | 1 | 0.20mi |
| 9295 Savanna Dr Shreveport, LA | 3.0 | 1.0 | 1297 | $1,250 | $0.96 | 22d | 1 | 0.58mi |
| 9434 Palmetto Ln Shreveport, LA | 3.0 | 1.5 | 1122 | $1,425 | $1.27 | 44d | 1 | 0.58mi |
| 2045 Bert Kouns Industrial Loop Shreveport, LA | 1.0–3.0 | 1.0–2.0 | 1006 | $1,320 | $1.31 | 44d | 11 | 0.70mi |
| 1029 Bert Kouns Industrial Loop Shreveport, LA | 3.0 | 1.5 | 1134 | $1,500 | $1.32 | 44d | 1 | 0.82mi |
| 9137 Mansfield Rd Shreveport, LA | 1.0–2.0 | 1.0–2.0 | 1018 | $1,700 | $1.67 | 14d | 3 | 0.99mi |
| 3002 Hazel Cir Shreveport, LA | 4.0 | 2.0 | 1553 | $1,500 | $0.97 | 14d | 1 | 1.24mi |
| 2832 Holiday Ln Shreveport, LA | 3.0 | 1.0 | 1104 | $1,250 | $1.13 | 14d | 1 | 1.29mi |
| 9063 Marva Dr Shreveport, LA | 3.0 | 1.5 | 1052 | $1,375 | $1.31 | 44d | 1 | 1.47mi |
Listing history 3 events
-
2026-03-23status Pending
-
2026-03-13$69,000 Active
-
2000-10-16soldstatus
ⓘ Source: listings_history table (triggers on properties + properties_extension) + one-shot
backfill from property_details.listing_events for pre-trigger history.
Tax reassessment forecast LA · Resets to sale price
- Current annual tax
- $1,755 · $146/mo
- Projected year-2 tax
- $1,755 · $146/mo
- Expected delta
- $0/yr ($0/mo · 0.0%)
ⓘ Screening estimate from a state-policy table — verify with the county assessor before closing.
Climate risk First Street
- Flood 1/10 Low FEMA zone X (unshaded) · 0% chance over 30 yrs
- Wildfire 1/10 Low
- Heat 7/10 Severe 7 d/yr ≥111°F today · 22 d/yr by 30 yrs out
- Wind 6/10 Major 73% chance of damaging wind over 30 yrs
- Air quality 2/10 Low 1 unhealthy d/yr today · 1 by 30 yrs out
Nearby sold comps map
Loading sold comps map…
Walkable amenities ~0.75 mi
Loading nearby amenities…
Taxation est. · year 1
- Rental income
- $16,982
- − Mortgage interest
- −$3,865
- − Property taxes
- −$1,755
- − Insurance
- −$345
- − Repairs & maintenance
- −$1,359
- − Management
- −$1,359
- − Depreciation
- −$2,007
- Taxable income
- $6,292
- Est. tax owed @ 24.0%
- −$1,510
- After-tax cash flow
- $5,463/yr
For passive investors: Depreciation is non-cash, so a rental often shows a tax loss while cash-flowing — sheltering income. Rental losses are passive: they offset passive income freely, and up to $25,000/yr can offset ordinary (W-2) income if you actively participate and your MAGI is under $100k (phasing out to $0 by $150k); unused losses carry forward. On sale, claimed depreciation is recaptured at up to 25%, and gains may owe capital-gains tax (a 1031 exchange can defer both). Figures are a year-1 estimate at your 24.0% rate — not tax advice; consult a CPA.
Schools (NCES district)
- District
- Caddo Parish
- NCES district ID
- 2200300
- Math proficiency
- 21% ▼ -33.00%
- Reading proficiency
- 32% ▼ -30.00%
- Median HH income
- $39,227
- Composite
- 22.23/100
- National rank
- #8148
- State rank
- #53 of 98 in LA
Livability — Shreveport
- Score
- 59/100
- State rank
- #270
- US rank
- #19730
Category grades
Schools grade is shown separately in the Schools card above.
Census & demographics
- Census place
- Shreveport, LA
- County
- Caddo Parish · 178,536 people
- City population
- 164,123
- Metro
- Shreveport-Bossier City, LA
- Population (ZIP)
- 23,219
- Household income
- $50,287
- Rent vs Own
- Severe rent burden
- 1046.0
Population outlook (Caddo County) Hauer SSP2
- Today (2025)
- 243,190 people
- By 2030
- 237,231 · -2.5%
- By 2040
- 222,502 · -8.5%
- By 2050
- 206,516 · -15.1%
- By 2075
- 165,706 · -31.9%
- By 2100
- 122,262 · -49.7%
Race, ethnicity, and origin ACS 2023
- Neighborhood character
- Diverse neighborhood (Simpson 0.55)
- Race & ethnicity
- Black 58% White 33% Two or more races 5% Hispanic / Latino 4% Asian 1%
- Common ancestry
- Slovak 2% Lithuanian 2% Serbian 1%
- Foreign-born
- 2% · Canada
- Languages at home
- 97% English-only · Spanish 2%
Political lean MEDSL · Caddo
- 2024 margin
- Toss-up / Even · D 51.6% · R 47.0% · Other 1.4%
- 2008→2024 swing
- +1.6pp toward D · 2008: 3.0pp · 2024: 4.6pp
- All cycles
- 2024: D+4.6 2020: D+6.8 2016: D+4.2 2012: D+4.9 2008: D+3.0
Not yet ingested
- Civics
- —
Market trends
- HPI YoY
- ▼ -78.81%
- Current HPI
- 129.1782
- Rent YoY
- ▲ 1.74%
- Metro
- Shreveport-Bossier City, LA
- State GDP YoY
- ▲ 3.29%
- F500 in state
- 10
Industry mix (Fortune 500 HQ in LA)
| Industry | F500 HQs | Revenue |
|---|---|---|
| Telecommunications | 2 | $23B |
|
||
| Utilities | 1 | $12B |
|
||
| Wholesale / Distribution | 1 | $5B |
|
||
| Advertising | 1 | $2B |
|
||
Price history
3 events — show timeline
- 2026-03-23 Pending — NTREIS
- 2026-03-13 Listed $69,000 NTREIS
- 2000-10-16 Sold (Public Records) — Public Records
Property tax history
+19.6%/yrLatest (2025): $1,755 · +82.5% YoY. Source: county tax records.
Cash-flow waterfall
monthlySold comps — $/sqft
last 12 mo · ≤1 miLoading sold comps…