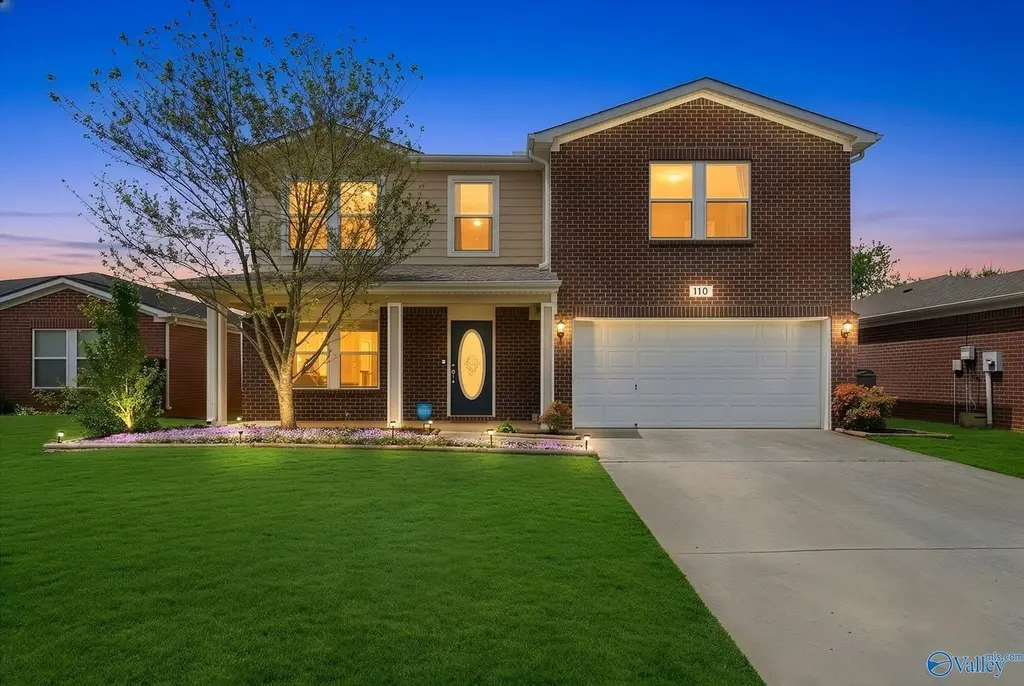
110 Forestbrook Dr · Huntsville, AL
Flood risk 1/10 · Minimal
- FEMA flood zone
- X (unshaded)
- Chance of flooding over 30 yrs
- 0.0%
- Est. flood insurance / yr
- $507 – $1,088
Fire risk 2/10 · Minimal
- Est. fire insurance / yr
- $916 – $1,700
Heat risk 6/10 · Moderate
- Hot days now (above 104°F)
- 7 days/yr
- Hot days in 30 yrs
- 20 days/yr
Wind risk 4/10 · Minor
- Chance of severe wind over 30 yrs
- 19.0%
Air-quality risk 2/10 · Minimal
- Unhealthy air days now
- 0 days/yr
- Unhealthy air days in 30 yrs
- 1 days/yr
Risk factors via First Street. Map © Google.
Why this score? — see what drove the D grade
The composite is a weighted blend of 9 inputs, each scored 0–100. Each bar is that input's sub-score; the figure is the points it added to the 100-point composite (weight × sub-score).
- ARV discount +13.9/15.0
- Cash flow +10.4/30.0
- Livability +4.1/5.0
- Schools +3.7/10.0
- DSCR +3.0/10.0
- Rent growth +2.7/5.0
- Condition / age +2.5/5.0
- 1% rule +1.9/10.0
- Appreciation +0.0/10.0
$299,900
🖨 Deal sheet 📄 Offer letter ✓ Due diligence
Listing remarks MLS
Charming, spacious home with a well-designed layout in a prime location near Madison shopping and Clift Farms! This well-maintained property features major upgrades including a new roof (2020), water heater (2021), and beautiful Pergo XP flooring installed in 2016. The open, functional floor plan, including an upstairs bonus room, offers comfortable living and great flow for everyday life.The downstairs office can be converted to a 4th bedroom. Enjoy the outdoor space with several fruit trees and a garden (can be removed if desired). Convenient to dining, retail, and more!
Key facts
- 6,534 sq ft lot
- Garage
- Built 2007
Neighborhood map
What this means for you Summary
Snapshot
- This is a 3-bed/1.5-bath single-family listed at $300k.
Deal economics
- At list price, monthly cash flow is $-158 ($-2k/yr) — negative.
- To cash-flow at today's rent, offer at most $272k (9.3% below list).
- To meet the 1% rule (rent ≥ 1% of price), the offer needs to be $207k (31.1% below list).
- Recommended offer: $207k (31.1% below list) — sets the bar for 1% rule.
- Cap rate 5.7% vs local median 3.8% in Huntsville — top-decile yield for the area; either an underpriced asset or a hidden risk that comps aren't pricing in. Stress-test before assuming the spread holds.
Location & tenants
- Location reads 82/100 on livability (#3 in AL, #1,082 nationally) — a professional / high-income tenant draw. Strengths: commute A+, cost of living A+, housing A+; Watch: crime F.
- Madison County (rural): math 27% / reading 56% proficiency, ranked #19 of 129 in AL (top 15%) — families likely to look elsewhere, expect single-tenant / working-renter base with shorter leases.
- Market conditions: Rents flat; 203 active listings in the ZIP; 7 comparable units currently listed for rent nearby; rentals lingering (median 44d on market — plan ~5-8 weeks vacancy on turnover, expect pricing pressure); 71% of comp listings sitting > 30 days — soft ceiling on asking rent; solid renter incomes; 4,709 units permitted in Madison County in 2024 (1,186 in 5+ unit buildings).
Forward outlook
- Local home prices are declining (-3.0%/yr); year-one equity from $2k of loan paydown is wiped out by about $9k of value loss. Plan a longer hold.
- Madison County population projected at +18% by 2050 — long-run rental-demand tailwind backs the buy-and-hold thesis.
Negotiation context
- It's been on market 71 days — a 6% lower offer ($282k) is reasonable based on typical stale-listing flexibility.
Risks & watch-outs
- Climate carrying-cost: extreme-heat days projected 7→20/yr by 2055 (HVAC capex compounding) — expect insurance premiums to compound above CPI over the hold.
Questions for the listing agent
- What do current leases actually rent for vs. the listed asking? Can we see a recent rent roll and the last 12 months of T-12 income?
- It's been on market 71 days. Have you received any prior offers? Is the seller open to a 31% concession, seller financing, or rate buy-down credit?
- What does the HOA fee cover, when was the last increase, and are there any pending special assessments or reserve-fund shortfalls?
- Why hasn't it sold? Are there any deal-killer items the seller is aware of (foundation, flood, title, zoning, code violations)?
- Is there a deadline driving the sale (1031 exchange, divorce, estate, relocation)? That informs how much negotiation room exists.
- Crime grade is F in this area — have there been break-ins, vandalism, or insurance claims at this property in the last 3 years? What carrier currently insures it and at what premium?
- The area grade is low — what's the realistic commute time and amenity access for the typical tenant pool here? Any planned neighborhood developments (good or bad) we should know about?
- What's the average days-on-market for RENTAL listings here right now (not sales)? A rising rental-DOM trend means longer vacancies and softer asking-rent achievability than the comps imply.
- What's the recent tenant-quality profile in this submarket — average credit score on applications, eviction rate, late-payment / NSF rate, and stable-employment percentage? A property-management company in the area should have these aggregated.
- How much new for-sale + rental construction is in the pipeline within 1–3 miles? Heavy new supply typically softens prices + rents 12–24 months out; constrained supply supports both.
Investment metrics
- 1% rule
- 0.69% ✗
- Cap rate
- 5.66%
- Cash-on-cash
- -2.25%
- DSCR
- 0.90
- GRM
- 12.1
CMA / ARV
- ARV (median comp)
- $349,612
- List price
- $299,900
- Delta
- -14.22%
- Verdict
- UNDERPRICED
- Comps
- 20 within 1.0 mi
Show comp detail 12 sales within ~0.75 mi
| Address | Dist | Beds/Ba | Sqft | Sold | Price | $/sf | Match |
|---|---|---|---|---|---|---|---|
| 365 Weatherford Dr NW | 0.20mi | 4/2.5 (+1) | 2,833 (-0%) | 1mo | $586,000 | $207 | 81 |
| 114 Pettus Rd | 0.33mi | 4/4.0 (+1) | 2,862 (+1%) | 4mo | $515,000 | $180 | 66 |
| 509 Summer Cove Cir NW | 0.31mi | 4/3.0 (+1) | 2,985 (+5%) | 1mo | $383,000 | $128 | 65 |
| 236 Nettles Dr | 0.46mi | 4/3.0 (+1) | 2,932 (+3%) | 3mo | $531,500 | $181 | 60 |
| 185 Spano Rd | 0.38mi | 3/3.0 | 3,204 (+13%) | 1mo | $615,462 | $192 | 54 |
| 326 Weatherford Dr | 0.40mi | 4/3.5 (+1) | 2,573 (-9%) | 3mo | $453,000 | $176 | 50 |
| 212 Miniver Pl | 0.59mi | 4/3.0 (+1) | 2,953 (+4%) | 6mo | $597,725 | $202 | 50 |
| 102 Ridgewood Dr | 0.60mi | 4/2.5 (+1) | 2,640 (-7%) | 5mo | $387,000 | $147 | 47 |
| 221 Miniver Pl | 0.65mi | 4/3.0 (+1) | 2,981 (+5%) | 6mo | $617,000 | $207 | 46 |
| 211 Miniver Pl | 0.61mi | 4/2.5 (+1) | 2,598 (-8%) | 6mo | $537,000 | $207 | 44 |
| 304 Broadway Ln | 0.52mi | 4/2.5 (+1) | 2,460 (-13%) | 6mo | $479,900 | $195 | 40 |
| 110 Blue Spruce Dr | 0.73mi | 4/3.0 (+1) | 3,172 (+12%) | 1mo | $558,000 | $176 | 34 |
Match score weights: distance 35% · size 25% · config 20% · recency 20%. Top-matched comps best support the ARV.
Projected returns pro-forma
-3.0% appreciation · 0.69% rent growth · sell at horizon
- IRR
- -22.3%
- Equity multiple
- 0.24×
- Total profit
- $-63,484
- Equity at exit
- $44,716
- IRR
- -22.4%
- Equity multiple
- -0.04×
- Total profit
- $-87,199
- Equity at exit
- $25,930
Cash invested: $83,972 (down + closing). Projections, not guarantees.
Landlord ↔ Tenant lean methodology
- Overall (STATE)
- 90 Strongly Landlord-Friendly
- State Alabama
- 90 Strongly Landlord-Friendly · R+15
- County
- — inherits STATE
- City
- — inherits STATE
ZIP-level market 35757
- Home prices YoY
- -10.3%
- Rents YoY
- 0.7%
- Active inventory
- 203
- Price-to-rent
- 12.1×
Monthly cashflow live
- Estimated rent
- $2,068 high interval (Pro) →
- Mortgage (P&I)
- −$1,573
- Tax from tax record
- −$81 /mo · $967/yr
- Insurance
- −$125
- HOA
- −$13
- Vacancy / Maint / Mgmt
- −$434
- Net cashflow
- $-158
Break-even live
UW: 25.0% down · 7.5% · 30yr · 1.5% tax · 5.0% vac · 8.0% maint · 8.0% mgmt
Financing live
Cash to close
- Down payment
- $74,975
- Closing costs
- $8,997
- Reserves months
- —
- Total cash needed
- —
Loan-product check · same deal, 3 products live
Conventional
25% down · 7.5% · 30yr
- Down + closing
- —
- Monthly P&I
- —
- Monthly cashflow
- —
- DSCR
- —
- Eligible?
- —
Personal DTI + credit; lowest rate.
DSCR
20% down · 8.5% · 30yr
- Down + closing
- —
- Monthly P&I
- —
- Monthly cashflow
- —
- DSCR
- —
- Eligible?
- —
No personal income docs; deal must DSCR.
Hard money
10% down · 12.0% · 12mo
- Down + closing
- —
- Monthly P&I
- —
- Monthly cashflow
- —
- DSCR
- —
- Eligible?
- —
Short-term bridge; refi at stabilization.
Rent comps 7 comps
| Address | Beds | Baths | Sqft | Rent | $/sqft | DOM | Units | Dist |
|---|---|---|---|---|---|---|---|---|
| 202 Sagebrook Dr Madison, AL | 4.0 | 2.0 | 2099 | $1,750 | $0.83 | 43d | 1 | 0.31mi |
| 182 Forestbrook Dr Madison, AL | 3.0 | 2.5 | 2316 | $1,800 | $0.78 | 23d | 1 | 0.34mi |
| 602 Penny Jar Ln NW Madison, AL | 4.0 | 2.0 | 2120 | $2,250 | $1.06 | 43d | 1 | 0.59mi |
| 115 Willow Rose Ln Madison, AL | 4.0 | 3.0 | 1942 | $2,300 | $1.18 | 13d | 1 | 0.84mi |
| 9420 Crysillas Dr Madison, AL | 3.0 | 2.5 | 2490 | $2,800 | $1.12 | 43d | 1 | 0.87mi |
| 404 Jasmine Dr Madison, AL | 4.0 | 3.5 | 3530 | $1,895 | $0.54 | 43d | 1 | 0.90mi |
| 9434 Crysillas Dr Madison, AL | 3.0 | 3.5 | 3021 | $3,000 | $0.99 | 43d | 1 | 0.95mi |
HOA detail
- Monthly dues
- $13 · $156/yr
- Likely covers
- water
Listing history 16 events
-
2026-06-18days on market $299,900 Active 71 DOM
-
2026-06-17days on market $299,900 Active 70 DOM
-
2026-06-16days on market $299,900 Active 69 DOM
-
2026-06-15days on market $299,900 Active 68 DOM
-
2026-06-14days on market $299,900 Active 66 DOM
-
2026-06-10days on market $299,900 Active 63 DOM
-
2026-06-09days on market $299,900 Active 62 DOM
-
2026-06-09remarks 613-char remark
-
2026-06-08days on market $299,900 Active 61 DOM
-
2026-06-07days on market $299,900 Active 60 DOM
-
2026-06-02days on market $299,900 Active 55 DOM
-
2026-06-01days on market $299,900 Active 54 DOM
-
2026-05-31days on market $299,900 Active 53 DOM
-
2026-05-30days on market $299,900 Active 52 DOM
-
2026-05-15price $299,900 581-char remark
Show marketing remark (581 chars)
Charming, spacious home with a well-designed layout in a prime location near Madison shopping and Clift Farms! This well-maintained property features major upgrades including a new roof (2020), water heater (2021), and beautiful Pergo XP flooring installed in 2016. The open, functional floor plan, including an upstairs bonus room, offers comfortable living and great flow for everyday life.The downstairs office can be converted to a 4th bedroom. Enjoy the outdoor space with several fruit trees and a garden (can be removed if desired). Convenient to dining, retail, and more!
-
2026-04-09$311,000 Active 581-char remark
Show marketing remark (581 chars)
Charming, spacious home with a well-designed layout in a prime location near Madison shopping and Clift Farms! This well-maintained property features major upgrades including a new roof (2020), water heater (2021), and beautiful Pergo XP flooring installed in 2016. The open, functional floor plan, including an upstairs bonus room, offers comfortable living and great flow for everyday life.The downstairs office can be converted to a 4th bedroom. Enjoy the outdoor space with several fruit trees and a garden (can be removed if desired). Convenient to dining, retail, and more!
ⓘ Source: listings_history table (triggers on properties + properties_extension) + one-shot
backfill from property_details.listing_events for pre-trigger history.
Tax reassessment forecast AL · Resets to sale price
- Current annual tax
- $967 · $81/mo
- Projected year-2 tax
- $1,230 · $102/mo
- Expected delta
- +$263/yr (+$22/mo · 27.2%)
ⓘ Screening estimate from a state-policy table — verify with the county assessor before closing.
Climate risk First Street
- Flood 1/10 Low FEMA zone X (unshaded) · 0% chance over 30 yrs
- Wildfire 2/10 Low
- Heat 6/10 Major 7 d/yr ≥104°F today · 20 d/yr by 30 yrs out
- Wind 4/10 Moderate 19% chance of damaging wind over 30 yrs
- Air quality 2/10 Low 0 unhealthy d/yr today · 1 by 30 yrs out
Nearby sold comps map
Loading sold comps map…
Walkable amenities ~0.75 mi
Loading nearby amenities…
Taxation est. · year 1
- Rental income
- $24,813
- − Mortgage interest
- −$16,799
- − Property taxes
- −$967
- − Insurance
- −$1,500
- − Repairs & maintenance
- −$1,985
- − Management
- −$1,985
- − HOA
- −$156
- − Depreciation
- −$8,724
- Taxable loss
- −$7,303
- Est. tax savings @ 24.0%
- +$1,753
- After-tax cash flow
- $-140/yr
For passive investors: Depreciation is non-cash, so a rental often shows a tax loss while cash-flowing — sheltering income. Rental losses are passive: they offset passive income freely, and up to $25,000/yr can offset ordinary (W-2) income if you actively participate and your MAGI is under $100k (phasing out to $0 by $150k); unused losses carry forward. On sale, claimed depreciation is recaptured at up to 25%, and gains may owe capital-gains tax (a 1031 exchange can defer both). Figures are a year-1 estimate at your 24.0% rate — not tax advice; consult a CPA.
Schools (NCES district)
- District
- Madison County
- NCES district ID
- 0102220
- Math proficiency
- 27% ▼ -32.00%
- Reading proficiency
- 56% ▼ -1.00%
- Median HH income
- $66,058
- Composite
- 37.15/100
- National rank
- #4483
- State rank
- #19 of 129 in AL
Livability — Huntsville
- Score
- 82/100
- State rank
- #3
- US rank
- #1082
Category grades
Schools grade is shown separately in the Schools card above.
Census & demographics
- County
- Madison County · 380,832 people
- City population
- 220,435
- Metro
- Huntsville, AL
- Population (ZIP)
- 18,529
- Household income
- $106,175
- Rent vs Own
- Severe rent burden
- 242.0
Population outlook (Madison County) Hauer SSP2
- Today (2025)
- 392,086 people
- By 2030
- 409,788 · +4.5%
- By 2040
- 440,557 · +12.4%
- By 2050
- 460,990 · +17.6%
- By 2075
- 502,872 · +28.3%
- By 2100
- 513,623 · +31.0%
Race, ethnicity, and origin ACS 2023
- Neighborhood character
- Diverse neighborhood (Simpson 0.56)
- Race & ethnicity
- White 61% Black 26% Two or more races 7% Hispanic / Latino 5% Asian 1%
- Common ancestry
- Italian 3% Romanian 2% Lithuanian 2%
- Foreign-born
- 3% · Canada, South Korea
- Languages at home
- 96% English-only · Spanish 3%
Political lean MEDSL · Madison
- 2024 margin
- Lean R (+9.0) · D 44.7% · R 53.7% · Other 1.6%
- 2008→2024 swing
- +6.0pp toward D · 2008: -14.9pp · 2024: -9.0pp
- All cycles
- 2024: R+9.0 2020: R+8.0 2016: R+16.8 2012: R+18.7 2008: R+14.9
Not yet ingested
- Civics
- —
Market trends
- HPI YoY
- ▼ -31.04%
- Current HPI
- 269.7329
- Rent YoY
- ▲ 0.69%
- Metro
- Huntsville, AL
- State GDP YoY
- ▲ 2.94%
- F500 in state
- 4
Industry mix (Fortune 500 HQ in AL)
| Industry | F500 HQs | Revenue |
|---|---|---|
| Financial Services | 1 | $8B |
|
||
| Healthcare | 1 | $5B |
|
||
Price history
-3.6% since first listed2 events — show timeline
- 2026-05-15 Price Changed $299,900 VMLS
- 2026-04-09 Listed $311,000 VMLS
Property tax history
+5.3%/yrLatest (2024): $967 · +0.0% YoY. Source: county tax records.
Cash-flow waterfall
monthlySold comps — $/sqft
last 12 mo · ≤1 miLoading sold comps…