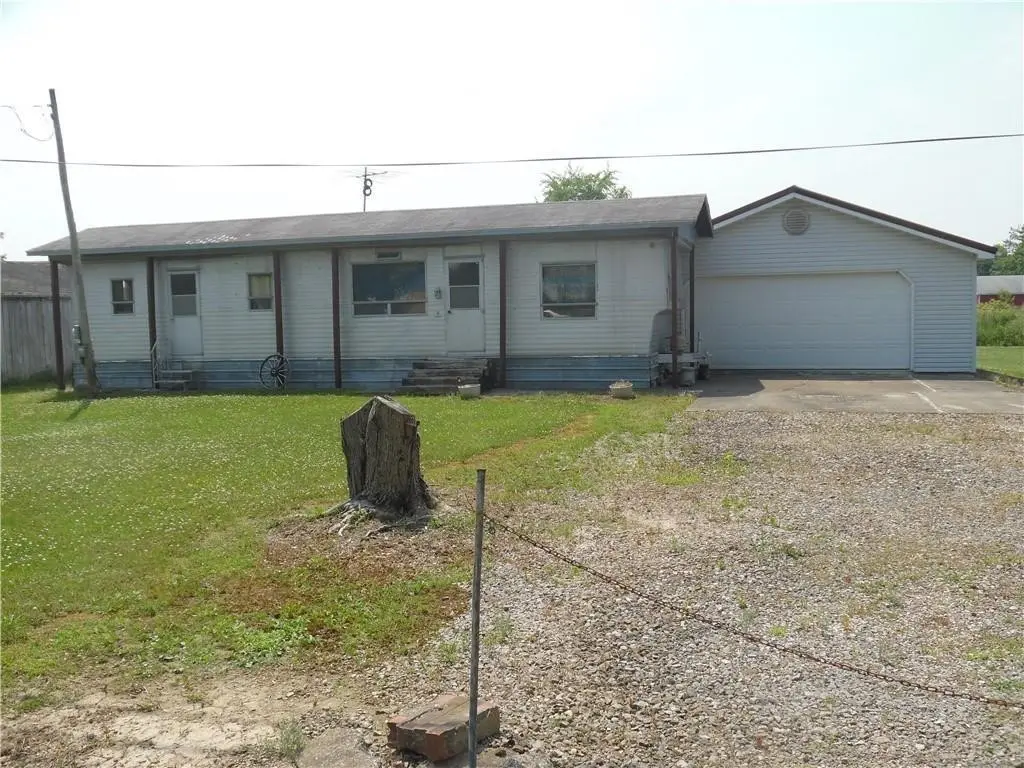
9729 Third (lot 5) St · Pymatuning Central, PA
Flood risk 1/10 · Minimal
- FEMA flood zone
- X (unshaded)
- Chance of flooding over 30 yrs
- 0.0%
- Est. flood insurance / yr
- $473 – $860
Fire risk 1/10 · Minimal
- Est. fire insurance / yr
- $511 – $949
Heat risk 2/10 · Minimal
- Hot days now (above 94°F)
- 7 days/yr
- Hot days in 30 yrs
- 17 days/yr
Wind risk 1/10 · Minimal
- Chance of severe wind over 30 yrs
- —
Air-quality risk 2/10 · Minimal
- Unhealthy air days now
- 1 days/yr
- Unhealthy air days in 30 yrs
- 3 days/yr
Risk factors via First Street. Map © Google.
Why this score? — see what drove the A- grade
The composite is a weighted blend of 9 inputs, each scored 0–100. Each bar is that input's sub-score; the figure is the points it added to the 100-point composite (weight × sub-score).
- Cash flow +30.0/30.0
- ARV discount +15.0/15.0
- 1% rule +10.0/10.0
- DSCR +10.0/10.0
- Appreciation +9.2/10.0
- Schools +4.0/10.0
- Livability +3.2/5.0
- Rent growth +2.5/5.0
- Condition / age +1.0/5.0
$51,500
🖨 Deal sheet 📄 Offer letter ✓ Due diligence
Listing remarks MLS
There is no association associated with this property. The owner owns the lota nd is only billed for the taxes on the property. There is no association fee involved.
Key facts
- 1 acre lot
- Garage
- Built 1968
Neighborhood map
What this means for you Summary
Snapshot
- This is a 2-bed/1.0-bath single-family listed at $52k. Condition is rated poor.
Deal economics
- At list price, monthly cash flow is $790 ($9k/yr) — positive.
- The deal already cash-flows at list — no discount required.
- Meets the 1% rule at list price ($1k rent vs $52k).
- Recommended offer: $45k (12.0% below list) — sets the bar for market timing.
Location & tenants
- Location reads 64/100 on livability (#1,181 in PA) — a middle-class / working-renter tenant base. Strengths: crime A+, cost of living A+, housing A+; Watch: employment D+, health & safety D, schools F.
- Conneaut SD (rural): math 38% / reading 57% proficiency, ranked #241 of 539 in PA (top 45%) — families likely to look elsewhere, expect single-tenant / working-renter base with shorter leases.
- Market conditions: 53 active listings in the ZIP; 1 comparable units currently listed for rent nearby; 83 units permitted in Crawford County in 2024 (0 in 5+ unit buildings).
Forward outlook
- In year one you build about $5k of equity ($356 loan paydown + $4k appreciation (8.5% local appreciation)).
- Crawford County population projected at -22% by 2050 — secular population decline; favor cash flow + early exit over multi-decade hold.
- At projected returns (8.5% appreciation + 3.0% rent growth), your $14k cash investment doubles in ~2 years — after that, you're playing with house money.
- By year 7, paydown + projected appreciation supports a ~$33k cash-out refi (75% LTV) — recoverable capital for the next deal without selling this one.
Negotiation context
- It's been on market 269 days — a 12% lower offer ($45k) is reasonable based on typical stale-listing flexibility.
- 4 sale attempts since 3y ago; this cycle's ask has dropped $3k (6%) from the opening price — seller is motivated, your offer sets the floor, not the list.
Questions for the listing agent
- It's been on market 269 days. Have you received any prior offers? Is the seller open to a 12% concession, seller financing, or rate buy-down credit?
- Have any recent inspections been done? Can we get a copy of the seller's disclosures and any deferred-maintenance estimates?
- Built in 1968 — when were the roof, HVAC, electrical panel, plumbing, and water heater last replaced?
- Why hasn't it sold? Are there any deal-killer items the seller is aware of (foundation, flood, title, zoning, code violations)?
- Is there a deadline driving the sale (1031 exchange, divorce, estate, relocation)? That informs how much negotiation room exists.
- Schools are F-rated, which usually means shorter tenancies and higher turnover. Who's the typical renter profile here, and what's been the actual vacancy rate?
- What's the average days-on-market for RENTAL listings here right now (not sales)? A rising rental-DOM trend means longer vacancies and softer asking-rent achievability than the comps imply.
- What's the recent tenant-quality profile in this submarket — average credit score on applications, eviction rate, late-payment / NSF rate, and stable-employment percentage? A property-management company in the area should have these aggregated.
- How much new for-sale + rental construction is in the pipeline within 1–3 miles? Heavy new supply typically softens prices + rents 12–24 months out; constrained supply supports both.
Investment metrics
- 1% rule
- 2.82% ✓
- Cap rate
- 24.69%
- Cash-on-cash
- 65.71%
- DSCR
- 3.92
- GRM
- 3.0
CMA / ARV
- ARV (median comp)
- $91,765
- List price
- $51,500
- Delta
- -43.88%
- Verdict
- UNDERPRICED
- Comps
- 12 within 1.0 mi
Projected returns pro-forma
8.48% appreciation · 3.0% rent growth · sell at horizon
- IRR
- 75.7%
- Equity multiple
- 6.07×
- Total profit
- $73,134
- Equity at exit
- $40,836
- IRR
- 70.9%
- Equity multiple
- 13.13×
- Total profit
- $174,985
- Equity at exit
- $82,747
Cash invested: $14,420 (down + closing). Projections, not guarantees.
Landlord ↔ Tenant lean methodology
- Overall (STATE)
- 62 Landlord-Friendly
- State Pennsylvania
- 62 Landlord-Friendly · EVEN
- County
- — inherits STATE
- City
- — inherits STATE
ZIP-level market 16424
- Home prices YoY
- 3.2%
- Active inventory
- 53
- Price-to-rent
- 3.0×
Monthly cashflow live
- Estimated rent
- $1,450 medium interval (Pro) →
- Mortgage (P&I)
- −$270
- Tax est. 1.5%
- −$64 /mo · $772/yr
- Insurance
- −$21
- HOA
- −$0
- Vacancy / Maint / Mgmt
- −$304
- Net cashflow
- $790
Break-even live
UW: 25.0% down · 7.5% · 30yr · 1.5% tax · 5.0% vac · 8.0% maint · 8.0% mgmt
Financing live
Cash to close
- Down payment
- $12,875
- Closing costs
- $1,545
- Reserves months
- —
- Total cash needed
- —
Loan-product check · same deal, 3 products live
Conventional
25% down · 7.5% · 30yr
- Down + closing
- —
- Monthly P&I
- —
- Monthly cashflow
- —
- DSCR
- —
- Eligible?
- —
Personal DTI + credit; lowest rate.
DSCR
20% down · 8.5% · 30yr
- Down + closing
- —
- Monthly P&I
- —
- Monthly cashflow
- —
- DSCR
- —
- Eligible?
- —
No personal income docs; deal must DSCR.
Hard money
10% down · 12.0% · 12mo
- Down + closing
- —
- Monthly P&I
- —
- Monthly cashflow
- —
- DSCR
- —
- Eligible?
- —
Short-term bridge; refi at stabilization.
Rent comps 1 comps
| Address | Beds | Baths | Sqft | Rent | $/sqft | DOM | Units | Dist |
|---|---|---|---|---|---|---|---|---|
| 8900 S Lake Rd Unit AirBNB Linesville, PA | 2.0 | 1.0 | 912 | $1,450 | $1.59 | 43d | 1 | 1.31mi |
Listing history 25 events
-
2026-06-19days on market $51,500 Active 269 DOM
-
2026-06-18days on market $51,500 Active 268 DOM
-
2026-06-17days on market $51,500 Active 267 DOM
-
2026-06-16days on market $51,500 Active 266 DOM
-
2026-06-15days on market $51,500 Active 265 DOM
-
2026-06-14days on market $51,500 Active 263 DOM
-
2026-06-12days on market $51,500 Active 262 DOM
-
2026-06-09days on market $51,500 Active 259 DOM
-
2026-06-08days on market $51,500 Active 258 DOM
-
2026-06-07days on market $51,500 Active 257 DOM
-
2026-06-07pricedays on market $51,500 Active 256 DOM
-
2026-06-03days on market $54,900 Active 253 DOM
-
2026-06-02days on market $54,900 Active 252 DOM
-
2026-06-01days on market $54,900 Active 251 DOM
-
2026-05-31days on market $54,900 Active 250 DOM
-
2026-05-30days on market $54,900 Active 249 DOM
-
2025-09-23$54,900 Active 165-char remark
Show marketing remark (165 chars)
There is no association associated with this property. The owner owns the lota nd is only billed for the taxes on the property. There is no association fee involved.
-
2025-07-01price $54,900
-
2025-01-21price $56,900
-
2025-01-15price $46,900
-
2025-01-13price $39,999
-
2024-04-29$56,900 Active
-
2023-08-31status Active
-
2023-08-17historical
-
2023-06-19$58,900 Active
ⓘ Source: listings_history table (triggers on properties + properties_extension) + one-shot
backfill from property_details.listing_events for pre-trigger history.
Climate risk First Street
- Flood 1/10 Low FEMA zone X (unshaded) · 0% chance over 30 yrs
- Wildfire 1/10 Low
- Heat 2/10 Low 7 d/yr ≥94°F today · 17 d/yr by 30 yrs out
- Wind 1/10 Low
- Air quality 2/10 Low 1 unhealthy d/yr today · 3 by 30 yrs out
Nearby sold comps map
Loading sold comps map…
Walkable amenities ~0.75 mi
Loading nearby amenities…
Taxation est. · year 1
- Rental income
- $17,400
- − Mortgage interest
- −$2,885
- − Property taxes
- −$772
- − Insurance
- −$258
- − Repairs & maintenance
- −$1,392
- − Management
- −$1,392
- − Depreciation
- −$1,498
- Taxable income
- $9,203
- Est. tax owed @ 24.0%
- −$2,209
- After-tax cash flow
- $7,266/yr
For passive investors: Depreciation is non-cash, so a rental often shows a tax loss while cash-flowing — sheltering income. Rental losses are passive: they offset passive income freely, and up to $25,000/yr can offset ordinary (W-2) income if you actively participate and your MAGI is under $100k (phasing out to $0 by $150k); unused losses carry forward. On sale, claimed depreciation is recaptured at up to 25%, and gains may owe capital-gains tax (a 1031 exchange can defer both). Figures are a year-1 estimate at your 24.0% rate — not tax advice; consult a CPA.
Condition & rehab AI · 6 photos
This home requires extensive renovations to bring it up to modern standards. The kitchen, bathrooms, exterior, and interior walls all need significant work. Improvements in these areas will significantly increase its resale and rental value.
Repairs flagged
- Major kitchen cabinets — severely dated and worn
- Major kitchen countertops — worn and outdated
- Major kitchen appliances — outdated and likely non-functional
- Major bathroom fixtures — small and outdated, likely non-functional
- Major exterior siding — weathered and in need of repainting
- Major interior walls — dated wood paneling and peeling paint
- Major windows — blinds, curtains, and window frames appear old
- Major landscaping — overgrown lawn and gravel driveway
Value-add opportunities
- Both modern kitchen — modern kitchen with updated appliances and fixtures
- Both new exterior siding — new siding will improve curb appeal and increase value
- Both updated interior walls — updated walls will improve the overall look and feel of the home
- Both new windows — new windows will improve natural light and increase the home's value
- Both landscaping — improved landscaping will increase curb appeal and attract potential buyers
Renovation cost estimate screening
| Repair item | Severity | Est. cost |
|---|---|---|
| kitchen cabinets · severely dated and worn | Major | $15,000–50,000 |
| kitchen countertops · worn and outdated | Major | $15,000–50,000 |
| kitchen appliances · outdated and likely non-functional | Major | $15,000–50,000 |
| bathroom fixtures · small and outdated, likely non-functional | Major | $15,000–50,000 |
| exterior siding · weathered and in need of repainting | Major | $15,000–50,000 |
| interior walls · dated wood paneling and peeling paint | Major | $15,000–50,000 |
| windows · blinds, curtains, and window frames appear old | Major | $15,000–50,000 |
| landscaping · overgrown lawn and gravel driveway | Major | $15,000–50,000 |
| Total estimated repair cost · 8 items | $120,000–400,000 |
Value-add ROI direction
- Both modern kitchen — modern kitchen with updated appliances and fixtures ↑
- Both new exterior siding — new siding will improve curb appeal and increase value ↑
- Both updated interior walls — updated walls will improve the overall look and feel of the home ↑
- Both new windows — new windows will improve natural light and increase the home's value ↑
- Both landscaping — improved landscaping will increase curb appeal and attract potential buyers ↑
ⓘ Cost ranges are severity-bucket heuristics (US national rule-of-thumb). Get contractor quotes + a written scope before underwriting a rehab budget.
Schools (NCES district)
- District
- Conneaut SD
- NCES district ID
- 4206590
- Math proficiency
- 38% ▼ -7.00%
- Reading proficiency
- 57% ▼ -7.00%
- Median HH income
- $43,946
- Composite
- 40.06/100
- National rank
- #3813
- State rank
- #241 of 539 in PA
Livability — Pymatuning Central
- Score
- 64/100
- State rank
- #1181
- US rank
- #13811
Category grades
Schools grade is shown separately in the Schools card above.
Census & demographics
- Census place
- Pymatuning Central, PA
- Population (ZIP)
- 4,328
Population outlook (Crawford County) Hauer SSP2
- Today (2025)
- 81,399 people
- By 2030
- 77,977 · -4.2%
- By 2040
- 70,659 · -13.2%
- By 2050
- 63,841 · -21.6%
- By 2075
- 50,198 · -38.3%
- By 2100
- 37,898 · -53.4%
Race, ethnicity, and origin ACS 2023
- Neighborhood character
- Predominantly White (95%)
- Race & ethnicity
- White 95% Two or more races 4% Hispanic / Latino 2%
- Common ancestry
- Romanian 4% Lithuanian 2% Slovak 2%
- Foreign-born
- 1% · Canada
- Languages at home
- 96% English-only · German/W. Germanic 3% Spanish 1%
Political lean MEDSL · Crawford
- 2024 margin
- Solid R (+39.2) · D 30.0% · R 69.2%
- 2008→2024 swing
- -28.8pp toward R · 2008: -10.4pp · 2024: -39.2pp
- All cycles
- 2024: R+39.2 2020: R+37.2 2016: R+38.5 2012: R+19.6 2008: R+10.4
Not yet ingested
- Civics
- —
Market trends
- HPI YoY
- ▲ 8.48%
- Current HPI
- 276.8388
- Rent YoY
- —
- Metro
- —
- State GDP YoY
- ▲ 1.68%
- F500 in state
- 34
Industry mix (Fortune 500 HQ in PA)
| Industry | F500 HQs | Revenue |
|---|---|---|
| Healthcare | 2 | $309B |
|
||
| Insurance | 2 | $27B |
|
||
| Telecommunications / Media | 1 | $124B |
|
||
| Industrial Distribution | 1 | $22B |
|
||
| Financial Services | 1 | $20B |
|
||
| Chemicals / Materials | 1 | $18B |
|
||
Price history
-6.8% since first listed9 events — show timeline
- 2025-09-23 Listed $54,900 GEBOR
- 2025-07-01 Price Changed $54,900 GEBOR
- 2025-01-21 Price Changed $56,900 GEBOR
- 2025-01-15 Price Changed $46,900 GEBOR
- 2025-01-13 Price Changed $39,999 GEBOR
- 2024-04-29 Listed $56,900 GEBOR
- 2023-08-31 Relisted — GEBOR
- 2023-08-17 Delisted — GEBOR
- 2023-06-19 Listed $58,900 GEBOR
Cash-flow waterfall
monthlySold comps — $/sqft
last 12 mo · ≤1 miLoading sold comps…