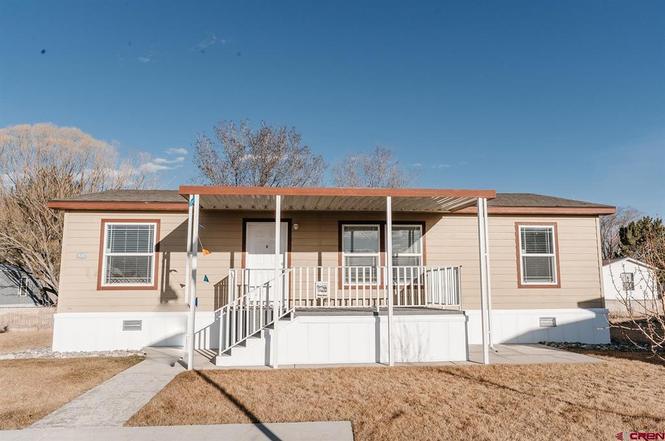
62650 Lasalle Rd #820 · Montrose, CO
Flood risk 1/10 · Minimal
- FEMA flood zone
- AE
- Chance of flooding over 30 yrs
- 0.0%
- Est. flood insurance / yr
- $1,737 – $8,500
Fire risk 2/10 · Minimal
- Est. fire insurance / yr
- $939 – $1,743
Heat risk 4/10 · Minor
- Hot days now (above 91°F)
- 7 days/yr
- Hot days in 30 yrs
- 17 days/yr
Wind risk 1/10 · Minimal
- Chance of severe wind over 30 yrs
- —
Air-quality risk 1/10 · Minimal
- Unhealthy air days now
- 0 days/yr
- Unhealthy air days in 30 yrs
- 0 days/yr
Risk factors via First Street. Map © Google.
Why this score? — see what drove the C+ grade
The composite is a weighted blend of 9 inputs, each scored 0–100. Each bar is that input's sub-score; the figure is the points it added to the 100-point composite (weight × sub-score).
- Cash flow +28.6/30.0
- DSCR +10.0/10.0
- ARV discount +7.5/15.0
- 1% rule +6.8/10.0
- Livability +3.4/5.0
- Rent growth +2.5/5.0
- Schools +2.5/10.0
- Condition / age +2.5/5.0
- Appreciation +0.0/10.0
$161,000
🖨 Deal sheet 📄 Offer letter ✓ Due diligence
Listing remarks
Modern New 3 bedroom, 2 bath manufactured home in Hidden Lake Community for the perfect Lock and Leave scenario. Features 1188 square foot of beautiful living space. Enjoy the benefits of having your own comfortable home in a community that offers a wide range of amenities that include dog park, a playground, pickleball and basketball court, as well as a private fully stocked lake for some catch and release fun. Also, the Seller is offering Owner Financing for qualified buyers.
Key facts
- Dog park
- Pickleball court
- Basketball court
Tags
Property features AI
Finance
- HOA & community: Part of Hidden Lake homeowners association; Community playground; Community park; Community storage facilities
Exterior
- Parking: RV access/parking
- Utilities: Electricity available; Natural gas available; High speed internet available; Cellular phone reception; Public water; Public sewer
- Home design: Single-story; Double wide mobile home; New construction; Has view; Waterfront with pond; Residential single-family use; Skirted foundation
- Construction: Composition roof; Modular/prefab construction; Masonite siding; Built as new construction
- Exterior features: Covered porch
Interior
- Kitchen: Dishwasher; Microwave; Oven; Range; Refrigerator
- Flooring: Laminate
- Bathrooms: 1 full bathroom; 1 three-quarter bathroom
- Heating & cooling: Central air conditioning; Forced air heating; Natural gas heating
- Interior features: Unfurnished; Separate/formal dining room
- Laundry & utility: Washer hookup
Neighborhood map
What this means for you Summary
Snapshot
- This is a 3-bed/2.0-bath manufactured listed at $161k.
Deal economics
- At list price, monthly cash flow is $104 ($1k/yr) — positive.
- The deal already cash-flows at list — no discount required.
- Meets the 1% rule at list price ($2k rent vs $161k).
- Recommended offer: $142k (12.0% below list) — sets the bar for market timing.
- Cap rate 10.2% vs local median 2.0% in Montrose — top-decile yield for the area; either an underpriced asset or a hidden risk that comps aren't pricing in. Stress-test before assuming the spread holds.
Location & tenants
- Location reads 68/100 on livability (#109 in CO) — a middle-class / working-renter tenant base. Strengths: housing A+; Watch: amenities C-, schools D+, employment D+.
- Montrose County School District Re-1J (town): math 22% / reading 36% proficiency, ranked #55 of 86 in CO (top 64%) — low school quality limits family demand, transient renter base, plan for 1-2y turnover.
- Market conditions: 371 active listings in the ZIP; 271 units permitted in Montrose County in 2024 (22 in 5+ unit buildings).
- This rent runs 32% of the median local income ($71k/yr) — at the standard rent-burdened threshold; future hikes will face affordability resistance.
Forward outlook
- Local home prices are declining (-3.0%/yr); year-one equity from $1k of loan paydown is wiped out by about $5k of value loss. Plan a longer hold.
- Montrose County population projected at -25% by 2050 — secular population decline; favor cash flow + early exit over multi-decade hold.
Negotiation context
- It's been on market 213 days — a 12% lower offer ($142k) is reasonable based on typical stale-listing flexibility.
- 2 sale attempts with the ask held roughly flat each time — persistent listings suggest the price (not the market) is what's stuck; bring a comps-based counter.
Risks & watch-outs
- Watch-outs: flood insurance adds $427/mo.
- Climate carrying-cost: in FEMA flood zone AE (mandatory federal flood insurance) — expect insurance premiums to compound above CPI over the hold.
Questions for the listing agent
- It's been on market 213 days. Have you received any prior offers? Is the seller open to a 12% concession, seller financing, or rate buy-down credit?
- What's the actual annual flood-insurance premium (NFIP or private), and is the property in a SFHA with mandatory coverage?
- Why hasn't it sold? Are there any deal-killer items the seller is aware of (foundation, flood, title, zoning, code violations)?
- Is there a deadline driving the sale (1031 exchange, divorce, estate, relocation)? That informs how much negotiation room exists.
- Schools are D-rated, which usually means shorter tenancies and higher turnover. Who's the typical renter profile here, and what's been the actual vacancy rate?
- What's the average days-on-market for RENTAL listings here right now (not sales)? A rising rental-DOM trend means longer vacancies and softer asking-rent achievability than the comps imply.
- What's the recent tenant-quality profile in this submarket — average credit score on applications, eviction rate, late-payment / NSF rate, and stable-employment percentage? A property-management company in the area should have these aggregated.
- How much new for-sale + rental construction is in the pipeline within 1–3 miles? Heavy new supply typically softens prices + rents 12–24 months out; constrained supply supports both.
Investment metrics
- 1% rule
- 1.18% ✓
- Cap rate
- 10.25%
- Cash-on-cash
- 14.13%
- DSCR
- 1.63
- GRM
- 7.1
CMA / ARV
- ARV (on-the-fly)
- $95,040
- Comps found
- 12
Show comp detail 12 sales within ~0.75 mi
| Address | Dist | Beds/Ba | Sqft | Sold | Price | $/sf | Match |
|---|---|---|---|---|---|---|---|
| 62650 Lasalle Rd #805 | 0.00mi | 3/2.0 | 1,155 (-3%) | 5mo | $120,000 | $104 | 91 |
| 62650 Lasalle Rd #331 | 0.00mi | 3/2.0 | 1,140 (-4%) | 10mo | $111,500 | $98 | 85 |
| 62650 Lasalle Rd #337 | 0.00mi | 3/2.0 | 1,140 (-4%) | 12mo | $125,000 | $110 | 83 |
| 62650 Lasalle Rd #807 | 0.00mi | 3/2.0 | 1,140 (-4%) | 13mo | $105,000 | $92 | 83 |
| 62880 Lasalle Rd #139 | 0.29mi | 3/2.0 | 1,216 (+2%) | 6mo | $64,000 | $53 | 78 |
| 62880 Lasalle Rd Rd Unit 131 | 0.29mi | 3/2.0 | 1,248 (+5%) | 10mo | $100,000 | $80 | 70 |
| 62880 Lasalle Rd #100 | 0.29mi | 3/2.0 | 1,216 (+2%) | 20mo | $75,450 | $62 | 66 |
| 62880 Lasalle Rd #147 | 0.29mi | 2/2.0 (-1) | 1,152 (-3%) | 13mo | $85,000 | $74 | 66 |
| 62880 Lasalle Rd #113 | 0.29mi | 3/2.0 | 1,120 (-6%) | 18mo | $95,000 | $85 | 62 |
| 62880 Lasalle Rd #71 | 0.29mi | 3/2.0 | 1,280 (+8%) | 17mo | $60,000 | $47 | 60 |
| 62880 Lasalle Rd #117 | 0.29mi | 3/2.0 | 1,120 (-6%) | 23mo | $79,000 | $71 | 58 |
| 62880 Lasalle Rd #184 | 0.29mi | 3/2.0 | 1,024 (-14%) | 21mo | $76,000 | $74 | 46 |
Match score weights: distance 35% · size 25% · config 20% · recency 20%. Top-matched comps best support the ARV.
Projected returns pro-forma
-3.0% appreciation · 3.0% rent growth · sell at horizon
- IRR
- -11.8%
- Equity multiple
- 0.57×
- Total profit
- $-19,254
- Equity at exit
- $24,006
- IRR
- -2.4%
- Equity multiple
- 0.84×
- Total profit
- $-7,406
- Equity at exit
- $13,920
Cash invested: $45,080 (down + closing). Projections, not guarantees.
Landlord ↔ Tenant lean methodology
- Overall (STATE)
- 38 Tenant-Leaning
- State Colorado
- 38 Tenant-Leaning · D+4
- County
- — inherits STATE
- City
- — inherits STATE
ZIP-level market 81401
- Active inventory
- 371
- Price-to-rent
- 7.1×
Monthly cashflow live
- Estimated rent
- $1,896 medium interval (Pro) →
- Mortgage (P&I)
- −$844
- Tax from tax record
- −$56 /mo · $667/yr
- Insurance
- −$67
- Flood insurance flood zone
- −$427 /mo · $5,118/yr
- HOA
- −$0
- Vacancy / Maint / Mgmt
- −$398
- Net cashflow
- $104
Break-even live
UW: 25.0% down · 7.5% · 30yr · 1.5% tax · 5.0% vac · 8.0% maint · 8.0% mgmt
Financing live
Cash to close
- Down payment
- $40,250
- Closing costs
- $4,830
- Reserves months
- —
- Total cash needed
- —
Loan-product check · same deal, 3 products live
Conventional
25% down · 7.5% · 30yr
- Down + closing
- —
- Monthly P&I
- —
- Monthly cashflow
- —
- DSCR
- —
- Eligible?
- —
Personal DTI + credit; lowest rate.
DSCR
20% down · 8.5% · 30yr
- Down + closing
- —
- Monthly P&I
- —
- Monthly cashflow
- —
- DSCR
- —
- Eligible?
- —
No personal income docs; deal must DSCR.
Hard money
10% down · 12.0% · 12mo
- Down + closing
- —
- Monthly P&I
- —
- Monthly cashflow
- —
- DSCR
- —
- Eligible?
- —
Short-term bridge; refi at stabilization.
Listing history 18 events
-
2026-06-19days on market $161,000 Active 213 DOM
-
2026-06-18days on market $161,000 Active 212 DOM
-
2026-06-17days on market $161,000 Active 211 DOM
-
2026-06-16days on market $161,000 Active 210 DOM
-
2026-06-15days on market $161,000 Active 209 DOM
-
2026-06-14days on market $161,000 Active 207 DOM
-
2026-06-12days on market $161,000 Active 206 DOM
-
2026-06-09days on market $161,000 Active 203 DOM
-
2026-06-08days on market $161,000 Active 202 DOM
-
2026-06-07days on market $161,000 Active 201 DOM
-
2026-06-02days on market $161,000 Active 196 DOM
-
2026-06-01days on market $161,000 Active 195 DOM
-
2026-05-31days on market $161,000 Active 194 DOM
-
2026-05-30days on market $161,000 Active 193 DOM
-
2025-11-18$161,000 Active
-
2025-11-10historical
-
2025-07-11price $164,000
-
2025-03-13$174,000 Active
ⓘ Source: listings_history table (triggers on properties + properties_extension) + one-shot
backfill from property_details.listing_events for pre-trigger history.
Tax reassessment forecast CO · Resets to sale price
- Current annual tax
- $667 · $56/mo
- Projected year-2 tax
- $886 · $74/mo
- Expected delta
- +$219/yr (+$18/mo · 32.8%)
ⓘ Screening estimate from a state-policy table — verify with the county assessor before closing.
Climate risk First Street
- Flood 1/10 Low FEMA zone AE · 0% chance over 30 yrs
- Wildfire 2/10 Low
- Heat 4/10 Moderate 7 d/yr ≥91°F today · 17 d/yr by 30 yrs out
- Wind 1/10 Low
- Air quality 1/10 Low 0 unhealthy d/yr today · 0 by 30 yrs out
Nearby sold comps map
Loading sold comps map…
Walkable amenities ~0.75 mi
Loading nearby amenities…
Taxation est. · year 1
- Rental income
- $22,749
- − Mortgage interest
- −$9,019
- − Property taxes
- −$667
- − Insurance
- −$5,924
- − Repairs & maintenance
- −$1,820
- − Management
- −$1,820
- − Depreciation
- −$4,684
- Taxable loss
- −$1,183
- Est. tax savings @ 24.0%
- +$284
- After-tax cash flow
- $1,534/yr
For passive investors: Depreciation is non-cash, so a rental often shows a tax loss while cash-flowing — sheltering income. Rental losses are passive: they offset passive income freely, and up to $25,000/yr can offset ordinary (W-2) income if you actively participate and your MAGI is under $100k (phasing out to $0 by $150k); unused losses carry forward. On sale, claimed depreciation is recaptured at up to 25%, and gains may owe capital-gains tax (a 1031 exchange can defer both). Figures are a year-1 estimate at your 24.0% rate — not tax advice; consult a CPA.
Schools (NCES district)
- District
- Montrose County School District Re-1J
- NCES district ID
- 0805790
- Math proficiency
- 22% ▼ -5.00%
- Reading proficiency
- 36% ▼ -7.00%
- Median HH income
- $45,650
- Composite
- 24.9/100
- National rank
- #7577
- State rank
- #55 of 86 in CO
Livability — Montrose
- Score
- 68/100
- State rank
- #109
- US rank
- #9310
Category grades
Schools grade is shown separately in the Schools card above.
Census & demographics
- County
- Montrose County · 24,228 people
- City population
- 24,228
- Metro
- Montrose, CO
- Population (ZIP)
- 24,228
- Household income
- $71,286
- Rent vs Own
- Severe rent burden
- 682.0
Population outlook (Montrose County) Hauer SSP2
- Today (2025)
- 39,229 people
- By 2030
- 37,791 · -3.7%
- By 2040
- 33,829 · -13.8%
- By 2050
- 29,530 · -24.7%
- By 2075
- 20,559 · -47.6%
- By 2100
- 12,144 · -69.0%
Race, ethnicity, and origin ACS 2023
- Neighborhood character
- Predominantly White (74%)
- Race & ethnicity
- White 74% Hispanic / Latino 20% Two or more races 13% Native American 1%
- Hispanic origin (detail)
- Mexican 16%
- Common ancestry
- Slovak 4% Romanian 3% Lithuanian 2%
- Foreign-born
- 6% · Canada
- Languages at home
- 86% English-only · Spanish 11% Other Indo-European 1%
Political lean MEDSL · Montrose
- 2024 margin
- Solid R (+32.6) · D 32.6% · R 65.2% · Other 2.2%
- 2008→2024 swing
- -2.8pp toward R · 2008: -29.8pp · 2024: -32.6pp
- All cycles
- 2024: R+32.6 2020: R+36.5 2016: R+42.1 2012: R+36.4 2008: R+29.8
Not yet ingested
- Civics
- —
Market trends
- HPI YoY
- ▼ -210.94%
- Current HPI
- 373.4909
- Rent YoY
- —
- Metro
- Montrose, CO
- State GDP YoY
- ▲ 1.95%
- F500 in state
- 14
Industry mix (Fortune 500 HQ in CO)
| Industry | F500 HQs | Revenue |
|---|---|---|
| Technology Distribution | 1 | $31B |
|
||
| Food / Agriculture | 1 | $18B |
|
||
| Packaging | 1 | $14B |
|
||
| Healthcare | 1 | $13B |
|
||
| Energy | 1 | $10B |
|
||
| Technology | 1 | $4B |
|
||
Price history
-7.5% since first listed4 events — show timeline
- 2025-11-18 Listed $161,000 cren
- 2025-11-10 Listing Removed — cren
- 2025-07-11 Price Changed $164,000 cren
- 2025-03-13 Listed $174,000 cren
Property tax history
+58.3%/yrLatest (2025): $667 · +139.8% YoY. Source: county tax records.
Cash-flow waterfall
monthlySold comps — $/sqft
last 12 mo · ≤1 miLoading sold comps…