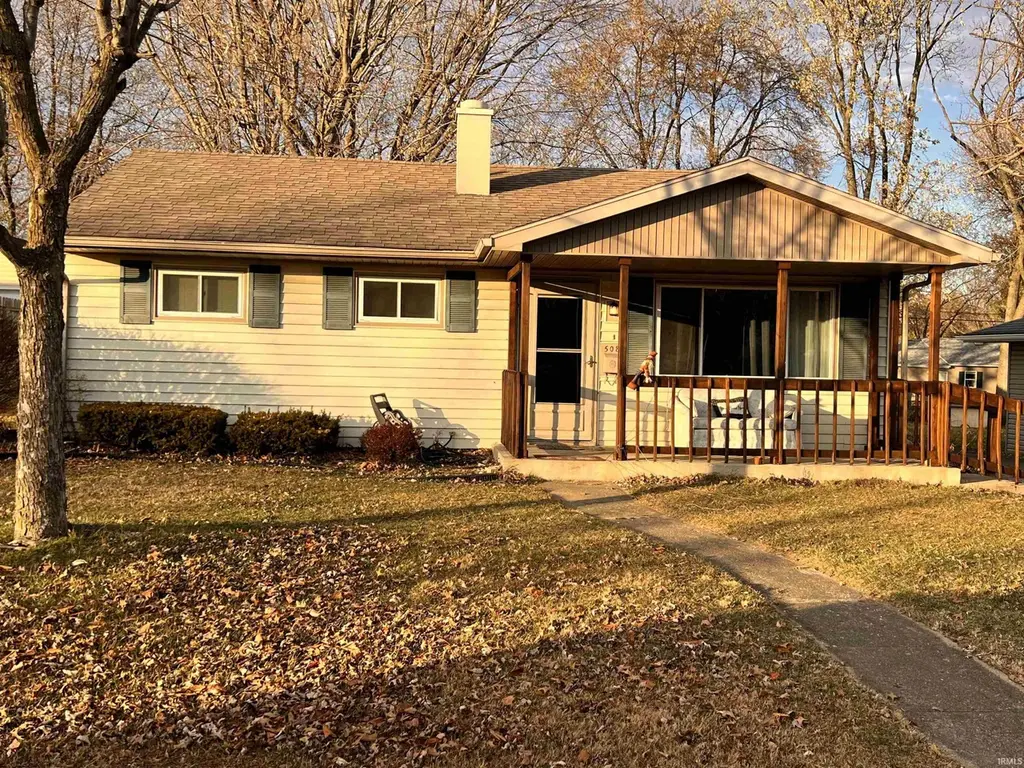
508 W Wharton Dr · Marion, IN
Flood risk 1/10 · Minimal
- FEMA flood zone
- X (unshaded)
- Chance of flooding over 30 yrs
- 0.0%
- Est. flood insurance / yr
- $507 – $1,088
Fire risk 1/10 · Minimal
- Est. fire insurance / yr
- $717 – $1,331
Heat risk 3/10 · Minor
- Hot days now (above 101°F)
- 7 days/yr
- Hot days in 30 yrs
- 18 days/yr
Wind risk 2/10 · Minimal
- Chance of severe wind over 30 yrs
- —
Air-quality risk 2/10 · Minimal
- Unhealthy air days now
- 1 days/yr
- Unhealthy air days in 30 yrs
- 3 days/yr
Risk factors via First Street. Map © Google.
Why this score? — see what drove the C- grade
The composite is a weighted blend of 9 inputs, each scored 0–100. Each bar is that input's sub-score; the figure is the points it added to the 100-point composite (weight × sub-score).
- Cash flow +20.3/30.0
- ARV discount +11.7/15.0
- DSCR +6.4/10.0
- 1% rule +4.4/10.0
- Livability +3.2/5.0
- Rent growth +2.5/5.0
- Condition / age +2.5/5.0
- Schools +1.7/10.0
- Appreciation +0.0/10.0
$110,000
🖨 Deal sheet 📄 Offer letter ✓ Due diligence
Listing remarks MLS
Move in ready! Welcome to this cozy 3 bed, 1 bath home located within walking distance to the Riverwalk. Home is also located close to all amenities & Marion General Hospital. This home has a covered front porch, and a 3-season room on the back for dining and entertaining while overlooking the fenced back yard. Property also includes a 1 car detached garage. This home is ready for a new owner and new memories!!
Key facts
- Covered front porch
- Fenced back yard
- Close to amenities
Tags
Neighborhood map
What this means for you Summary
Snapshot
- This is a 3-bed/1.0-bath single-family listed at $110k.
Deal economics
- At list price, monthly cash flow is $141 ($2k/yr) — positive.
- The deal already cash-flows at list — no discount required.
- To meet the 1% rule (rent ≥ 1% of price), the offer needs to be $103k (6.5% below list).
- Recommended offer: $97k (12.0% below list) — sets the bar for market timing.
Location & tenants
- Location reads 65/100 on livability (#337 in IN) — a middle-class / working-renter tenant base. Strengths: crime A+, cost of living A+, housing A+; Watch: schools F, amenities F, commute F.
- Marion Community Schools (town): math 18% / reading 24% proficiency, ranked #277 of 301 in IN (top 92%) — low school quality limits family demand, transient renter base, plan for 1-2y turnover; 67% free/reduced lunch — lower-income household profile, screen leases tightly.
- Market conditions: 124 active listings in the ZIP; 2 comparable units currently listed for rent nearby; 52 units permitted in Grant County in 2024 (8 in 5+ unit buildings).
Forward outlook
- Local home prices are declining (-3.0%/yr); year-one equity from $761 of loan paydown is wiped out by about $3k of value loss. Plan a longer hold.
- Grant County population projected at -18% by 2050 — secular population decline; favor cash flow + early exit over multi-decade hold.
Negotiation context
- It's been on market 211 days — a 12% lower offer ($97k) is reasonable based on typical stale-listing flexibility.
- 4 sale attempts since 10y ago with the ask held roughly flat each time — persistent listings suggest the price (not the market) is what's stuck; bring a comps-based counter.
- Current owner paid $75k; 47% above their basis — modest negotiation headroom, anchor on the comps not their cost.
Risks & watch-outs
- Watch-outs: built in 1954 — expect roof / HVAC / electrical / plumbing capex.
Questions for the listing agent
- It's been on market 211 days. Have you received any prior offers? Is the seller open to a 12% concession, seller financing, or rate buy-down credit?
- Built in 1954 — when were the roof, HVAC, electrical panel, plumbing, and water heater last replaced?
- Why hasn't it sold? Are there any deal-killer items the seller is aware of (foundation, flood, title, zoning, code violations)?
- Is there a deadline driving the sale (1031 exchange, divorce, estate, relocation)? That informs how much negotiation room exists.
- Schools are F-rated, which usually means shorter tenancies and higher turnover. Who's the typical renter profile here, and what's been the actual vacancy rate?
- What's the average days-on-market for RENTAL listings here right now (not sales)? A rising rental-DOM trend means longer vacancies and softer asking-rent achievability than the comps imply.
- What's the recent tenant-quality profile in this submarket — average credit score on applications, eviction rate, late-payment / NSF rate, and stable-employment percentage? A property-management company in the area should have these aggregated.
- How much new for-sale + rental construction is in the pipeline within 1–3 miles? Heavy new supply typically softens prices + rents 12–24 months out; constrained supply supports both.
Investment metrics
- 1% rule
- 0.94% ✗
- Cap rate
- 7.83%
- Cash-on-cash
- 5.49%
- DSCR
- 1.24
- GRM
- 8.9
CMA / ARV
- ARV (median comp)
- $121,407
- List price
- $110,000
- Delta
- -9.40%
- Verdict
- FAIR
- Comps
- 20 within 1.0 mi
Show comp detail 12 sales within ~0.75 mi
| Address | Dist | Beds/Ba | Sqft | Sold | Price | $/sf | Match |
|---|---|---|---|---|---|---|---|
| 716 W Wharton Dr | 0.14mi | 3/1.0 | 864 (+6%) | 8mo | $99,900 | $116 | 77 |
| 214 W Wharton Dr | 0.14mi | 2/1.0 (-1) | 864 (+6%) | 5mo | $130,000 | $150 | 75 |
| 616 W Wharton Dr | 0.10mi | 3/1.0 | 864 (+6%) | 14mo | $125,000 | $145 | 74 |
| 713 W Wharton Dr | 0.13mi | 3/1.0 | 864 (+6%) | 13mo | $139,900 | $162 | 73 |
| 1008 N Quarry Rd | 0.25mi | 2/1.0 (-1) | 768 (-6%) | 1mo | $116,500 | $152 | 73 |
| 1203 W National Ave | 0.58mi | 2/1.0 (-1) | 848 (+4%) | 2mo | $85,000 | $100 | 60 |
| 1005 N Oxford Dr | 0.54mi | 3/1.0 | 864 (+6%) | 6mo | $109,900 | $127 | 60 |
| 609 E Wiley St | 0.68mi | 3/1.0 | 864 (+6%) | 8mo | $94,000 | $109 | 52 |
| 1210 W National Ave | 0.58mi | 3/1.0 | 864 (+6%) | 14mo | $105,000 | $122 | 51 |
| 409 E Lincoln St | 0.67mi | 2/1.0 (-1) | 832 (+2%) | 14mo | $78,000 | $94 | 49 |
| 1126 N Meridian St | 0.48mi | 2/1.0 (-1) | 724 (-11%) | 9mo | $40,000 | $55 | 46 |
| 334 N Boots St | 0.73mi | 3/2.0 | 728 (-11%) | 14mo | $65,000 | $89 | 32 |
Match score weights: distance 35% · size 25% · config 20% · recency 20%. Top-matched comps best support the ARV.
Projected returns pro-forma
-3.0% appreciation · 3.0% rent growth · sell at horizon
- IRR
- -7.8%
- Equity multiple
- 0.71×
- Total profit
- $-8,893
- Equity at exit
- $16,401
- IRR
- 1.7%
- Equity multiple
- 1.12×
- Total profit
- $3,650
- Equity at exit
- $9,511
Cash invested: $30,800 (down + closing). Projections, not guarantees.
Landlord ↔ Tenant lean methodology
- Overall (STATE)
- 90 Strongly Landlord-Friendly
- State Indiana
- 90 Strongly Landlord-Friendly · R+11
- County
- — inherits STATE
- City
- — inherits STATE
ZIP-level market 46952
- Home prices YoY
- -29.9%
- Active inventory
- 124
- Price-to-rent
- 8.9×
Monthly cashflow live
- Estimated rent
- $1,029 medium interval (Pro) →
- Mortgage (P&I)
- −$577
- Tax from tax record
- −$49 /mo · $589/yr
- Insurance
- −$46
- HOA
- −$0
- Vacancy / Maint / Mgmt
- −$216
- Net cashflow
- $141
Break-even live
UW: 25.0% down · 7.5% · 30yr · 1.5% tax · 5.0% vac · 8.0% maint · 8.0% mgmt
Financing live
Cash to close
- Down payment
- $27,500
- Closing costs
- $3,300
- Reserves months
- —
- Total cash needed
- —
Loan-product check · same deal, 3 products live
Conventional
25% down · 7.5% · 30yr
- Down + closing
- —
- Monthly P&I
- —
- Monthly cashflow
- —
- DSCR
- —
- Eligible?
- —
Personal DTI + credit; lowest rate.
DSCR
20% down · 8.5% · 30yr
- Down + closing
- —
- Monthly P&I
- —
- Monthly cashflow
- —
- DSCR
- —
- Eligible?
- —
No personal income docs; deal must DSCR.
Hard money
10% down · 12.0% · 12mo
- Down + closing
- —
- Monthly P&I
- —
- Monthly cashflow
- —
- DSCR
- —
- Eligible?
- —
Short-term bridge; refi at stabilization.
Rent comps 2 comps
| Address | Beds | Baths | Sqft | Rent | $/sqft | DOM | Units | Dist |
|---|---|---|---|---|---|---|---|---|
| 715 E Sherman St Marion, IN | 2.0 | 1.0 | 1085 | $1,050 | $0.97 | 43d | 1 | 1.11mi |
| 2111 W Frederick Dr Marion, IN | 1.0–2.0 | 1.0–1.5 | 965 | $937 | $0.97 | 43d | 4 | 1.47mi |
Listing history 21 events
-
2026-06-19days on market $110,000 Active 211 DOM
-
2026-06-18days on market $110,000 Active 210 DOM
-
2026-06-17days on market $110,000 Active 209 DOM
-
2026-06-16days on market $110,000 Active 208 DOM
-
2026-06-15days on market $110,000 Active 207 DOM
-
2026-06-14days on market $110,000 Active 205 DOM
-
2026-06-12days on market $110,000 Active 204 DOM
-
2026-06-09days on market $110,000 Active 201 DOM
-
2026-06-08days on market $110,000 Active 200 DOM
-
2026-06-07days on market $110,000 Active 199 DOM
-
2026-06-02days on market $110,000 Active 194 DOM
-
2026-06-01days on market $110,000 Active 193 DOM
-
2026-05-31days on market $110,000 Active 192 DOM
-
2026-05-30days on market $110,000 Active 191 DOM
-
2026-04-22status Active 420-char remark
Show marketing remark (420 chars)
Move in ready! Welcome to this cozy 3 bed, 1 bath home located within walking distance to the Riverwalk. Home is also located close to all amenities & Marion General Hospital. This home has a covered front porch, and a 3-season room on the back for dining and entertaining while overlooking the fenced back yard. Property also includes a 1 car detached garage. This home is ready for a new owner and new memories!!
-
2026-03-22historical Active Under Contract 420-char remark
Show marketing remark (420 chars)
Move in ready! Welcome to this cozy 3 bed, 1 bath home located within walking distance to the Riverwalk. Home is also located close to all amenities & Marion General Hospital. This home has a covered front porch, and a 3-season room on the back for dining and entertaining while overlooking the fenced back yard. Property also includes a 1 car detached garage. This home is ready for a new owner and new memories!!
-
2025-11-20$115,000 Active 420-char remark
Show marketing remark (420 chars)
Move in ready! Welcome to this cozy 3 bed, 1 bath home located within walking distance to the Riverwalk. Home is also located close to all amenities & Marion General Hospital. This home has a covered front porch, and a 3-season room on the back for dining and entertaining while overlooking the fenced back yard. Property also includes a 1 car detached garage. This home is ready for a new owner and new memories!!
-
2020-09-25soldstatus $75,000 385-char remark
Show marketing remark (385 chars)
Super cute three bedroom home on a quiet street. Home has a nice front porch and a great fully fenced backyard. Screened in porch off the back adds to this home's appeal and is perfect for relaxing after work or on the weekends. Oversized one car garage that provides extra storage. Close proximity to Matter Park & the Riverwalk! Come take a look so you can call this your home!
-
2020-07-20$79,900 385-char remark
Show marketing remark (385 chars)
Super cute three bedroom home on a quiet street. Home has a nice front porch and a great fully fenced backyard. Screened in porch off the back adds to this home's appeal and is perfect for relaxing after work or on the weekends. Oversized one car garage that provides extra storage. Close proximity to Matter Park & the Riverwalk! Come take a look so you can call this your home!
-
2016-06-17soldstatus $63,000
-
2016-04-29$63,900
ⓘ Source: listings_history table (triggers on properties + properties_extension) + one-shot
backfill from property_details.listing_events for pre-trigger history.
Tax reassessment forecast IN · Partial reset (capped growth)
- Current annual tax
- $589 · $49/mo
- Projected year-2 tax
- $762 · $63/mo
- Expected delta
- +$173/yr (+$14/mo · 29.4%)
ⓘ Screening estimate from a state-policy table — verify with the county assessor before closing.
Climate risk First Street
- Flood 1/10 Low FEMA zone X (unshaded) · 0% chance over 30 yrs
- Wildfire 1/10 Low
- Heat 3/10 Moderate 7 d/yr ≥101°F today · 18 d/yr by 30 yrs out
- Wind 2/10 Low
- Air quality 2/10 Low 1 unhealthy d/yr today · 3 by 30 yrs out
Nearby sold comps map
Loading sold comps map…
Walkable amenities ~0.75 mi
Loading nearby amenities…
Taxation est. · year 1
- Rental income
- $12,343
- − Mortgage interest
- −$6,162
- − Property taxes
- −$589
- − Insurance
- −$550
- − Repairs & maintenance
- −$987
- − Management
- −$987
- − Depreciation
- −$3,200
- Taxable loss
- −$132
- Est. tax savings @ 24.0%
- +$32
- After-tax cash flow
- $1,722/yr
For passive investors: Depreciation is non-cash, so a rental often shows a tax loss while cash-flowing — sheltering income. Rental losses are passive: they offset passive income freely, and up to $25,000/yr can offset ordinary (W-2) income if you actively participate and your MAGI is under $100k (phasing out to $0 by $150k); unused losses carry forward. On sale, claimed depreciation is recaptured at up to 25%, and gains may owe capital-gains tax (a 1031 exchange can defer both). Figures are a year-1 estimate at your 24.0% rate — not tax advice; consult a CPA.
Schools (NCES district)
- District
- Marion Community Schools
- NCES district ID
- 1806390
- Math proficiency
- 18% ▼ -9.00%
- Reading proficiency
- 24% ▼ -6.00%
- Median HH income
- $33,415
- Composite
- 17.13/100
- National rank
- #9115
- State rank
- #277 of 301 in IN
Livability — Marion
- Score
- 65/100
- State rank
- #337
- US rank
- #13006
Category grades
Schools grade is shown separately in the Schools card above.
Census & demographics
- Census place
- Marion, IN
- County
- Grant County · 41,561 people
- City population
- 41,561
- Metro
- Marion, IN
- Population (ZIP)
- 18,189
- Household income
- $52,880
- Rent vs Own
- Severe rent burden
- 662.0
Population outlook (Grant County) Hauer SSP2
- Today (2025)
- 64,394 people
- By 2030
- 62,145 · -3.5%
- By 2040
- 57,252 · -11.1%
- By 2050
- 52,968 · -17.7%
- By 2075
- 45,986 · -28.6%
- By 2100
- 39,400 · -38.8%
Race, ethnicity, and origin ACS 2023
- Neighborhood character
- Predominantly White (84%)
- Race & ethnicity
- White 84% Two or more races 7% Hispanic / Latino 5% Black 4% Asian 1%
- Hispanic origin (detail)
- Mexican 4%
- Common ancestry
- Italian 3% Romanian 1% Iranian 1%
- Foreign-born
- 4% · Canada
- Languages at home
- 96% English-only · Spanish 3%
Political lean MEDSL · Grant
- 2024 margin
- Solid R (+41.8) · D 28.2% · R 70.0% · Other 1.9%
- 2008→2024 swing
- -28.7pp toward R · 2008: -13.1pp · 2024: -41.8pp
- All cycles
- 2024: R+41.8 2020: R+38.8 2016: R+39.5 2012: R+22.0 2008: R+13.1
Not yet ingested
- Civics
- —
Market trends
- HPI YoY
- ▼ -76.69%
- Current HPI
- 180.1174
- Rent YoY
- —
- Metro
- Marion, IN
- State GDP YoY
- ▲ 2.90%
- F500 in state
- 18
Industry mix (Fortune 500 HQ in IN)
| Industry | F500 HQs | Revenue |
|---|---|---|
| Industrial Machinery | 2 | $37B |
|
||
| Healthcare | 1 | $177B |
|
||
| Pharmaceuticals | 1 | $45B |
|
||
| Metals / Steel | 1 | $18B |
|
||
| Agriculture | 1 | $17B |
|
||
| Packaging | 1 | $12B |
|
||
Price history
+80.0% since first listed7 events — show timeline
- 2026-04-22 Relisted — IRMLS
- 2026-03-22 Contingent — IRMLS
- 2025-11-20 Listed $115,000 IRMLS
- 2020-09-25 Sold (MLS) $75,000 MIBOR as Distributed by MLS Grid
- 2020-07-20 Listed $79,900 MIBOR as Distributed by MLS Grid
- 2016-06-17 Sold (MLS) $63,000 IRMLS
- 2016-04-29 Listed $63,900 IRMLS
Property tax history
-9.9%/yrLatest (2025): $589 · -16.7% YoY. Source: county tax records.
Cash-flow waterfall
monthlySold comps — $/sqft
last 12 mo · ≤1 miLoading sold comps…