342 Tilleys Ln · Ezel, KY
Flood risk No data
- FEMA flood zone
- —
- Chance of flooding over 30 yrs
- —
- Est. flood insurance / yr
- —
Fire risk No data
- Est. fire insurance / yr
- —
Heat risk No data
- Hot days now (above threshold)
- —
- Hot days in 30 yrs
- —
Wind risk No data
- Chance of severe wind over 30 yrs
- —
Air-quality risk No data
- Unhealthy air days now
- —
- Unhealthy air days in 30 yrs
- —
Risk factors via First Street. Map © Google.
Why this score? — see what drove the B- grade
The composite is a weighted blend of 9 inputs, each scored 0–100. Each bar is that input's sub-score; the figure is the points it added to the 100-point composite (weight × sub-score).
- Cash flow +26.1/30.0
- ARV discount +15.0/15.0
- DSCR +8.8/10.0
- 1% rule +6.9/10.0
- Appreciation +3.2/10.0
- Livability +3.1/5.0
- Rent growth +2.5/5.0
- Schools +2.0/10.0
- Condition / age +1.0/5.0
$79,995
🖨 Deal sheet 📄 Offer letter ✓ Due diligence
Listing remarks MLS
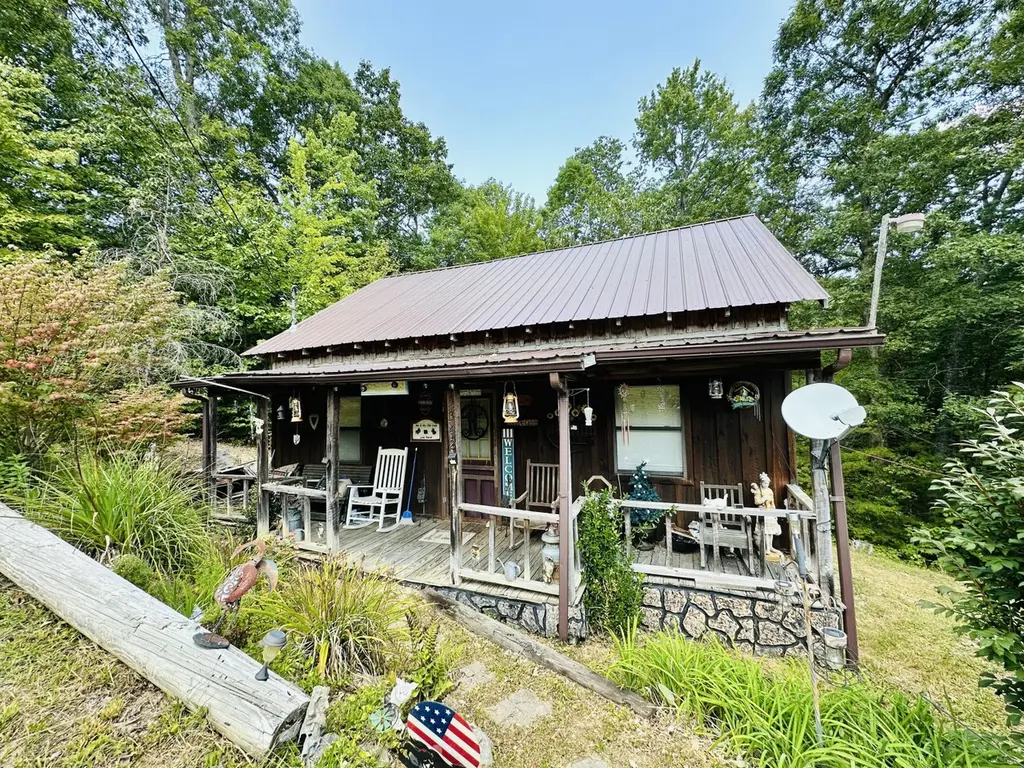
Charming Country Cottage in Morgan View and on Tilley's Lane. Close to Cave Run Lake. Minutes from Longbow Marina, Bangor Boat Ramp, Clay Lick and Warix Boat Ramps. Home has a bedroom downstairs with a huge upstairs that is open but could be split easily into 2 bedrooms. Downstairs has a mini-split heating / air system. upstairs has a like new window AC. Front porch sitting or large rear porch for sipping your coffee or favorite beverage will have you relaxing the way you wish to. Property backs up to Daniel Boone National Forest. Cabin is furnished for your ease of settling in. Storage Building on site remains with the property. Selling 'as is' but inspections are welcome! Don't Delay!
Key facts
- Like new window ac
- Front porch sitting
- Large rear porch
Tags
Neighborhood map
What this means for you Summary
Snapshot
- This is a 2-bed/1.0-bath single-family listed at $80k. Condition is rated poor.
Deal economics
- At list price, monthly cash flow is $201 ($2k/yr) — positive.
- The deal already cash-flows at list — no discount required.
- Meets the 1% rule at list price ($954 rent vs $80k).
- Recommended offer: $70k (12.0% below list) — sets the bar for market timing.
- Cap rate 9.3% vs local median 3.4% in Ezel — top-decile yield for the area; either an underpriced asset or a hidden risk that comps aren't pricing in. Stress-test before assuming the spread holds.
Location & tenants
- Location reads 61/100 on livability (#375 in KY) — a middle-class / working-renter tenant base. Strengths: cost of living A+, housing A-; Watch: health & safety D+, schools D, amenities F.
- Morgan County (rural): math 14% / reading 35% proficiency, ranked #150 of 165 in KY (top 91%) — low school quality limits family demand, transient renter base, plan for 1-2y turnover; 64% free/reduced lunch — lower-income household profile, screen leases tightly.
- Market conditions: 62 active listings in the ZIP; 2 units permitted in Morgan County in 2024 (0 in 5+ unit buildings).
Forward outlook
- Local home prices are declining (-3.0%/yr); year-one equity from $553 of loan paydown is wiped out by about $2k of value loss. Plan a longer hold.
- Morgan County population projected at -16% by 2050 — secular population decline; favor cash flow + early exit over multi-decade hold.
Negotiation context
- It's been on market 170 days — a 12% lower offer ($70k) is reasonable based on typical stale-listing flexibility.
- 3 sale attempts since 2y ago; this cycle's ask has dropped $10k (11%) from the opening price — seller is motivated, your offer sets the floor, not the list.
Questions for the listing agent
- It's been on market 170 days. Have you received any prior offers? Is the seller open to a 12% concession, seller financing, or rate buy-down credit?
- Have any recent inspections been done? Can we get a copy of the seller's disclosures and any deferred-maintenance estimates?
- Why hasn't it sold? Are there any deal-killer items the seller is aware of (foundation, flood, title, zoning, code violations)?
- Is there a deadline driving the sale (1031 exchange, divorce, estate, relocation)? That informs how much negotiation room exists.
- Schools are D-rated, which usually means shorter tenancies and higher turnover. Who's the typical renter profile here, and what's been the actual vacancy rate?
- What's the average days-on-market for RENTAL listings here right now (not sales)? A rising rental-DOM trend means longer vacancies and softer asking-rent achievability than the comps imply.
- What's the recent tenant-quality profile in this submarket — average credit score on applications, eviction rate, late-payment / NSF rate, and stable-employment percentage? A property-management company in the area should have these aggregated.
- How much new for-sale + rental construction is in the pipeline within 1–3 miles? Heavy new supply typically softens prices + rents 12–24 months out; constrained supply supports both.
Investment metrics
- 1% rule
- 1.19% ✓
- Cap rate
- 9.30%
- Cash-on-cash
- 10.75%
- DSCR
- 1.48
- GRM
- 7.0
CMA / ARV
- ARV (median comp)
- $153,824
- List price
- $79,995
- Delta
- -48.00%
- Verdict
- UNDERPRICED
- Comps
- 20 within 1.0 mi
Show comp detail 2 sales within ~0.75 mi
| Address | Dist | Beds/Ba | Sqft | Sold | Price | $/sf | Match |
|---|---|---|---|---|---|---|---|
| 280 Easy St | 0.23mi | 2/1.0 | 1,155 (+5%) | 7mo | $195,000 | $169 | 75 |
| 42 Alley Rd | 0.49mi | 2/1.0 | 1,092 (-1%) | 2mo | $160,000 | $147 | 75 |
Match score weights: distance 35% · size 25% · config 20% · recency 20%. Top-matched comps best support the ARV.
Projected returns pro-forma
-3.0% appreciation · 3.0% rent growth · sell at horizon
- IRR
- -0.2%
- Equity multiple
- 0.99×
- Total profit
- $-173
- Equity at exit
- $11,928
- IRR
- 9.5%
- Equity multiple
- 1.73×
- Total profit
- $16,359
- Equity at exit
- $6,917
Cash invested: $22,399 (down + closing). Projections, not guarantees.
Landlord ↔ Tenant lean methodology
- Overall (STATE)
- 83 Strongly Landlord-Friendly
- State Kentucky
- 83 Strongly Landlord-Friendly · R+16
- County
- — inherits STATE
- City
- — inherits STATE
ZIP-level market 40387
- Home prices YoY
- -1.6%
- Active inventory
- 62
- Price-to-rent
- 7.0×
Monthly cashflow live
- Estimated rent
- $954 medium interval (Pro) →
- Mortgage (P&I)
- −$420
- Tax est. 1.5%
- −$100 /mo · $1,200/yr
- Insurance
- −$33
- HOA
- −$0
- Vacancy / Maint / Mgmt
- −$200
- Net cashflow
- $201
Break-even live
UW: 25.0% down · 7.5% · 30yr · 1.5% tax · 5.0% vac · 8.0% maint · 8.0% mgmt
Financing live
Cash to close
- Down payment
- $19,999
- Closing costs
- $2,400
- Reserves months
- —
- Total cash needed
- —
Loan-product check · same deal, 3 products live
Conventional
25% down · 7.5% · 30yr
- Down + closing
- —
- Monthly P&I
- —
- Monthly cashflow
- —
- DSCR
- —
- Eligible?
- —
Personal DTI + credit; lowest rate.
DSCR
20% down · 8.5% · 30yr
- Down + closing
- —
- Monthly P&I
- —
- Monthly cashflow
- —
- DSCR
- —
- Eligible?
- —
No personal income docs; deal must DSCR.
Hard money
10% down · 12.0% · 12mo
- Down + closing
- —
- Monthly P&I
- —
- Monthly cashflow
- —
- DSCR
- —
- Eligible?
- —
Short-term bridge; refi at stabilization.
Listing history 17 events
-
2026-06-10days on market $79,995 Active 170 DOM
-
2026-06-09days on market $79,995 Active 169 DOM
-
2026-06-08days on market $79,995 Active 168 DOM
-
2026-06-07pricedays on market $79,995 Active 167 DOM
-
2026-06-05days on market $89,900 Active 164 DOM
-
2026-06-03days on market $89,900 Active 163 DOM
-
2026-06-02days on market $89,900 Active 162 DOM
-
2026-06-01days on market $89,900 Active 161 DOM
-
2026-05-31days on market $89,900 Active 160 DOM
-
2026-05-31days on market $89,900 Active 159 DOM
-
2025-12-22$89,900 Active 706-char remark
Show marketing remark (706 chars)
Charming Country Cottage in Morgan View and on Tilley's Lane. Close to Cave Run Lake. Minutes from Longbow Marina, Bangor Boat Ramp, Clay Lick and Warix Boat Ramps. Home has a bedroom downstairs with a huge upstairs that is open but could be split easily into 2 bedrooms. Downstairs has a mini-split heating / air system. upstairs has a like new window AC. Front porch sitting or large rear porch for sipping your coffee or favorite beverage will have you relaxing the way you wish to. Property backs up to Daniel Boone National Forest. Cabin is furnished for your ease of settling in. Storage Building on site remains with the property. Selling 'as is' but inspections are welcome! Don't Delay!
-
2025-12-08historical
-
2025-10-18price $89,900
-
2025-06-13price $99,500
-
2025-06-08$105,000 Active
-
2025-02-28historical
-
2024-08-31$119,000 Active
ⓘ Source: listings_history table (triggers on properties + properties_extension) + one-shot
backfill from property_details.listing_events for pre-trigger history.
Nearby sold comps map
Loading sold comps map…
Walkable amenities ~0.75 mi
Loading nearby amenities…
Taxation est. · year 1
- Rental income
- $11,444
- − Mortgage interest
- −$4,481
- − Property taxes
- −$1,200
- − Insurance
- −$400
- − Repairs & maintenance
- −$916
- − Management
- −$916
- − Depreciation
- −$2,327
- Taxable income
- $1,205
- Est. tax owed @ 24.0%
- −$289
- After-tax cash flow
- $2,118/yr
For passive investors: Depreciation is non-cash, so a rental often shows a tax loss while cash-flowing — sheltering income. Rental losses are passive: they offset passive income freely, and up to $25,000/yr can offset ordinary (W-2) income if you actively participate and your MAGI is under $100k (phasing out to $0 by $150k); unused losses carry forward. On sale, claimed depreciation is recaptured at up to 25%, and gains may owe capital-gains tax (a 1031 exchange can defer both). Figures are a year-1 estimate at your 24.0% rate — not tax advice; consult a CPA.
Condition & rehab AI · 12 photos
This property requires extensive repairs and maintenance to improve its condition and value. Immediate attention is needed to address the deteriorating exterior and interior conditions.
Repairs flagged
- Major siding — Weathered and peeling
- Major deck — Worn and uneven
- Major interior walls — Worn paint and cluttered
Value-add opportunities
- Both Paint and organize interior — Enhances appearance and functionality
- Both Replace worn deck — Improves safety and curb appeal
- Both Repair and replace siding — Enhances curb appeal and durability
Renovation cost estimate screening
| Repair item | Severity | Est. cost |
|---|---|---|
| siding · Weathered and peeling | Major | $15,000–50,000 |
| deck · Worn and uneven | Major | $15,000–50,000 |
| interior walls · Worn paint and cluttered | Major | $15,000–50,000 |
| Total estimated repair cost · 3 items | $45,000–150,000 |
Value-add ROI direction
- Both Paint and organize interior — Enhances appearance and functionality ↑
- Both Replace worn deck — Improves safety and curb appeal ↑
- Both Repair and replace siding — Enhances curb appeal and durability ↑
ⓘ Cost ranges are severity-bucket heuristics (US national rule-of-thumb). Get contractor quotes + a written scope before underwriting a rehab budget.
Schools (NCES district)
- District
- Morgan County
- NCES district ID
- 2104290
- Math proficiency
- 14% ▼ -30.00%
- Reading proficiency
- 35% ▼ -21.00%
- Median HH income
- $31,371
- Composite
- 19.78/100
- National rank
- #8704
- State rank
- #150 of 165 in KY
Livability — Ezel
- Score
- 61/100
- State rank
- #375
- US rank
- #17739
Category grades
Schools grade is shown separately in the Schools card above.
Census & demographics
- Population (ZIP)
- 1,805
Population outlook (Morgan County) Hauer SSP2
- Today (2025)
- 12,632 people
- By 2030
- 12,211 · -3.3%
- By 2040
- 11,408 · -9.7%
- By 2050
- 10,612 · -16.0%
- By 2075
- 8,790 · -30.4%
- By 2100
- 6,944 · -45.0%
Race, ethnicity, and origin ACS 2023
- Neighborhood character
- Predominantly White (96%)
- Race & ethnicity
- White 96% Hispanic / Latino 2% Asian 1%
- Common ancestry
- Lithuanian 2% Slovak 1% Scotch-Irish 1%
- Languages at home
- 98% English-only · Spanish 2%
Political lean MEDSL · Morgan
- 2024 margin
- Solid R (+63.5) · D 17.5% · R 81.0% · Other 1.5%
- 2008→2024 swing
- -51.7pp toward R · 2008: -11.8pp · 2024: -63.5pp
- All cycles
- 2024: R+63.5 2020: R+56.4 2016: R+55.0 2012: R+36.9 2008: R+11.8
Not yet ingested
- Civics
- —
Market trends
- HPI YoY
- ▼ -3.58%
- Current HPI
- 215.8197
- Rent YoY
- —
- Metro
- —
- State GDP YoY
- ▲ 1.81%
- F500 in state
- 4
Industry mix (Fortune 500 HQ in KY)
| Industry | F500 HQs | Revenue |
|---|---|---|
| Healthcare | 1 | $118B |
|
||
| Food / Beverage | 1 | $7B |
|
||
Price history
-24.5% since first listed7 events — show timeline
- 2025-12-22 Listed $89,900 ImagineMLS
- 2025-12-08 Listing Removed — ImagineMLS
- 2025-10-18 Price Changed $89,900 ImagineMLS
- 2025-06-13 Price Changed $99,500 ImagineMLS
- 2025-06-08 Listed $105,000 ImagineMLS
- 2025-02-28 Listing Removed — ImagineMLS
- 2024-08-31 Listed $119,000 ImagineMLS
Cash-flow waterfall
monthlySold comps — $/sqft
last 12 mo · ≤1 miLoading sold comps…