1295 S Cawston Ave #47 · Hemet, CA
Flood risk 1/10 · Minimal
- FEMA flood zone
- X (shaded)
- Chance of flooding over 30 yrs
- 0.0%
- Est. flood insurance / yr
- $507 – $1,088
Fire risk 6/10 · Moderate
- Est. fire insurance / yr
- $659 – $1,223
Heat risk 7/10 · Major
- Hot days now (above 104°F)
- 7 days/yr
- Hot days in 30 yrs
- 21 days/yr
Wind risk 1/10 · Minimal
- Chance of severe wind over 30 yrs
- —
Air-quality risk 6/10 · Moderate
- Unhealthy air days now
- 9 days/yr
- Unhealthy air days in 30 yrs
- 11 days/yr
Risk factors via First Street. Map © Google.
Why this score? — see what drove the C grade
The composite is a weighted blend of 9 inputs, each scored 0–100. Each bar is that input's sub-score; the figure is the points it added to the 100-point composite (weight × sub-score).
- Cash flow +23.1/30.0
- ARV discount +10.4/15.0
- 1% rule +7.6/10.0
- DSCR +7.4/10.0
- Rent growth +3.4/5.0
- Livability +2.6/5.0
- Schools +2.5/10.0
- Condition / age +2.5/5.0
- Appreciation +0.0/10.0
$125,000
🖨 Deal sheet 📄 Offer letter ✓ Due diligence
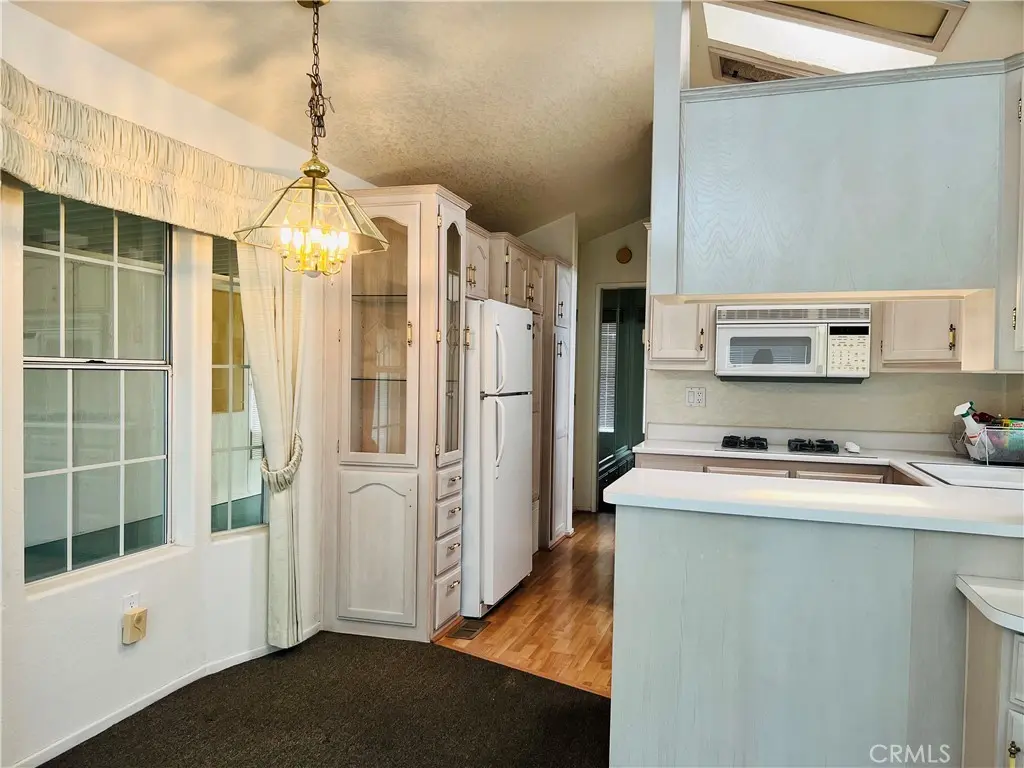
Listing remarks MLS
Park Model In Senior Gated Community. 1997 Hallmark Sold 'as Is'. Owner To Do No Repairs. 02/11/04
Key facts
- 2,178 sq ft lot
- 2 garage spots
- Community pool
Property features AI
Finance
- Other: Lot described as 0-1 unit/acre; Living area source listed as other
- HOA & community: Part of the Mtn Shadows association; Monthly association fee of $292; Association amenities include: pet rules, gym/exercise room, onsite property management, pool, clubhouse, spa, billiard room
Exterior
- Parking: 2 garage spaces; 2 total parking spaces
- Security: Controlled access
- Utilities: Public sewer; District/public water
- Home design: Manufactured house; Single-story; Located in a planned development; No common walls; Part of a community of about 250 units
- Construction: Year built provided by seller; Not an accessory dwelling unit
- Exterior features: Association pool; Street lighting
Interior
- Bedrooms: 1 bedroom on the main level
- Bathrooms: 1 full bathroom
- Heating & cooling: Central cooling
- Interior features: One-level home; Entry on main level; Bonus room; All bedrooms on main level; Has view
- Laundry & utility: Laundry located in the carport
Neighborhood map
What this means for you Summary
Snapshot
- This is a 1-bed/1.0-bath manufactured listed at $125k.
Deal economics
- At list price, monthly cash flow is $225 ($3k/yr) — positive.
- The deal already cash-flows at list — no discount required.
- Meets the 1% rule at list price ($2k rent vs $125k).
- Recommended offer: $123k (1.5% below list) — sets the bar for market timing.
- Cap rate 8.5% vs local median 4.9% in Hemet — top-decile yield for the area; either an underpriced asset or a hidden risk that comps aren't pricing in. Stress-test before assuming the spread holds.
Location & tenants
- Location reads 51/100 on livability (#1,056 in CA) — a working-class tenant base; expect higher turnover. Strengths: housing A+; Watch: crime D+, schools F, amenities F.
- Hemet Unified (suburban): math 19% / reading 41% proficiency, ranked #360 of 517 in CA (top 70%) — families likely to look elsewhere, expect single-tenant / working-renter base with shorter leases; 66% free/reduced lunch — lower-income household profile, screen leases tightly.
- Market conditions: Rents rising (+3.7%/yr); 290 active listings in the ZIP; 1 comparable units currently listed for rent nearby; 9,195 units permitted in Riverside County in 2024 (1,512 in 5+ unit buildings).
Forward outlook
- Local home prices are declining (-3.0%/yr); year-one equity from $864 of loan paydown is wiped out by about $4k of value loss. Plan a longer hold.
- Riverside County population projected at +22% by 2050 — long-run rental-demand tailwind backs the buy-and-hold thesis.
Negotiation context
- It's been on market 29 days — a 2% lower offer ($123k) is reasonable based on typical stale-listing flexibility.
- 2 sale attempts since 22y ago with the ask held roughly flat each time — persistent listings suggest the price (not the market) is what's stuck; bring a comps-based counter.
- Current owner paid $26k; list at $125k implies a 381% gain — meaningful room to come down on a strong offer.
Risks & watch-outs
- Climate carrying-cost: major wildfire risk; extreme-heat days projected 7→21/yr by 2055 (HVAC capex compounding) — expect insurance premiums to compound above CPI over the hold.
Questions for the listing agent
- What does the HOA fee cover, when was the last increase, and are there any pending special assessments or reserve-fund shortfalls?
- Is there a deadline driving the sale (1031 exchange, divorce, estate, relocation)? That informs how much negotiation room exists.
- Schools are F-rated, which usually means shorter tenancies and higher turnover. Who's the typical renter profile here, and what's been the actual vacancy rate?
- Crime grade is D in this area — have there been break-ins, vandalism, or insurance claims at this property in the last 3 years? What carrier currently insures it and at what premium?
- What's the average days-on-market for RENTAL listings here right now (not sales)? A rising rental-DOM trend means longer vacancies and softer asking-rent achievability than the comps imply.
- What's the recent tenant-quality profile in this submarket — average credit score on applications, eviction rate, late-payment / NSF rate, and stable-employment percentage? A property-management company in the area should have these aggregated.
- How much new for-sale + rental construction is in the pipeline within 1–3 miles? Heavy new supply typically softens prices + rents 12–24 months out; constrained supply supports both.
Investment metrics
- 1% rule
- 1.26% ✓
- Cap rate
- 8.45%
- Cash-on-cash
- 7.71%
- DSCR
- 1.34
- GRM
- 6.6
CMA / ARV
- ARV (on-the-fly)
- $133,700
- Comps found
- 12
Show comp detail 12 sales within ~0.75 mi
| Address | Dist | Beds/Ba | Sqft | Sold | Price | $/sf | Match |
|---|---|---|---|---|---|---|---|
| 1295 S Cawston Ave #6 | 0.03mi | 1/1.0 | 700 (0%) | 3mo | $115,000 | $164 | 96 |
| 1295 S Cawston Ave #118 | 0.09mi | 1/1.0 | 700 (0%) | 8mo | $125,000 | $179 | 89 |
| 1295 S Cawston Ave #291 | 0.13mi | 1/1.0 | 700 (0%) | 8mo | $134,000 | $191 | 87 |
| 1295 S Cawston Ave #391 | 0.09mi | 1/1.0 | 750 (+7%) | 2mo | $147,500 | $197 | 82 |
| 1295 S Cawston #102 | 0.11mi | 1/1.0 | 650 (-7%) | 2mo | $136,000 | $209 | 81 |
| 1295 S Cawston Ave #490 | 0.09mi | 2/1.0 (+1) | 650 (-7%) | 1mo | $94,500 | $145 | 78 |
| 1295 S Cawston #67 | 0.12mi | 2/1.0 (+1) | 750 (+7%) | 4mo | $143,499 | $191 | 74 |
| 1295 S Cawston Ave #66 | 0.11mi | 2/1.0 (+1) | 750 (+7%) | 8mo | $127,000 | $169 | 71 |
| 1295 S Cawston #263 | 0.12mi | 1/1.0 | 600 (-14%) | 2mo | $128,000 | $213 | 69 |
| 1295 S Cawston Ave #340 | 0.09mi | 1/1.0 | 600 (-14%) | 6mo | $120,000 | $200 | 67 |
| 1295 S Cawston #69 | 0.13mi | 1/1.0 | 600 (-14%) | 6mo | $127,000 | $212 | 65 |
| 1295 S Cawston Ave #90 | 0.14mi | 1/1.0 | 800 (+14%) | 10mo | $128,000 | $160 | 62 |
Match score weights: distance 35% · size 25% · config 20% · recency 20%. Top-matched comps best support the ARV.
Projected returns pro-forma
-3.0% appreciation · 3.74% rent growth · sell at horizon
- IRR
- -3.5%
- Equity multiple
- 0.87×
- Total profit
- $-4,627
- Equity at exit
- $18,638
- IRR
- 7.2%
- Equity multiple
- 1.57×
- Total profit
- $19,846
- Equity at exit
- $10,808
Cash invested: $35,000 (down + closing). Projections, not guarantees.
Landlord ↔ Tenant lean methodology
- Overall (STATE)
- 18 Strongly Tenant-Friendly
- State California
- 18 Strongly Tenant-Friendly · D+13
- County
- — inherits STATE
- City
- — inherits STATE
ZIP-level market 92545
- Home prices YoY
- -24.6%
- Rents YoY
- 3.7%
- Active inventory
- 290
- Price-to-rent
- 6.6×
Monthly cashflow live
- Estimated rent
- $1,581 medium interval (Pro) →
- Mortgage (P&I)
- −$656
- Tax from tax record
- −$24 /mo · $294/yr
- Insurance
- −$52
- HOA
- −$292
- Vacancy / Maint / Mgmt
- −$332
- Net cashflow
- $225
Break-even live
UW: 25.0% down · 7.5% · 30yr · 1.5% tax · 5.0% vac · 8.0% maint · 8.0% mgmt
Financing live
Cash to close
- Down payment
- $31,250
- Closing costs
- $3,750
- Reserves months
- —
- Total cash needed
- —
Loan-product check · same deal, 3 products live
Conventional
25% down · 7.5% · 30yr
- Down + closing
- —
- Monthly P&I
- —
- Monthly cashflow
- —
- DSCR
- —
- Eligible?
- —
Personal DTI + credit; lowest rate.
DSCR
20% down · 8.5% · 30yr
- Down + closing
- —
- Monthly P&I
- —
- Monthly cashflow
- —
- DSCR
- —
- Eligible?
- —
No personal income docs; deal must DSCR.
Hard money
10% down · 12.0% · 12mo
- Down + closing
- —
- Monthly P&I
- —
- Monthly cashflow
- —
- DSCR
- —
- Eligible?
- —
Short-term bridge; refi at stabilization.
Rent comps 1 comps
| Address | Beds | Baths | Sqft | Rent | $/sqft | DOM | Units | Dist |
|---|---|---|---|---|---|---|---|---|
| 3030 W Acacia Ave Hemet, CA | 1.0–3.0 | 1.0–2.0 | 892 | $1,595 | $1.79 | 1d | 10 | 1.42mi |
HOA detail
- Monthly dues
- $292 · $3,504/yr
- Likely covers
- security
Listing history 19 events
-
2026-06-18days on market $125,000 Active 29 DOM
-
2026-06-17days on market $125,000 Active 28 DOM
-
2026-06-16days on market $125,000 Active 27 DOM
-
2026-06-15days on market $125,000 Active 26 DOM
-
2026-06-13days on market $125,000 Active 24 DOM
-
2026-06-09days on market $125,000 Active 20 DOM
-
2026-06-08days on market $125,000 Active 19 DOM
-
2026-06-07days on market $125,000 Active 18 DOM
-
2026-06-04days on market $125,000 Active 15 DOM
-
2026-06-03days on market $125,000 Active 14 DOM
-
2026-06-02days on market $125,000 Active 13 DOM
-
2026-06-01days on market $125,000 Active 12 DOM
-
2026-05-31days on market $125,000 Active 11 DOM
-
2026-05-20$125,000 Active
-
2026-05-19historical $125,000
-
2004-05-28soldstatus $26,000
-
2004-03-15soldstatus $53,500 98-char remark
Show marketing remark (98 chars)
Park Model In Senior Gated Community. 1997 Hallmark Sold 'as Is'. Owner To Do No Repairs. 02/11/04
-
2004-01-26$60,000 98-char remark
Show marketing remark (98 chars)
Park Model In Senior Gated Community. 1997 Hallmark Sold 'as Is'. Owner To Do No Repairs. 02/11/04
-
1986-10-31soldstatus $20,500
ⓘ Source: listings_history table (triggers on properties + properties_extension) + one-shot
backfill from property_details.listing_events for pre-trigger history.
Tax reassessment forecast CA · Resets to sale price
- Current annual tax
- $294 · $24/mo
- Projected year-2 tax
- $950 · $79/mo
- Expected delta
- +$656/yr (+$55/mo · 223.1%)
ⓘ Screening estimate from a state-policy table — verify with the county assessor before closing.
Climate risk First Street
- Flood 1/10 Low FEMA zone X (shaded) · 0% chance over 30 yrs
- Wildfire 6/10 Major
- Heat 7/10 Severe 7 d/yr ≥104°F today · 21 d/yr by 30 yrs out
- Wind 1/10 Low
- Air quality 6/10 Major 9 unhealthy d/yr today · 11 by 30 yrs out
Nearby sold comps map
Loading sold comps map…
Walkable amenities ~0.75 mi
Loading nearby amenities…
Taxation est. · year 1
- Rental income
- $18,971
- − Mortgage interest
- −$7,002
- − Property taxes
- −$294
- − Insurance
- −$625
- − Repairs & maintenance
- −$1,518
- − Management
- −$1,518
- − HOA
- −$3,504
- − Depreciation
- −$3,636
- Taxable income
- $874
- Est. tax owed @ 24.0%
- −$210
- After-tax cash flow
- $2,488/yr
For passive investors: Depreciation is non-cash, so a rental often shows a tax loss while cash-flowing — sheltering income. Rental losses are passive: they offset passive income freely, and up to $25,000/yr can offset ordinary (W-2) income if you actively participate and your MAGI is under $100k (phasing out to $0 by $150k); unused losses carry forward. On sale, claimed depreciation is recaptured at up to 25%, and gains may owe capital-gains tax (a 1031 exchange can defer both). Figures are a year-1 estimate at your 24.0% rate — not tax advice; consult a CPA.
Schools (NCES district)
- District
- Hemet Unified
- NCES district ID
- 0616920
- Math proficiency
- 19% ▼ -3.00%
- Reading proficiency
- 41% ▲ 4.00%
- Median HH income
- $39,962
- Composite
- 25.16/100
- National rank
- #7517
- State rank
- #360 of 517 in CA
Livability — Hemet
- Score
- 51/100
- State rank
- #1056
- US rank
- #25208
Category grades
Schools grade is shown separately in the Schools card above.
Census & demographics
- Census place
- Hemet, CA
- County
- Riverside County · 2,287,001 people
- City population
- 137,670
- Metro
- Riverside-San Bernardino-Ontario, CA
- Population (ZIP)
- 45,982
- Household income
- $63,770
- Rent vs Own
- Severe rent burden
- 1813.0
Population outlook (Riverside County) Hauer SSP2
- Today (2025)
- 2,664,475 people
- By 2030
- 2,802,692 · +5.2%
- By 2040
- 3,050,904 · +14.5%
- By 2050
- 3,256,783 · +22.2%
- By 2075
- 3,655,058 · +37.2%
- By 2100
- 3,766,594 · +41.4%
Race, ethnicity, and origin ACS 2023
- Neighborhood character
- Diverse neighborhood (Simpson 0.65)
- Race & ethnicity
- Hispanic / Latino 46% White 35% Two or more races 17% Black 8% Asian 5% Native American 1%
- Hispanic origin (detail)
- Mexican 40%
- Common ancestry
- Slovak 2% Lithuanian 2% Portuguese 1%
- Foreign-born
- 19% · Canada, Vietnam, Jamaica
- Languages at home
- 69% English-only · Spanish 27% Tagalog/Filipino 1% Other Indo-European 1%
Political lean MEDSL · Riverside
- 2024 margin
- Toss-up / Even · D 48.0% · R 49.3% · Other 2.6%
- 2008→2024 swing
- -3.6pp toward R · 2008: 2.3pp · 2024: -1.3pp
- All cycles
- 2024: R+1.3 2020: D+8.0 2016: D+4.3 2012: R+0.4 2008: D+2.3
Not yet ingested
- Civics
- —
Market trends
- HPI YoY
- ▼ -116.25%
- Current HPI
- 356.9414
- Rent YoY
- ▲ 3.74%
- Metro
- Riverside-San Bernardino-Ontario, CA
- State GDP YoY
- ▲ 3.21%
- F500 in state
- 116
Industry mix (Fortune 500 HQ in CA)
| Industry | F500 HQs | Revenue |
|---|---|---|
| Technology | 27 | $1,492B |
|
||
| Financial Services | 3 | $174B |
|
||
| Retail | 3 | $44B |
|
||
| Insurance | 3 | $26B |
|
||
| Media / Entertainment | 2 | $115B |
|
||
| Pharmaceuticals / Biotech | 2 | $62B |
|
||
Price history
+509.8% since first listed6 events — show timeline
- 2026-05-20 Listed $125,000 CRMLS
- 2026-05-19 Coming Soon $125,000 CRMLS
- 2004-05-28 Sold (Public Records) $26,000 Public Records
- 2004-03-15 Sold (MLS) $53,500 CRMLS
- 2004-01-26 Listed $60,000 CRMLS
- 1986-10-31 Sold (Public Records) $20,500 Public Records
Property tax history
+0.6%/yrLatest (2014): $294 · -2.7% YoY. Source: county tax records.
Cash-flow waterfall
monthlySold comps — $/sqft
last 12 mo · ≤1 miLoading sold comps…