 Multi-family
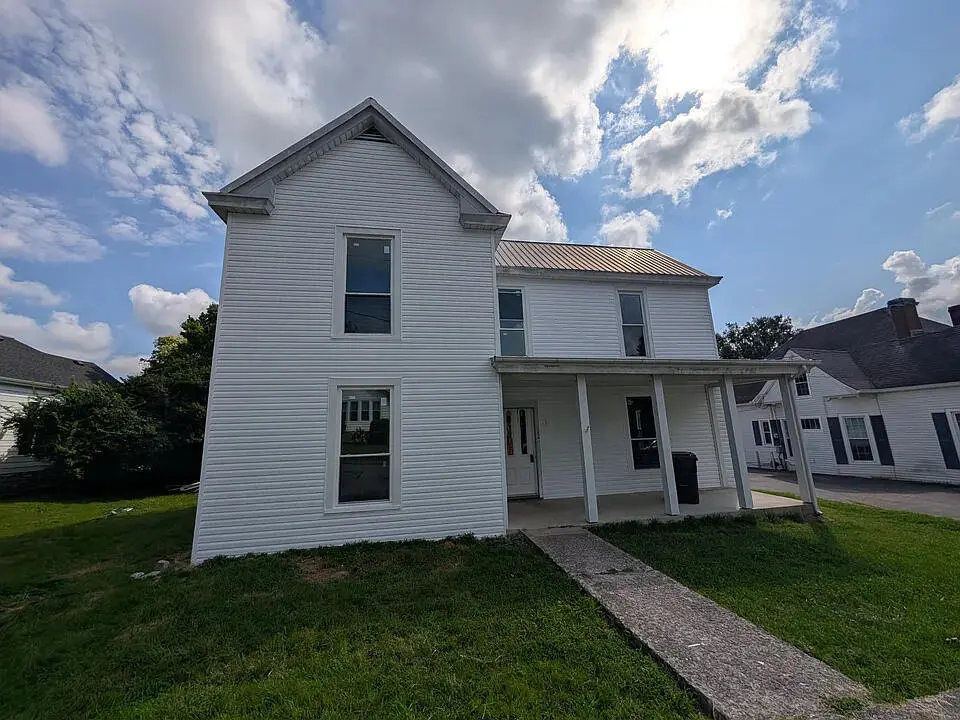
254 Mount Airy Ave · Paris, KY
Flood risk 1/10 · Minimal
- FEMA flood zone
- X (unshaded)
- Chance of flooding over 30 yrs
- 0.0%
- Est. flood insurance / yr
- $507 – $1,088
Fire risk 1/10 · Minimal
- Est. fire insurance / yr
- $839 – $1,559
Heat risk 4/10 · Minor
- Hot days now (above 102°F)
- 7 days/yr
- Hot days in 30 yrs
- 19 days/yr
Wind risk 2/10 · Minimal
- Chance of severe wind over 30 yrs
- 2.0%
Air-quality risk 2/10 · Minimal
- Unhealthy air days now
- 1 days/yr
- Unhealthy air days in 30 yrs
- 1 days/yr
Risk factors via First Street. Map © Google.
Why this score? — see what drove the C- grade
The composite is a weighted blend of 9 inputs, each scored 0–100. Each bar is that input's sub-score; the figure is the points it added to the 100-point composite (weight × sub-score).
- Cash flow +22.0/30.0
- ARV discount +7.5/15.0
- DSCR +7.0/10.0
- 1% rule +5.8/10.0
- Livability +3.4/5.0
- Rent growth +2.5/5.0
- Condition / age +2.5/5.0
- Schools +1.7/10.0
- Appreciation +0.0/10.0
$259,900
🖨 Deal sheet (PDF) 📄 Offer letter ✓ Due diligence
Multi-family units
County records classify this as Multi-Family (2-4 Unit). Listing-text estimate: 1 unit. estimate disagrees with records
Listing remarks
Great fully occupied triplex investment home in Paris with 3 units bringing in $2,900/month in rental income. There are 3 units (2 downstairs and 1 upstairs with an outside entry) all with a 1 bedroom 1 bathroom Living Room configuration. Perfect for an investor just looking at parking some money and getting great cash flow. Call today to inquire about this property!
Key facts
- 0.31 acre lot
- Built 1933
- Listed 17 days
Property features AI
Finance
- Other: Building total area 2,757; Lot about 0.31 acres (13,500 sq ft)
Exterior
- Parking: Driveway
- Utilities: Electricity connected; Sewer connected; Water connected; Public sewer
- Home design: Triplex; Two levels
- Construction: Block foundation; Vinyl siding
- Exterior features: Public water; Not waterfront
Interior
- Kitchen: Refrigerator; Range
- Flooring: Vinyl
- Bathrooms: 3 full bathrooms
- Heating & cooling: Baseboard heating; Window AC units
- Interior features: Eat-in kitchen; Fireplace
- Laundry & utility: Washer hookup; Electric dryer hookup
Neighborhood map
What this means for you Summary
Snapshot
- This is a 3-bed/3.0-bath multifamily listed at $260k.
Deal economics
- At list price, monthly cash flow is $414 ($5k/yr) — positive.
- The deal already cash-flows at list — no discount required.
- Meets the 1% rule at list price ($3k rent vs $260k).
- Recommended offer: $256k (1.5% below list) — sets the bar for market timing.
- Cap rate 8.2% vs local median 3.3% in Paris — top-decile yield for the area; either an underpriced asset or a hidden risk that comps aren't pricing in. Stress-test before assuming the spread holds.
Location & tenants
- Location reads 67/100 on livability (#218 in KY) — a middle-class / working-renter tenant base. Strengths: crime A+, cost of living A+, housing A+; Watch: amenities F, commute F, employment F.
- Paris Independent (town): math 13% / reading 29% proficiency, ranked #159 of 165 in KY (top 96%) — low school quality limits family demand, transient renter base, plan for 1-2y turnover; 68% free/reduced lunch — lower-income household profile, screen leases tightly.
- Zoned schools: Paris Elementary School (math 17% / reading 27%, grade F, #525 of 676 statewide, top 82%, 307 students, 78% FRL); Paris Middle School (math 12% / reading 32%, grade F, #203 of 217 statewide, top 94%, 146 students, 83% FRL); Paris High School (math 15% / reading 24%, grade F, #212 of 254 statewide, top 83%, 221 students, 75% FRL).
- Market conditions: 128 active listings in the ZIP; 90 units permitted in Bourbon County in 2024 (0 in 5+ unit buildings).
- At $2,797/mo this rent would consume 53% of the median local household income ($63k/yr) (locally 509% of renters already pay >50% of income on rent) — very limited rent-growth headroom before tenants either downsize or default.
Forward outlook
- Local home prices are declining (-3.0%/yr); year-one equity from $2k of loan paydown is wiped out by about $8k of value loss. Plan a longer hold.
Negotiation context
- It's been on market 17 days — a 2% lower offer ($256k) is reasonable based on typical stale-listing flexibility.
- 5 sale attempts since 19y ago with the ask held roughly flat each time — persistent listings suggest the price (not the market) is what's stuck; bring a comps-based counter.
Risks & watch-outs
- Watch-outs: built in 1933 — expect roof / HVAC / electrical / plumbing capex.
Questions for the listing agent
- Built in 1933 — when were the roof, HVAC, electrical panel, plumbing, and water heater last replaced?
- Is there a deadline driving the sale (1031 exchange, divorce, estate, relocation)? That informs how much negotiation room exists.
- Schools are D-rated, which usually means shorter tenancies and higher turnover. Who's the typical renter profile here, and what's been the actual vacancy rate?
- What's the average days-on-market for RENTAL listings here right now (not sales)? A rising rental-DOM trend means longer vacancies and softer asking-rent achievability than the comps imply.
- What's the recent tenant-quality profile in this submarket — average credit score on applications, eviction rate, late-payment / NSF rate, and stable-employment percentage? A property-management company in the area should have these aggregated.
- How much new apartment / multifamily construction is in the pipeline within 1–3 miles? Heavy new supply (>2% of stock underway) typically softens rents 12–24 months out; light construction supports rent growth.
Investment metrics
- 1% rule
- 1.08% ✓
- Cap rate
- 8.20%
- Cash-on-cash
- 6.82%
- DSCR
- 1.30
- GRM
- 7.7
CMA / ARV
No comps found within radius.
Projected returns pro-forma
-3.0% appreciation · 3.0% rent growth · sell at horizon
- IRR
- -5.8%
- Equity multiple
- 0.78×
- Total profit
- $-15,735
- Equity at exit
- $38,752
- IRR
- 3.8%
- Equity multiple
- 1.28×
- Total profit
- $20,383
- Equity at exit
- $22,471
Cash invested: $72,772 (down + closing). Projections, not guarantees.
Landlord ↔ Tenant lean methodology
- Overall (STATE)
- 83 Strongly Landlord-Friendly
- State Kentucky
- 83 Strongly Landlord-Friendly · R+16
- County
- — inherits STATE
- City
- — inherits STATE
ZIP-level market 40361
- Home prices YoY
- -23.1%
- Active inventory
- 128
- Price-to-rent
- 23.2×
Monthly cashflow live
- Estimated rent
- $2,797 medium interval (Pro) →
- Mortgage (P&I)
- −$1,363
- Tax est. 1.5%
- −$325 /mo · $3,898/yr
- Insurance
- −$108
- HOA
- −$0
- Vacancy / Maint / Mgmt
- −$587
- Net cashflow
- $414
Break-even live
Sensitivity live
| Price | -10% $593 | -5% $503 | +0% $414 | +5% $324 | +10% $234 |
|---|---|---|---|---|---|
| Rent | -10% $193 | -5% $303 | +0% $414 | +5% $524 | +10% $634 |
| Rate | -1.0pp $544 | -0.5pp $480 | base $414 | +0.5pp $346 | +1.0pp $278 |
3-unit breakdown (identical units grouped — click to expand)
| Units | Beds | Baths | Est. rent |
|---|---|---|---|
| 3× units | 1 | 1 | $2,796 |
| #1 | 1 | 1 | $932 |
| #2 | 1 | 1 | $932 |
| #3 | 1 | 1 | $932 |
| Total (3 units) | $2,797 | ||
UW: 25.0% down · 7.5% · 30yr · 1.5% tax · 5.0% vac · 8.0% maint · 8.0% mgmt
Financing live
Cash to close
- Down payment
- $64,975
- Closing costs
- $7,797
- Reserves months
- —
- Total cash needed
- —
Loan-product check · same deal, 3 products live
Conventional
25% down · 7.5% · 30yr
- Down + closing
- —
- Monthly P&I
- —
- Monthly cashflow
- —
- DSCR
- —
- Eligible?
- —
Personal DTI + credit; lowest rate.
DSCR
20% down · 8.5% · 30yr
- Down + closing
- —
- Monthly P&I
- —
- Monthly cashflow
- —
- DSCR
- —
- Eligible?
- —
No personal income docs; deal must DSCR.
Hard money
10% down · 12.0% · 12mo
- Down + closing
- —
- Monthly P&I
- —
- Monthly cashflow
- —
- DSCR
- —
- Eligible?
- —
Short-term bridge; refi at stabilization.
Listing history 12 events
-
2026-06-22days on market $259,900 Active 17 DOM
-
2026-06-18days on market $259,900 Active 14 DOM
-
2026-06-17days on market $259,900 Active 13 DOM
-
2026-06-16days on market $259,900 Active 12 DOM
-
2026-06-15days on market $259,900 Active 11 DOM
-
2026-06-14days on market $259,900 Active 9 DOM
-
2026-06-13days on market $259,900 Active 8 DOM
-
2026-06-10days on market $259,900 Active 6 DOM
-
2026-06-09days on market $259,900 Active 5 DOM
-
2026-06-08days on market $259,900 Active 4 DOM
-
2026-06-07remarks 369-char remark
-
2026-06-07$259,900 Active 3 DOM
ⓘ Source: listings_history table (triggers on properties + properties_extension) + one-shot
backfill from property_details.listing_events for pre-trigger history.
Climate risk First Street
- Flood 1/10 Low FEMA zone X (unshaded) · 0% chance over 30 yrs
- Wildfire 1/10 Low
- Heat 4/10 Moderate 7 d/yr ≥102°F today · 19 d/yr by 30 yrs out
- Wind 2/10 Low 2% chance of damaging wind over 30 yrs
- Air quality 2/10 Low 1 unhealthy d/yr today · 1 by 30 yrs out
Nearby sold comps map
Loading sold comps map…
Walkable amenities ~0.75 mi
Loading nearby amenities…
Taxation est. · year 1
- Rental income
- $33,564
- − Mortgage interest
- −$14,558
- − Property taxes
- −$3,898
- − Insurance
- −$1,300
- − Repairs & maintenance
- −$2,685
- − Management
- −$2,685
- − Depreciation
- −$7,561
- Taxable income
- $877
- Est. tax owed @ 24.0%
- −$210
- After-tax cash flow
- $4,752/yr
For passive investors: Depreciation is non-cash, so a rental often shows a tax loss while cash-flowing — sheltering income. Rental losses are passive: they offset passive income freely, and up to $25,000/yr can offset ordinary (W-2) income if you actively participate and your MAGI is under $100k (phasing out to $0 by $150k); unused losses carry forward. On sale, claimed depreciation is recaptured at up to 25%, and gains may owe capital-gains tax (a 1031 exchange can defer both). Figures are a year-1 estimate at your 24.0% rate — not tax advice; consult a CPA.
Schools (NCES district)
- District
- Paris Independent
- NCES district ID
- 2104710
- Math proficiency
- 13% ▼ -17.00%
- Reading proficiency
- 29% ▼ -7.00%
- Median HH income
- $34,822
- Composite
- 17.23/100
- National rank
- #9096
- State rank
- #159 of 165 in KY
Livability — Paris
- Score
- 67/100
- State rank
- #218
- US rank
- #10589
Category grades
Schools grade is shown separately in the Schools card above.
Census & demographics
- Census place
- Paris, KY
- County
- Bourbon County · 18,361 people
- City population
- 18,361
- Metro
- Lexington-Fayette, KY
- Population (ZIP)
- 18,361
- Household income
- $63,333
- Rent vs Own
- Severe rent burden
- 509.0
Population outlook (Bourbon County) Hauer SSP2
- Today (2025)
- 20,485 people
- By 2030
- 20,559 · +0.4%
- By 2040
- 20,491 · +0.0%
- By 2050
- 20,065 · -2.1%
- By 2075
- 19,173 · -6.4%
- By 2100
- 16,646 · -18.7%
Race, ethnicity, and origin ACS 2023
- Neighborhood character
- Predominantly White (83%)
- Race & ethnicity
- White 83% Hispanic / Latino 8% Two or more races 6% Black 5%
- Hispanic origin (detail)
- Mexican 6% Cuban 1%
- Common ancestry
- Slovak 2% Serbian 2% Iranian 2%
- Foreign-born
- 4% · Canada, Dominican Republic
- Languages at home
- 94% English-only · Spanish 5% French/Haitian/Cajun 1%
Political lean MEDSL · Bourbon
- 2024 margin
- Solid R (+33.5) · D 32.4% · R 65.9% · Other 1.7%
- 2008→2024 swing
- -16.3pp toward R · 2008: -17.2pp · 2024: -33.5pp
- All cycles
- 2024: R+33.5 2020: R+30.0 2016: R+31.6 2012: R+20.4 2008: R+17.2
Not yet ingested
- Civics
- —
Market trends
- HPI YoY
- ▼ -72.90%
- Current HPI
- 241.9393
- Rent YoY
- —
- Metro
- Lexington-Fayette, KY
- State GDP YoY
- ▲ 1.81%
- F500 in state
- 4
Industry mix (Fortune 500 HQ in KY)
| Industry | F500 HQs | Revenue |
|---|---|---|
| Healthcare | 1 | $118B |
|
||
| Food / Beverage | 1 | $7B |
|
||
Price history
+101.5% since first listed9 events — show timeline
- 2026-06-03 Listed $259,900 ImagineMLS
- 2018-10-07 Listing Removed — ImagineMLS
- 2018-09-07 Relisted — ImagineMLS
- 2018-08-18 Pending — ImagineMLS
- 2018-07-21 Listed $109,000 ImagineMLS
- 2014-10-21 Listing Removed — ImagineMLS
- 2014-04-21 Listed $99,900 ImagineMLS
- 2007-08-03 Listing Removed — ImagineMLS
- 2007-04-24 Listed $129,000 ImagineMLS
Cash-flow waterfall
monthlySold comps — $/sqft
last 12 mo · ≤1 miLoading sold comps…