 Duplex
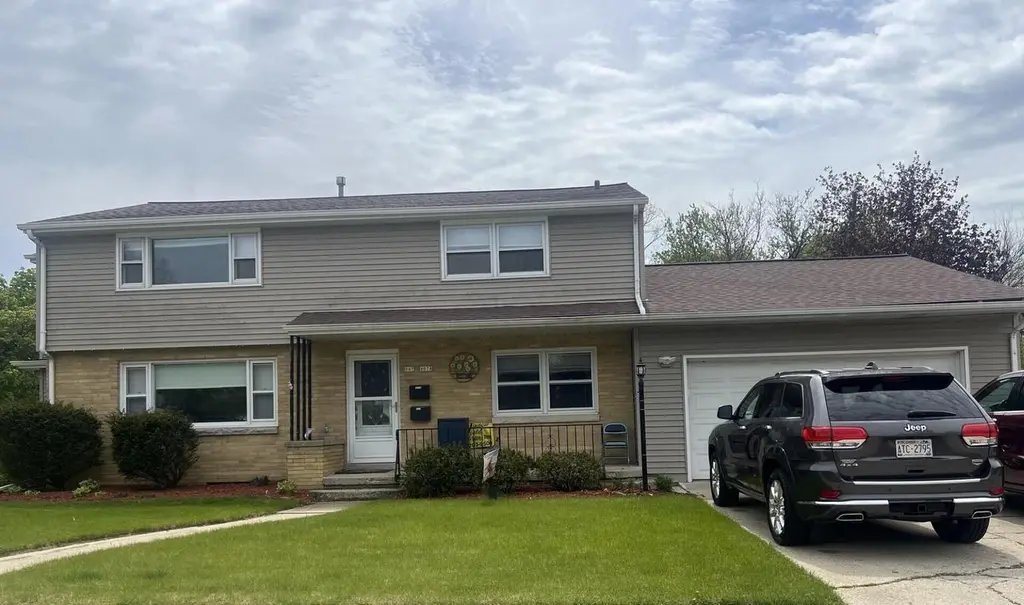
907 High St Unit 907A · West Bend, WI
Flood risk 1/10 · Minimal
- FEMA flood zone
- X (unshaded)
- Chance of flooding over 30 yrs
- 0.0%
- Est. flood insurance / yr
- $473 – $860
Fire risk 1/10 · Minimal
- Est. fire insurance / yr
- $636 – $1,182
Heat risk 2/10 · Minimal
- Hot days now (above 98°F)
- 7 days/yr
- Hot days in 30 yrs
- 13 days/yr
Wind risk 2/10 · Minimal
- Chance of severe wind over 30 yrs
- —
Air-quality risk 3/10 · Minor
- Unhealthy air days now
- 2 days/yr
- Unhealthy air days in 30 yrs
- 3 days/yr
Risk factors via First Street. Map © Google.
Why this score? — see what drove the D+ grade
The composite is a weighted blend of 9 inputs, each scored 0–100. Each bar is that input's sub-score; the figure is the points it added to the 100-point composite (weight × sub-score).
- Cash flow +20.2/30.0
- DSCR +6.4/10.0
- 1% rule +5.3/10.0
- Schools +4.1/10.0
- Livability +4.0/5.0
- Condition / age +2.8/5.0
- Rent growth +2.5/5.0
- ARV discount +2.4/15.0
- Appreciation +0.0/10.0
$375,000
🖨 Deal sheet (PDF) 📄 Offer letter ✓ Due diligence
Multi-family units
County records classify this as Multi-Family (2-4 Unit). Listing-text estimate: 2 units. confirmed
Listing remarks
Coming Soon sprawling duplex just a quick walk from Regner Park.
Key facts
- Sprawling duplex
- 9,147 sq ft lot
- 2 garage spots
Tags
Neighborhood map
What this means for you Summary
Snapshot
- This is a 2 × 2-bed/1.0-bath units multifamily listed at $375k. Condition is rated average.
Deal economics
- At list price, monthly cash flow is $471 ($6k/yr) — positive. Per door: $236/mo.
- The deal already cash-flows at list — no discount required.
- Meets the 1% rule at list price ($4k rent vs $375k).
- Cap rate 7.8% vs local median 2.4% in West Bend — top-decile yield for the area; either an underpriced asset or a hidden risk that comps aren't pricing in. Stress-test before assuming the spread holds.
Location & tenants
- Location reads 79/100 on livability (#80 in WI, #2,147 nationally) — a middle-class / working-renter tenant base. Strengths: cost of living A+, housing A+, health & safety A+; Watch: amenities D+, commute F.
- West Bend School District (suburban): math 50% / reading 43% proficiency, ranked #73 of 342 in WI (top 21%) — families likely to look elsewhere, expect single-tenant / working-renter base with shorter leases.
- Zoned schools: Green Tree Elementary (math 42% / reading 32%, grade F, #562 of 1,041 statewide, top 58%, 379 students, 45% FRL); Badger Middle (math 47% / reading 43%, grade D, #92 of 383 statewide, top 24%, 851 students, 32% FRL); West High (math 34% / reading 38%, grade F, #138 of 483 statewide, top 29%, 1,075 students, 28% FRL).
- Market conditions: 52 active listings in the ZIP; 1 comparable units currently listed for rent nearby; 453 units permitted in Washington County in 2024 (105 in 5+ unit buildings).
Forward outlook
- Local home prices are declining (-3.0%/yr); year-one equity from $3k of loan paydown is wiped out by about $11k of value loss. Plan a longer hold.
- Washington County population projected to shrink 5% by 2050 — rents likely to lag national; underwrite the cash flow, not the appreciation.
Negotiation context
- Only 11 days on market — expect competitive offers; lowballing is unlikely to land.
Risks & watch-outs
- Watch-outs: built in 1953 — expect roof / HVAC / electrical / plumbing capex.
Questions for the listing agent
- Can we see the unit-by-unit rent roll, current vacancy, and any below-market leases? What's the average tenancy length?
- What capital expenditures (roof, boiler, parking lot, exteriors) have been made in the last 5 years, and what's planned in the next 2?
- Built in 1953 — when were the roof, HVAC, electrical panel, plumbing, and water heater last replaced?
- Is there a deadline driving the sale (1031 exchange, divorce, estate, relocation)? That informs how much negotiation room exists.
- Schools are B-rated — typically a magnet for longer-tenancy family renters. What's the average tenant stay here, and is there a school-zone premium baked into asking?
- The area grade is low — what's the realistic commute time and amenity access for the typical tenant pool here? Any planned neighborhood developments (good or bad) we should know about?
- What's the average days-on-market for RENTAL listings here right now (not sales)? A rising rental-DOM trend means longer vacancies and softer asking-rent achievability than the comps imply.
- What's the recent tenant-quality profile in this submarket — average credit score on applications, eviction rate, late-payment / NSF rate, and stable-employment percentage? A property-management company in the area should have these aggregated.
- How much new apartment / multifamily construction is in the pipeline within 1–3 miles? Heavy new supply (>2% of stock underway) typically softens rents 12–24 months out; light construction supports rent growth.
Investment metrics
- 1% rule
- 1.03% ✓
- Cap rate
- 7.80%
- Cash-on-cash
- 5.39%
- DSCR
- 1.24
- GRM
- 8.1
CMA / ARV
- ARV (on-the-fly)
- $336,528
- Comps found
- 3
Show comp detail 3 sales within ~0.75 mi
| Address | Dist | Beds/Ba | Sqft | Sold | Price | $/sf | Match |
|---|---|---|---|---|---|---|---|
| 1510 Monroe St #1512 | 0.35mi | 4/3.0 | 1,910 (-3%) | 1mo | $320,000 | $168 | 74 |
| 245 N 8th Ave | 0.69mi | 4/2.0 | 1,840 (-6%) | 13mo | $320,000 | $174 | 46 |
| 1909 Salisbury Rd #1911 | 0.73mi | 4/2.0 | 1,696 (-14%) | 1mo | $290,000 | $171 | 42 |
Match score weights: distance 35% · size 25% · config 20% · recency 20%. Top-matched comps best support the ARV.
Projected returns pro-forma
-3.0% appreciation · 3.0% rent growth · sell at horizon
- IRR
- -7.9%
- Equity multiple
- 0.71×
- Total profit
- $-30,691
- Equity at exit
- $55,914
- IRR
- 1.6%
- Equity multiple
- 1.12×
- Total profit
- $12,164
- Equity at exit
- $32,423
Cash invested: $105,000 (down + closing). Projections, not guarantees.
Landlord ↔ Tenant lean methodology
- Overall (STATE)
- 73 Landlord-Friendly
- State Wisconsin
- 73 Landlord-Friendly · R+2
- County
- — inherits STATE
- City
- — inherits STATE
ZIP-level market 53090
- Active inventory
- 52
- Price-to-rent
- 16.1×
Monthly cashflow live
- Estimated rent
- $3,877 high interval (Pro) →
- Mortgage (P&I)
- −$1,967
- Tax est. 1.5%
- −$469 /mo · $5,625/yr
- Insurance
- −$156
- HOA
- −$0
- Vacancy / Maint / Mgmt
- −$814
- Net cashflow
- $471
Break-even live
Sensitivity live
| Price | -10% $730 | -5% $601 | +0% $471 | +5% $342 | +10% $212 |
|---|---|---|---|---|---|
| Rent | -10% $165 | -5% $318 | +0% $471 | +5% $624 | +10% $778 |
| Rate | -1.0pp $660 | -0.5pp $567 | base $471 | +0.5pp $374 | +1.0pp $275 |
2-unit breakdown (identical units grouped — click to expand)
| Units | Beds | Baths | Est. rent |
|---|---|---|---|
| 2× units | 2 | 1 | $3,876 |
| #1 | 2 | 1 | $1,938 |
| #2 | 2 | 1 | $1,938 |
| Total (2 units) | $3,877 | ||
UW: 25.0% down · 7.5% · 30yr · 1.5% tax · 5.0% vac · 8.0% maint · 8.0% mgmt
Financing live
Cash to close
- Down payment
- $93,750
- Closing costs
- $11,250
- Reserves months
- —
- Total cash needed
- —
Loan-product check · same deal, 3 products live
Conventional
25% down · 7.5% · 30yr
- Down + closing
- —
- Monthly P&I
- —
- Monthly cashflow
- —
- DSCR
- —
- Eligible?
- —
Personal DTI + credit; lowest rate.
DSCR
20% down · 8.5% · 30yr
- Down + closing
- —
- Monthly P&I
- —
- Monthly cashflow
- —
- DSCR
- —
- Eligible?
- —
No personal income docs; deal must DSCR.
Hard money
10% down · 12.0% · 12mo
- Down + closing
- —
- Monthly P&I
- —
- Monthly cashflow
- —
- DSCR
- —
- Eligible?
- —
Short-term bridge; refi at stabilization.
Rent comps 1 comps
| Address | Beds | Baths | Sqft | Rent | $/sqft | DOM | Units | Dist |
|---|---|---|---|---|---|---|---|---|
| 433 N Main St West Bend, WI | 3.0 | 1.0–2.5 | 1097 | $2,895 | $2.64 | 3d | 36 | 0.59mi |
Listing history 7 events
-
2026-06-21days on market $375,000 Coming Soon 11 DOM
-
2026-06-18days on market $375,000 Coming Soon 8 DOM
-
2026-06-17days on market $375,000 Coming Soon 7 DOM
-
2026-06-16days on market $375,000 Coming Soon 6 DOM
-
2026-06-15days on market $375,000 Coming Soon 5 DOM
-
2026-06-13remarks 64-char remark
-
2026-06-13$375,000 Coming Soon 3 DOM
ⓘ Source: listings_history table (triggers on properties + properties_extension) + one-shot
backfill from property_details.listing_events for pre-trigger history.
Climate risk First Street
- Flood 1/10 Low FEMA zone X (unshaded) · 0% chance over 30 yrs
- Wildfire 1/10 Low
- Heat 2/10 Low 7 d/yr ≥98°F today · 13 d/yr by 30 yrs out
- Wind 2/10 Low
- Air quality 3/10 Moderate 2 unhealthy d/yr today · 3 by 30 yrs out
Nearby sold comps map
Loading sold comps map…
Walkable amenities ~0.75 mi
Loading nearby amenities…
Taxation est. · year 1
- Rental income
- $46,524
- − Mortgage interest
- −$21,006
- − Property taxes
- −$5,625
- − Insurance
- −$1,875
- − Repairs & maintenance
- −$3,722
- − Management
- −$3,722
- − Depreciation
- −$10,909
- Taxable loss
- −$335
- Est. tax savings @ 24.0%
- +$80
- After-tax cash flow
- $5,736/yr
For passive investors: Depreciation is non-cash, so a rental often shows a tax loss while cash-flowing — sheltering income. Rental losses are passive: they offset passive income freely, and up to $25,000/yr can offset ordinary (W-2) income if you actively participate and your MAGI is under $100k (phasing out to $0 by $150k); unused losses carry forward. On sale, claimed depreciation is recaptured at up to 25%, and gains may owe capital-gains tax (a 1031 exchange can defer both). Figures are a year-1 estimate at your 24.0% rate — not tax advice; consult a CPA.
Condition & rehab AI · 1 photo
A well-maintained, average condition multi-family home with cosmetic updates needed to enhance its resale and rental value.
Repairs flagged
- Major interior walls/paint — Paint appears worn in some areas
- Major interior walls/paint — Paint appears worn in some areas
Value-add opportunities
- Both paint interior walls — Fresh paint can improve the home's appearance and appeal to buyers
- Both update flooring — Fresh flooring can improve the home's appearance and appeal to buyers
- Both update bathrooms — Fresh bathrooms can improve the home's appearance and appeal to buyers
Renovation cost estimate screening
| Repair item | Severity | Est. cost |
|---|---|---|
| interior walls/paint · Paint appears worn in some areas | Major | $15,000–50,000 |
| interior walls/paint · Paint appears worn in some areas | Major | $15,000–50,000 |
| Total estimated repair cost · 2 items | $30,000–100,000 |
Value-add ROI direction
- Both paint interior walls — Fresh paint can improve the home's appearance and appeal to buyers ↑
- Both update flooring — Fresh flooring can improve the home's appearance and appeal to buyers ↑
- Both update bathrooms — Fresh bathrooms can improve the home's appearance and appeal to buyers ↑
ⓘ Cost ranges are severity-bucket heuristics (US national rule-of-thumb). Get contractor quotes + a written scope before underwriting a rehab budget.
Schools (NCES district)
- District
- West Bend School District
- NCES district ID
- 5516290
- Math proficiency
- 50% ▼ -4.00%
- Reading proficiency
- 43% ▼ -5.00%
- Median HH income
- $59,641
- Composite
- 40.84/100
- National rank
- #3630
- State rank
- #73 of 342 in WI
Livability — West Bend
- Score
- 79/100
- State rank
- #80
- US rank
- #2147
Category grades
Schools grade is shown separately in the Schools card above.
Census & demographics
- Census place
- West Bend, WI
- City population
- 27,817
- Population (ZIP)
- 21,889
Population outlook (Washington County) Hauer SSP2
- Today (2025)
- 137,678 people
- By 2030
- 138,441 · +0.6%
- By 2040
- 137,047 · -0.5%
- By 2050
- 130,918 · -4.9%
- By 2075
- 115,447 · -16.1%
- By 2100
- 93,069 · -32.4%
Race, ethnicity, and origin ACS 2023
- Neighborhood character
- Predominantly White (92%)
- Race & ethnicity
- White 92% Two or more races 4% Hispanic / Latino 3% Black 1%
- Common ancestry
- Romanian 10% Portuguese 3% Lithuanian 3%
- Foreign-born
- 2% · Canada
- Languages at home
- 97% English-only · Spanish 2%
Political lean MEDSL · Washington
- 2024 margin
- Solid R (+36.3) · D 31.3% · R 67.6% · Other 1.2%
- 2008→2024 swing
- -6.7pp toward R · 2008: -29.6pp · 2024: -36.3pp
- All cycles
- 2024: R+36.3 2020: R+38.1 2016: R+40.5 2012: R+40.2 2008: R+29.6
Not yet ingested
- Civics
- —
Market trends
- HPI YoY
- ▼ -170.72%
- Current HPI
- 176.9746
- Rent YoY
- —
- Metro
- —
- State GDP YoY
- ▲ 2.10%
- F500 in state
- 20
Industry mix (Fortune 500 HQ in WI)
| Industry | F500 HQs | Revenue |
|---|---|---|
| Industrial Machinery | 4 | $23B |
|
||
| Industrial Technology | 2 | $36B |
|
||
| Insurance | 1 | $36B |
|
||
| Professional Services | 1 | $19B |
|
||
| Utilities | 1 | $9B |
|
||
| Consumer Goods | 1 | $3B |
|
||
Price history
1 event — show timeline
- 2026-06-10 Coming Soon $375,000 METROMLS
Cash-flow waterfall
monthlySold comps — $/sqft
last 12 mo · ≤1 miLoading sold comps…