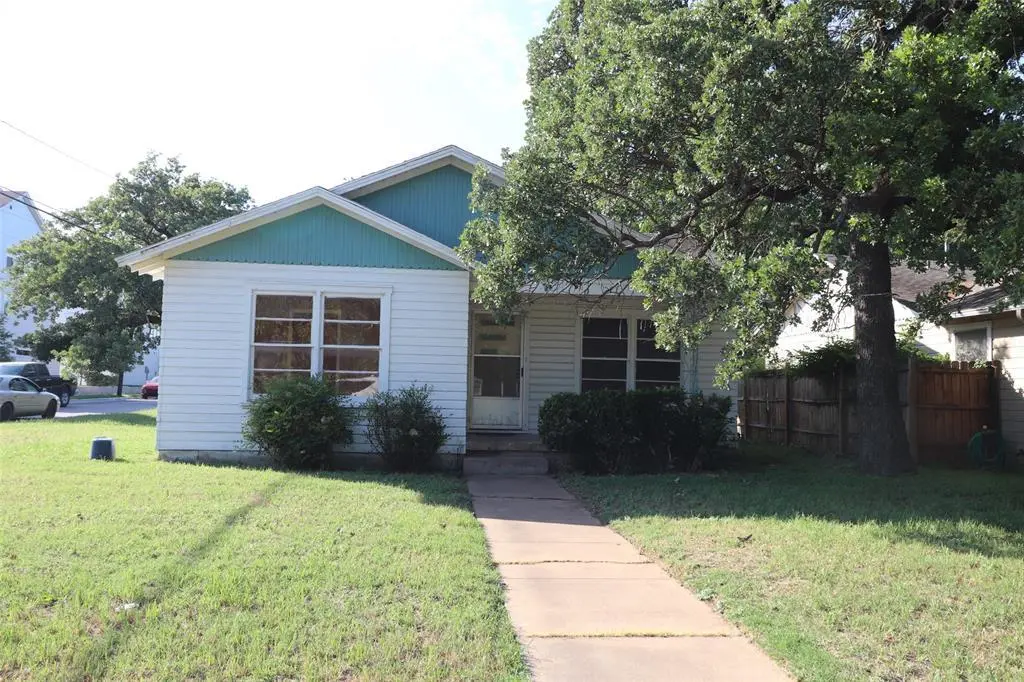
431 W Collins St · Stephenville, TX
Flood risk 1/10 · Minimal
- FEMA flood zone
- X (unshaded)
- Chance of flooding over 30 yrs
- 0.0%
- Est. flood insurance / yr
- $507 – $1,088
Fire risk 7/10 · Major
- Est. fire insurance / yr
- $1,222 – $2,270
Heat risk 7/10 · Major
- Hot days now (above 105°F)
- 7 days/yr
- Hot days in 30 yrs
- 22 days/yr
Wind risk 6/10 · Moderate
- Chance of severe wind over 30 yrs
- 27.0%
Air-quality risk 1/10 · Minimal
- Unhealthy air days now
- 0 days/yr
- Unhealthy air days in 30 yrs
- 0 days/yr
Risk factors via First Street. Map © Google.
Why this score? — see what drove the B+ grade
The composite is a weighted blend of 9 inputs, each scored 0–100. Each bar is that input's sub-score; the figure is the points it added to the 100-point composite (weight × sub-score).
- Cash flow +29.2/30.0
- ARV discount +15.0/15.0
- DSCR +10.0/10.0
- 1% rule +9.3/10.0
- Schools +4.2/10.0
- Livability +3.8/5.0
- Rent growth +2.5/5.0
- Condition / age +2.5/5.0
- Appreciation +0.0/10.0
$98,500
🖨 Deal sheet (PDF) 📄 Offer letter ✓ Due diligence
Listing remarks
Nestled on a spacious corner lot with mature shade trees, this charming 2-bedroom, 1-bath wood frame home offers comfort, convenience, and a prime location near Tarleton State University. Inside, you’ll find a welcoming layout featuring an eat-in kitchen with a center island, ideal for casual dining and entertaining. The home has high-speed internet available, making it perfect for students, professionals, or remote work. Hardwood floors can be seen in one of the bedroom closets and may be under the carpet in both bedrooms. This home is a perfect opportunity for a rental investment. Practical updates and amenities include an electric range, refrigerator, gas water heater, and a full-s
Key facts
- High-speed internet
- Eat-in kitchen
- Mature shade trees
Tags
Property features AI
Finance
- Financial info: Accepts cash and conventional financing; No second mortgage reported
- HOA & community: No association
Exterior
- Parking: Attached garage (1-car) with 2-car single door configuration; Garage faces side; Covered parking (1); On-street parking available; Carport spaces: 0; Garage dimensions approximately 13' wide by 21' deep; Kitchen-level garage entry
- Utilities: City water with individual water meter; City sewer; Electricity connected; Curbs
- Home design: Single-family residence; One story; Residential property
- Construction: Built in 1950 (preowned); Wood construction; Composition roof
- Exterior features: Front porch; Corner lot with few trees; No fencing
Interior
- Kitchen: Electric range; Refrigerator; Eat-in layout with kitchen island and built-in cabinets; Room for freezer
- Bedrooms: 2 bedrooms (both on the main level)
- Flooring: Carpet; Linoleum
- Bathrooms: 1 full bathroom (main level) with built-in cabinets, linen closet and medicine cabinet
- Heating & cooling: Window unit(s) cooling; Gas water heater
- Interior features: Eat-in kitchen with a kitchen island; High-speed internet available; 6 total rooms; 1 living area; 1 dining area; Kitchen island; Built-in cabinets in kitchen and bath; Linen closet and medicine cabinet in bathroom
- Laundry & utility: Full-size washer/dryer area; Washer hookup and electric dryer hookup; Separate utility room with space for freezer
Neighborhood map
What this means for you Summary
Snapshot
- This is a 2-bed/1.0-bath single-family listed at $98k.
Deal economics
- At list price, monthly cash flow is $344 ($4k/yr) — positive.
- The deal already cash-flows at list — no discount required.
- Meets the 1% rule at list price ($1k rent vs $98k).
- Cap rate 10.5% vs local median 2.3% in Stephenville — top-decile yield for the area; either an underpriced asset or a hidden risk that comps aren't pricing in. Stress-test before assuming the spread holds.
Location & tenants
- Location reads 75/100 on livability (#124 in TX, #3,840 nationally) — a middle-class / working-renter tenant base. Strengths: cost of living A+, housing A+, health & safety A+; Watch: commute F, employment D-.
- Stephenville ISD (town): math 53% / reading 48% proficiency, ranked #191 of 826 in TX (top 23%) — acceptable for families but not a draw, mixed tenant base, ~2y average lease.
- Zoned schools: Hook El (math 61% / reading 46%, grade C, #686 of 4,322 statewide, top 16%, 569 students, 53% FRL); Henderson J H (math 60% / reading 50%, grade B-, #248 of 1,662 statewide, top 15%, 551 students, 48% FRL); Stephenville H S (math 45% / reading 56%, grade D+, #492 of 1,632 statewide, top 30%, 1,127 students, 45% FRL).
- Market conditions: Rents flat; 384 active listings in the ZIP; 16 comparable units currently listed for rent nearby; rentals lingering (median 46d on market — plan ~5-8 weeks vacancy on turnover, expect pricing pressure); 100% of comp listings sitting > 30 days — soft ceiling on asking rent; 110 units permitted in Erath County in 2024 (61 in 5+ unit buildings).
Forward outlook
- Local home prices are declining (-3.0%/yr); year-one equity from $681 of loan paydown is wiped out by about $3k of value loss. Plan a longer hold.
- Erath County population projected at +55% by 2050 — long-run rental-demand tailwind backs the buy-and-hold thesis.
Negotiation context
- Only 2 days on market — expect competitive offers; lowballing is unlikely to land.
Risks & watch-outs
- Watch-outs: property tax is 2.6% of price; built in 1950 — expect roof / HVAC / electrical / plumbing capex.
- Climate carrying-cost: major wind risk, 27% chance of damaging wind over 30y; major wildfire risk; extreme-heat days projected 7→22/yr by 2055 (HVAC capex compounding) — expect insurance premiums to compound above CPI over the hold.
Questions for the listing agent
- Built in 1950 — when were the roof, HVAC, electrical panel, plumbing, and water heater last replaced?
- Property tax is high relative to price — has the assessment been appealed recently, and will the sale trigger a re-assessment?
- Is there a deadline driving the sale (1031 exchange, divorce, estate, relocation)? That informs how much negotiation room exists.
- What's the average days-on-market for RENTAL listings here right now (not sales)? A rising rental-DOM trend means longer vacancies and softer asking-rent achievability than the comps imply.
- What's the recent tenant-quality profile in this submarket — average credit score on applications, eviction rate, late-payment / NSF rate, and stable-employment percentage? A property-management company in the area should have these aggregated.
- How much new for-sale + rental construction is in the pipeline within 1–3 miles? Heavy new supply typically softens prices + rents 12–24 months out; constrained supply supports both.
Investment metrics
- 1% rule
- 1.43% ✓
- Cap rate
- 10.48%
- Cash-on-cash
- 14.96%
- DSCR
- 1.67
- GRM
- 5.8
CMA / ARV
- ARV (on-the-fly)
- $193,550
- Comps found
- 12
Show comp detail 12 sales within ~0.75 mi
| Address | Dist | Beds/Ba | Sqft | Sold | Price | $/sf | Match |
|---|---|---|---|---|---|---|---|
| 431 W Collins St | 0.00mi | 2/1.0 | 1,106 (0%) | 1mo | $98,500 | $89 | 100 |
| 662 N Barton St | 0.07mi | 2/2.0 | 1,052 (-5%) | 1mo | $193,000 | $183 | 84 |
| 990 N Paddock St | 0.22mi | 2/1.0 | 1,052 (-5%) | 0mo | $199,500 | $190 | 81 |
| 859 N Belknap St | 0.19mi | 2/1.0 | 1,168 (+6%) | 1mo | $199,000 | $170 | 81 |
| 950 N Mccart St | 0.29mi | 2/1.0 | 1,043 (-6%) | 5mo | $220,000 | $211 | 73 |
| 965 N Stephens Ave | 0.31mi | 2/1.0 | 986 (-11%) | 2mo | $199,500 | $202 | 66 |
| 863 N Clinton | 0.34mi | 2/1.0 | 988 (-11%) | 1mo | $190,000 | $192 | 66 |
| 1175 N Paddock St | 0.28mi | 2/1.0 | 1,256 (+14%) | 1mo | $215,000 | $171 | 63 |
| 1075 W Pecan St | 0.50mi | 2/1.5 | 1,156 (+4%) | 8mo | $149,500 | $129 | 60 |
| 832 W Long St | 0.58mi | 2/1.0 | 1,146 (+4%) | 8mo | $200,000 | $175 | 60 |
| 835 W Vanderbilt St | 0.24mi | 3/1.5 (+1) | 1,268 (+15%) | 5mo | $125,000 | $99 | 53 |
| 557 W College St | 0.42mi | 2/2.0 | 1,240 (+12%) | 9mo | $208,900 | $168 | 49 |
Match score weights: distance 35% · size 25% · config 20% · recency 20%. Top-matched comps best support the ARV.
Projected returns pro-forma
-3.0% appreciation · 0.07% rent growth · sell at horizon
- IRR
- 1.9%
- Equity multiple
- 1.07×
- Total profit
- $1,974
- Equity at exit
- $14,687
- IRR
- 8.1%
- Equity multiple
- 1.53×
- Total profit
- $14,589
- Equity at exit
- $8,516
Cash invested: $27,580 (down + closing). Projections, not guarantees.
Landlord ↔ Tenant lean methodology
- Overall (STATE)
- 87 Strongly Landlord-Friendly
- State Texas
- 87 Strongly Landlord-Friendly · R+5
- County
- — inherits STATE
- City
- — inherits STATE
ZIP-level market 76401
- Rents YoY
- 0.1%
- Active inventory
- 384
- Price-to-rent
- 5.8×
Monthly cashflow live
- Estimated rent
- $1,411 high interval (Pro) →
- Mortgage (P&I)
- −$517
- Tax from tax record
- −$213 /mo · $2,561/yr
- Insurance
- −$41
- HOA
- −$0
- Lot rent
- −$0
- Vacancy / Maint / Mgmt
- −$296
- Net cashflow
- $344
Break-even live
Sensitivity live
| Price | -10% $400 | -5% $372 | +0% $344 | +5% $316 | +10% $288 |
|---|---|---|---|---|---|
| Rent | -10% $232 | -5% $288 | +0% $344 | +5% $400 | +10% $455 |
| Rate | -1.0pp $393 | -0.5pp $369 | base $344 | +0.5pp $318 | +1.0pp $292 |
UW: 25.0% down · 7.5% · 30yr · 1.5% tax · 5.0% vac · 8.0% maint · 8.0% mgmt
Financing live
Cash to close
- Down payment
- $24,625
- Closing costs
- $2,955
- Reserves months
- —
- Total cash needed
- —
Loan-product check · same deal, 3 products live
Conventional
25% down · 7.5% · 30yr
- Down + closing
- —
- Monthly P&I
- —
- Monthly cashflow
- —
- DSCR
- —
- Eligible?
- —
Personal DTI + credit; lowest rate.
DSCR
20% down · 8.5% · 30yr
- Down + closing
- —
- Monthly P&I
- —
- Monthly cashflow
- —
- DSCR
- —
- Eligible?
- —
No personal income docs; deal must DSCR.
Hard money
10% down · 12.0% · 12mo
- Down + closing
- —
- Monthly P&I
- —
- Monthly cashflow
- —
- DSCR
- —
- Eligible?
- —
Short-term bridge; refi at stabilization.
Rent comps 16 comps
| Address | Beds | Baths | Sqft | Rent | $/sqft | DOM | Units | Dist |
|---|---|---|---|---|---|---|---|---|
| 791 N Clinton St Stephenville, TX | 2.0 | 1.5 | 1160 | $1,800 | $1.55 | 46d | 1 | 0.34mi |
| 731 W Walnut St Stephenville, TX | 2.0 | 1.0 | 828 | $1,100 | $1.33 | 46d | 1 | 0.36mi |
| 1391 N Race Unit C Stephenville, TX | 2.0 | 2.0 | 800 | $1,000 | $1.25 | 46d | 1 | 0.38mi |
| 1026 W Tarleton St Apt 102 Stephenville, TX | 2.0 | 2.0 | 1000 | $1,500 | $1.50 | 46d | 1 | 0.45mi |
| 1713 Bingham St Stephenville, TX | 3.0 | 1.0 | 1218 | $1,750 | $1.44 | 46d | 1 | 0.64mi |
| 290 S McIlhaney St Unit 1102 Stephenville, TX | 3.0 | 3.0 | 1223 | $775 | $0.63 | 46d | 1 | 0.73mi |
| 1361 W McNeill St Stephenville, TX | 3.0 | 1.0 | 1200 | $1,495 | $1.25 | 46d | 1 | 0.82mi |
| 504 S 1st Ave Unit 1 Stephenville, TX | 3.0 | 1.5 | 1100 | $1,250 | $1.14 | 46d | 1 | 0.83mi |
| 1435 W McNeill St Stephenville, TX | 2.0 | 1.0 | 1120 | $1,500 | $1.34 | 46d | 1 | 0.85mi |
| 1321 W Swan St Stephenville, TX | 2.0 | 2.0 | 1000 | $1,100 | $1.10 | 46d | 1 | 0.88mi |
| 561 S Second Ave Stephenville, TX | 3.0 | 3.0 | 1500 | $750 | $0.50 | 46d | 1 | 0.88mi |
| 1000 E Lingleville Rd Stephenville, TX | 1.0–2.0 | 1.0–1.5 | 776 | $1,378 | $1.77 | 46d | 1 | 1.06mi |
| 402 Garrett Ct Stephenville, TX | 3.0 | 3.0 | 1300 | $750 | $0.58 | 46d | 1 | 1.09mi |
| 701 S Lillian St Stephenville, TX | 3.0 | 3.0 | 1375 | $695 | $0.51 | 46d | 1 | 1.12mi |
| 949 S Lillian St Stephenville, TX | 1.0–2.0 | 1.0–1.5 | 709 | $952 | $1.34 | 46d | 19 | 1.20mi |
| 1801 W Lingleville Rd Stephenville, TX | 1.0 | 1.0 | 748 | $990 | $1.32 | 46d | 1 | 1.27mi |
Listing history 5 events
-
2026-05-19status Pending
-
2026-05-17$98,500 Active
-
2000-02-07soldstatus
-
2000-02-07soldstatus
-
1989-06-09soldstatus
ⓘ Source: listings_history table (triggers on properties + properties_extension) + one-shot
backfill from property_details.listing_events for pre-trigger history.
Tax reassessment forecast TX · Resets to sale price
- Current annual tax
- $2,561 · $213/mo
- Projected year-2 tax
- $2,561 · $213/mo
- Expected delta
- $0/yr ($0/mo · 0.0%)
ⓘ Screening estimate from a state-policy table — verify with the county assessor before closing.
Climate risk First Street
- Flood 1/10 Low FEMA zone X (unshaded) · 0% chance over 30 yrs
- Wildfire 7/10 Severe
- Heat 7/10 Severe 7 d/yr ≥105°F today · 22 d/yr by 30 yrs out
- Wind 6/10 Major 27% chance of damaging wind over 30 yrs
- Air quality 1/10 Low 0 unhealthy d/yr today · 0 by 30 yrs out
Nearby sold comps map
Loading sold comps map…
Walkable amenities ~0.75 mi
Loading nearby amenities…
Taxation est. · year 1
- Rental income
- $16,935
- − Mortgage interest
- −$5,518
- − Property taxes
- −$2,561
- − Insurance
- −$492
- − Repairs & maintenance
- −$1,355
- − Management
- −$1,355
- − Depreciation
- −$2,865
- Taxable income
- $2,789
- Est. tax owed @ 24.0%
- −$669
- After-tax cash flow
- $3,457/yr
For passive investors: Depreciation is non-cash, so a rental often shows a tax loss while cash-flowing — sheltering income. Rental losses are passive: they offset passive income freely, and up to $25,000/yr can offset ordinary (W-2) income if you actively participate and your MAGI is under $100k (phasing out to $0 by $150k); unused losses carry forward. On sale, claimed depreciation is recaptured at up to 25%, and gains may owe capital-gains tax (a 1031 exchange can defer both). Figures are a year-1 estimate at your 24.0% rate — not tax advice; consult a CPA.
Schools (NCES district)
- District
- Stephenville ISD
- NCES district ID
- 4841520
- Math proficiency
- 53% ▼ -1.00%
- Reading proficiency
- 48% ▼ -4.00%
- Median HH income
- $39,565
- Composite
- 42.23/100
- National rank
- #3283
- State rank
- #191 of 826 in TX
Livability — Stephenville
- Score
- 75/100
- State rank
- #124
- US rank
- #3840
Category grades
Schools grade is shown separately in the Schools card above.
Census & demographics
- Census place
- Stephenville, TX
- County
- Erath County · 31,375 people
- City population
- 31,375
- Metro
- Stephenville, TX
- Population (ZIP)
- 31,375
- Household income
- $61,210
- Rent vs Own
- Severe rent burden
- 1758.0
Population outlook (Erath County) Hauer SSP2
- Today (2025)
- 50,437 people
- By 2030
- 55,510 · +10.1%
- By 2040
- 66,379 · +31.6%
- By 2050
- 77,981 · +54.6%
- By 2075
- 109,727 · +117.6%
- By 2100
- 132,574 · +162.9%
Race, ethnicity, and origin ACS 2023
- Neighborhood character
- Predominantly White (76%)
- Race & ethnicity
- White 76% Hispanic / Latino 18% Two or more races 8% Black 2% Asian 1%
- Hispanic origin (detail)
- Mexican 15%
- Common ancestry
- Slovak 2% Italian 1% Serbian 1%
- Foreign-born
- 5% · Canada, China
- Languages at home
- 88% English-only · Spanish 10% Chinese 1%
Political lean MEDSL · Erath
- 2024 margin
- Solid R (+68.0) · D 15.7% · R 83.7%
- 2008→2024 swing
- -13.5pp toward R · 2008: -54.5pp · 2024: -68.0pp
- All cycles
- 2024: R+68.0 2020: R+63.9 2016: R+65.5 2012: R+67.1 2008: R+54.5
Not yet ingested
- Civics
- —
Market trends
- HPI YoY
- ▼ -133.71%
- Current HPI
- 234.4986
- Rent YoY
- ▲ 0.07%
- Metro
- Stephenville, TX
- State GDP YoY
- ▲ 3.95%
- F500 in state
- 110
Industry mix (Fortune 500 HQ in TX)
| Industry | F500 HQs | Revenue |
|---|---|---|
| Energy | 16 | $1,198B |
|
||
| Technology | 5 | $198B |
|
||
| Engineering / Construction | 4 | $72B |
|
||
| Energy Services | 3 | $60B |
|
||
| Utilities | 3 | $41B |
|
||
| Healthcare | 2 | $330B |
|
||
Price history
5 events — show timeline
- 2026-05-19 Pending — NTREIS
- 2026-05-17 Listed $98,500 NTREIS
- 2000-02-07 Sold (Public Records) — Public Records
- 2000-02-07 Sold (Public Records) — Public Records
- 1989-06-09 Sold (Public Records) — Public Records
Property tax history
+7.5%/yrLatest (2025): $2,561 · -0.7% YoY. Source: county tax records.
Cash-flow waterfall
monthlySold comps — $/sqft
last 12 mo · ≤1 miLoading sold comps…