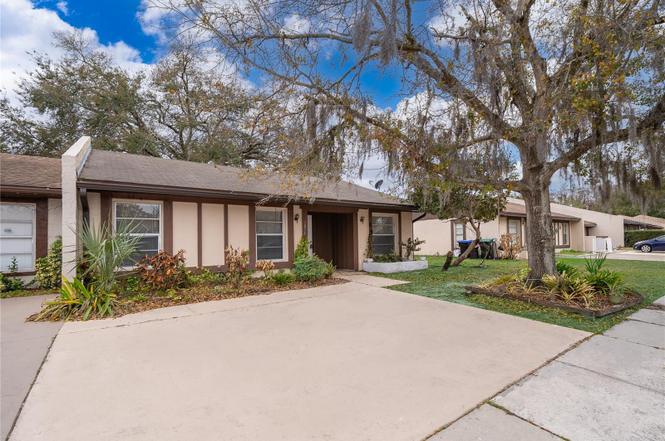
7876 Guardsmen St · Orlando, FL
Flood risk 1/10 · Minimal
- FEMA flood zone
- X (unshaded)
- Chance of flooding over 30 yrs
- 0.0%
- Est. flood insurance / yr
- $507 – $1,088
Fire risk 3/10 · Minor
- Est. fire insurance / yr
- $947 – $1,759
Heat risk 9/10 · Severe
- Hot days now (above 108°F)
- 7 days/yr
- Hot days in 30 yrs
- 22 days/yr
Wind risk 9/10 · Severe
- Chance of severe wind over 30 yrs
- 99.0%
Air-quality risk 2/10 · Minimal
- Unhealthy air days now
- 1 days/yr
- Unhealthy air days in 30 yrs
- 1 days/yr
Risk factors via First Street. Map © Google.
Why this score? — see what drove the D+ grade
The composite is a weighted blend of 9 inputs, each scored 0–100. Each bar is that input's sub-score; the figure is the points it added to the 100-point composite (weight × sub-score).
- ARV discount +15.0/15.0
- Cash flow +12.3/30.0
- Livability +4.3/5.0
- Schools +4.1/10.0
- 1% rule +3.6/10.0
- DSCR +3.6/10.0
- Condition / age +2.5/5.0
- Rent growth +2.3/5.0
- Appreciation +0.0/10.0
$239,000
🖨 Deal sheet 📄 Offer letter ✓ Due diligence
Listing remarks
Under contract-accepting backup offers. SPACIOUS - 3 BEDROOM 2 BATHROOM TOWNHOME - OPEN CONCEPT LIVING - FRESH INTERIOR PAINT - INSIDE LAUNDRY - SCREENED PORCH WITH FRESH FLOOR PAINT OFF LIVING AREA, Perfect for Entertaining Family and Friends - NEW WINDOW BLINDS - NEW VINYL - NEW KITCHEN 2021 - MASTER BEDROOM W/ ENSUITE - SPLIT PLAN FOR PRIVACY - PLENTY OF NATURAL LIGHT - COMMUNITY POOL/TENNIS COURTS/CLUBHOUSE/PLAYGROUND. Conveniently Located - Near Major Highways, Restaurants and Shopping - Enjoy Central Florida's Attractions - Walt Disney World, Universal Studios, SeaWorld and Everything Central Florida Has To Offer! Close to the University of Central Florida - Short Drive to Some of F
Key facts
- Open concept living
- New kitchen
- Community pool
Tags
Property features AI
Finance
- Other:
- Financial info:
- HOA & community: Monthly HOA fee of $53 (includes pool and recreational facilities); Royal Manor Villas Homeowner's Association, Inc.; additional association Artemis Lifestyles/Dewitt Delancy; Pets allowed; Community pool and tennis courts
Exterior
- Parking:
- Security:
- Utilities: Public sewer; Water connected; Electricity connected; Cable available; BB/HS internet available; Phone available
- Home design: Residential townhouse; One story; Faces south
- Construction: Block and stucco construction; Shingle roof; Slab foundation; Built as building number 7876
- Exterior features: Rear porch (screened); Playground; Sidewalk; Sliding doors; Tennis courts
Interior
- Kitchen: Range; Refrigerator; Disposal; Electric water heater
- Bedrooms: 3 bedrooms
- Flooring: Carpet
- Bathrooms: 2 full bathrooms
- Heating & cooling: Central heating (electric); Central air conditioning
- Interior features: Ceiling fans; Window treatments; 11 total rooms
- Laundry & utility: Washer hookup; Electric dryer hookup; Laundry inside
Neighborhood map
What this means for you Summary
Snapshot
- This is a 3-bed/2.0-bath townhouse listed at $239k.
Deal economics
- At list price, monthly cash flow is $-46 ($-549/yr) — negative.
- To cash-flow at today's rent, offer at most $231k (3.4% below list).
- To meet the 1% rule (rent ≥ 1% of price), the offer needs to be $206k (13.8% below list).
- Recommended offer: $206k (13.8% below list) — sets the bar for 1% rule.
- Cap rate 6.1% vs local median 3.0% in Orlando — top-decile yield for the area; either an underpriced asset or a hidden risk that comps aren't pricing in. Stress-test before assuming the spread holds.
Location & tenants
- Location reads 86/100 on livability (#12 in FL, #360 nationally) — a professional / high-income tenant draw. Strengths: amenities A+, commute A+, housing A+.
- Orange (suburban): math 46% / reading 51% proficiency, ranked #43 of 73 in FL (top 59%) — families likely to look elsewhere, expect single-tenant / working-renter base with shorter leases.
- Zoned schools: Pinar Elementary (math 52% / reading 42%, grade D-, #1,191 of 2,144 statewide, top 57%, 377 students, 74% FRL) — zoned schools average 74% FRL vs 56% district-wide (18 pts higher); higher-poverty schools than district average — tighter screening recommended.
- Market conditions: Rents soft (-0.7%/yr); 372 active listings in the ZIP; 40 comparable units currently listed for rent nearby; rentals at typical pace (median 20d on market — plan ~3-4 weeks tenant-placement turnaround); 8,053 units permitted in Orange County in 2024 (3,133 in 5+ unit buildings).
- This rent runs 44% of the median local income ($57k/yr) — at the standard rent-burdened threshold; future hikes will face affordability resistance.
Forward outlook
- Local home prices are declining (-3.0%/yr); year-one equity from $2k of loan paydown is wiped out by about $7k of value loss. Plan a longer hold.
- Orange County population projected at +52% by 2050 — long-run rental-demand tailwind backs the buy-and-hold thesis.
Negotiation context
- It's been on market 93 days — a 9% lower offer ($217k) is reasonable based on typical stale-listing flexibility.
Risks & watch-outs
- Climate carrying-cost: severe wind risk, 99% chance of damaging wind over 30y; extreme-heat days projected 7→22/yr by 2055 (HVAC capex compounding) — expect insurance premiums to compound above CPI over the hold.
Questions for the listing agent
- What do current leases actually rent for vs. the listed asking? Can we see a recent rent roll and the last 12 months of T-12 income?
- It's been on market 93 days. Have you received any prior offers? Is the seller open to a 14% concession, seller financing, or rate buy-down credit?
- What does the HOA fee cover, when was the last increase, and are there any pending special assessments or reserve-fund shortfalls?
- Why hasn't it sold? Are there any deal-killer items the seller is aware of (foundation, flood, title, zoning, code violations)?
- Is there a deadline driving the sale (1031 exchange, divorce, estate, relocation)? That informs how much negotiation room exists.
- Schools are B-rated — typically a magnet for longer-tenancy family renters. What's the average tenant stay here, and is there a school-zone premium baked into asking?
- The area grade is low — what's the realistic commute time and amenity access for the typical tenant pool here? Any planned neighborhood developments (good or bad) we should know about?
- What's the average days-on-market for RENTAL listings here right now (not sales)? A rising rental-DOM trend means longer vacancies and softer asking-rent achievability than the comps imply.
- What's the recent tenant-quality profile in this submarket — average credit score on applications, eviction rate, late-payment / NSF rate, and stable-employment percentage? A property-management company in the area should have these aggregated.
- How much new for-sale + rental construction is in the pipeline within 1–3 miles? Heavy new supply typically softens prices + rents 12–24 months out; constrained supply supports both.
Investment metrics
- 1% rule
- 0.86% ✗
- Cap rate
- 6.06%
- Cash-on-cash
- -0.82%
- DSCR
- 0.96
- GRM
- 9.7
CMA / ARV
- ARV (on-the-fly)
- $291,843
- Comps found
- 3
Show comp detail 3 sales within ~0.75 mi
| Address | Dist | Beds/Ba | Sqft | Sold | Price | $/sf | Match |
|---|---|---|---|---|---|---|---|
| 7845 County Down Ct | 0.11mi | 3/2.0 | 1,109 (-8%) | 6mo | $269,000 | $243 | 77 |
| 3032 Stonecastle Rd | 0.09mi | 3/2.0 | 1,050 (-13%) | 22mo | $295,000 | $281 | 57 |
| 2814 Curry Village Ln | 0.25mi | 3/2.5 | 1,337 (+11%) | 18mo | $320,000 | $239 | 52 |
Match score weights: distance 35% · size 25% · config 20% · recency 20%. Top-matched comps best support the ARV.
Projected returns pro-forma
-3.0% appreciation · 0.0% rent growth · sell at horizon
- IRR
- -21.1%
- Equity multiple
- 0.29×
- Total profit
- $-47,633
- Equity at exit
- $35,636
- IRR
- -23.8%
- Equity multiple
- -0.02×
- Total profit
- $-68,380
- Equity at exit
- $20,664
Cash invested: $66,920 (down + closing). Projections, not guarantees.
Landlord ↔ Tenant lean methodology
- Overall (STATE)
- 87 Strongly Landlord-Friendly
- State Florida
- 87 Strongly Landlord-Friendly · R+3
- County
- — inherits STATE
- City
- — inherits STATE
ZIP-level market 32822
- Home prices YoY
- -21.1%
- Rents YoY
- -0.7%
- Active inventory
- 372
- Price-to-rent
- 9.7×
Monthly cashflow live
- Estimated rent
- $2,060 high interval (Pro) →
- Mortgage (P&I)
- −$1,253
- Tax from tax record
- −$267 /mo · $3,208/yr
- Insurance
- −$100
- HOA
- −$53
- Vacancy / Maint / Mgmt
- −$433
- Net cashflow
- $-46
Break-even live
UW: 25.0% down · 7.5% · 30yr · 1.5% tax · 5.0% vac · 8.0% maint · 8.0% mgmt
Financing live
Cash to close
- Down payment
- $59,750
- Closing costs
- $7,170
- Reserves months
- —
- Total cash needed
- —
Loan-product check · same deal, 3 products live
Conventional
25% down · 7.5% · 30yr
- Down + closing
- —
- Monthly P&I
- —
- Monthly cashflow
- —
- DSCR
- —
- Eligible?
- —
Personal DTI + credit; lowest rate.
DSCR
20% down · 8.5% · 30yr
- Down + closing
- —
- Monthly P&I
- —
- Monthly cashflow
- —
- DSCR
- —
- Eligible?
- —
No personal income docs; deal must DSCR.
Hard money
10% down · 12.0% · 12mo
- Down + closing
- —
- Monthly P&I
- —
- Monthly cashflow
- —
- DSCR
- —
- Eligible?
- —
Short-term bridge; refi at stabilization.
Rent comps 40 comps
| Address | Beds | Baths | Sqft | Rent | $/sqft | DOM | Units | Dist |
|---|---|---|---|---|---|---|---|---|
| 7931 Thrippence Ln Orlando, FL | 3.0 | 2.0 | 1225 | $2,000 | $1.63 | 23d | 1 | 0.07mi |
| 7870 Pine Fork Dr Orlando, FL | 3.0 | 2.0 | 1119 | $2,223 | $1.99 | 21d | 1 | 0.20mi |
| 3228 Curry Woods Cir #2 Orlando, FL | 3.0 | 2.0 | 1447 | $2,321 | $1.60 | 7d | 1 | 0.30mi |
| 2813 Whippet Ct Orlando, FL | 3.0 | 2.0 | 1368 | $2,349 | $1.72 | 3d | 1 | 0.31mi |
| 7305 Marseille Cir Orlando, FL | 3.0 | 2.0 | 1138 | $2,199 | $1.93 | 14d | 1 | 0.42mi |
| 7416 Lago De Oro Unit 2-A-3 Orlando, FL | 3.0 | 2.0 | 1000 | $1,950 | $1.95 | 23d | 1 | 0.43mi |
| 7416 Lago De Oro Unit A-6 Orlando, FL | 3.0 | 2.0 | 1000 | $1,695 | $1.70 | 14d | 1 | 0.45mi |
| 2454 Rio Pinar Lakes Blvd Orlando, FL | 3.0 | 2.5 | 1208 | $1,795 | $1.49 | 20d | 1 | 0.46mi |
| 2454 Rio Pinar Lakes Blvd Orlando, FL | 3.0 | 2.5 | 1336 | $1,795 | $1.34 | 23d | 1 | 0.46mi |
| 7528 Marbella Pointe Dr Orlando, FL | 1.0–4.0 | 1.0–3.0 | 1141 | $1,884 | $1.65 | 2d | 22 | 0.52mi |
| 3049 Jon Jon Ct Orlando, FL | 3.0 | 2.0 | 1050 | $1,995 | $1.90 | 23d | 1 | 0.84mi |
| 7721 Silver Pointe Blvd Orlando, FL | 1.0–3.0 | 1.0–2.0 | 1050 | $1,935 | $1.84 | 2d | 23 | 0.98mi |
| 1974 S Goldenrod Rd Orlando, FL | 2.0 | 2.0 | 1120 | $1,824 | $1.63 | 23d | 1 | 1.03mi |
| 7100 Gateshead Cir Orlando, FL | 1.0–3.0 | 1.0–2.0 | 900 | $2,280 | $2.53 | 1d | 33 | 1.04mi |
| 4233 Anthony Ln Orlando, FL | 3.0 | 1.0 | 1210 | $1,925 | $1.59 | 14d | 1 | 1.08mi |
| 2008 Garwood Dr Orlando, FL | 3.0 | 2.0 | 1137 | $1,995 | $1.75 | 23d | 1 | 1.13mi |
| 3950 Southpointe Dr #418 Orlando, FL | 3.0 | 2.0 | 1226 | $1,985 | $1.62 | 16d | 1 | 1.14mi |
| 3528 Idle Hour Dr Orlando, FL | 3.0 | 2.0 | 1494 | $2,600 | $1.74 | 17d | 1 | 1.16mi |
| 7646 Dione Ct Orlando, FL | 3.0 | 2.0 | 1172 | $2,470 | $2.11 | 23d | 1 | 1.17mi |
| 3638 Southpointe Dr Unit 1 Orlando, FL | 2.0 | 2.0 | 820 | $1,600 | $1.95 | 23d | 1 | 1.19mi |
| 2042 Garwood Dr Orlando, FL | 3.0 | 2.0 | 1152 | $2,110 | $1.83 | 3d | 1 | 1.20mi |
| 3960 Southpointe Dr #533 Orlando, FL | 2.0 | 2.0 | 1045 | $1,800 | $1.72 | 7d | 1 | 1.20mi |
| 3524 Southpointe Dr Bldg 2 Orlando, FL | 2.0 | 2.0 | 820 | $1,575 | $1.92 | 21d | 1 | 1.21mi |
| 3655 Atrium Dr Unit 2 Orlando, FL | 2.0 | 2.0 | 820 | $1,695 | $2.07 | 14d | 1 | 1.24mi |
| 3766 Southpointe Dr Unit U5 Orlando, FL | 2.0 | 2.0 | 820 | $2,049 | $2.50 | 7d | 1 | 1.24mi |
| 6206 Raintree Dr Unit GE Orlando, FL | 2.0 | 2.0 | 1375 | $1,850 | $1.35 | 21d | 1 | 1.24mi |
| 2568 Woodgate Blvd Orlando, FL | 1.0–2.0 | 1.0–2.0 | 790 | $1,500 | $1.90 | 4d | 1 | 1.27mi |
| 1840 Brando Dr Orlando, FL | 3.0 | 2.0 | 1069 | $1,995 | $1.87 | 21d | 1 | 1.28mi |
| 6084 Willowpointe Cir Unit 1501435P Orlando, FL | 2.0 | 2.0 | 904 | $3,483 | $3.85 | 2d | 1 | 1.30mi |
| 3841 Atrium Dr Unit 1271266P Orlando, FL | 2.0 | 2.0 | 818 | $2,468 | $3.02 | 12d | 1 | 1.30mi |
| 3841 Atrium Dr Unit 1564828P Orlando, FL | 2.0 | 2.0 | 818 | $2,505 | $3.06 | 2d | 1 | 1.30mi |
| 4004 Atrium Dr Orlando, FL | 2.0 | 2.0 | 820 | $1,495 | $1.82 | 23d | 1 | 1.31mi |
| 2508 Woodgate Blvd #207 Orlando, FL | 2.0 | 2.0 | 930 | $1,600 | $1.72 | 21d | 1 | 1.34mi |
| 2924 Cottage Grove Ct Unit GE Orlando, FL | 3.0 | 2.0 | 1500 | $2,800 | $1.87 | 23d | 1 | 1.34mi |
| 3217 Westridge Blvd Orlando, FL | 2.0 | 2.0 | 914 | $1,800 | $1.97 | 14d | 1 | 1.36mi |
| 1809 Garwood Dr Orlando, FL | 4.0 | 1.0 | 1380 | $2,750 | $1.99 | 23d | 1 | 1.37mi |
| 3233 Candle Ridge Dr #101 Orlando, FL | 2.0 | 2.0 | 914 | $1,600 | $1.75 | 7d | 1 | 1.38mi |
| 2536 Woodgate Blvd #107 Orlando, FL | 2.0 | 2.0 | 930 | $1,650 | $1.77 | 21d | 1 | 1.42mi |
| 3239 Candle Ridge Dr Orlando, FL | 2.0 | 2.0 | 914 | $2,100 | $2.30 | 23d | 1 | 1.42mi |
| 3912 Atrium Dr Unit L7 Orlando, FL | 2.0 | 2.0 | 820 | $1,700 | $2.07 | 20d | 1 | 1.43mi |
HOA detail
- Monthly dues
- $53 · $636/yr
- Likely covers
- pool
Listing history 4 events
-
2026-05-21status Pending
-
2026-05-13price $239,000
-
2026-03-20price $269,000
-
2026-02-17$285,000 Active
ⓘ Source: listings_history table (triggers on properties + properties_extension) + one-shot
backfill from property_details.listing_events for pre-trigger history.
Tax reassessment forecast FL · Resets to sale price
- Current annual tax
- $3,208 · $267/mo
- Projected year-2 tax
- $3,208 · $267/mo
- Expected delta
- $0/yr ($0/mo · 0.0%)
ⓘ Screening estimate from a state-policy table — verify with the county assessor before closing.
Climate risk First Street
- Flood 1/10 Low FEMA zone X (unshaded) · 0% chance over 30 yrs
- Wildfire 3/10 Moderate
- Heat 9/10 Extreme 7 d/yr ≥108°F today · 22 d/yr by 30 yrs out
- Wind 9/10 Extreme 99% chance of damaging wind over 30 yrs
- Air quality 2/10 Low 1 unhealthy d/yr today · 1 by 30 yrs out
Nearby sold comps map
Loading sold comps map…
Walkable amenities ~0.75 mi
Loading nearby amenities…
Taxation est. · year 1
- Rental income
- $24,723
- − Mortgage interest
- −$13,388
- − Property taxes
- −$3,208
- − Insurance
- −$1,195
- − Repairs & maintenance
- −$1,978
- − Management
- −$1,978
- − HOA
- −$636
- − Depreciation
- −$6,953
- Taxable loss
- −$4,613
- Est. tax savings @ 24.0%
- +$1,107
- After-tax cash flow
- $558/yr
For passive investors: Depreciation is non-cash, so a rental often shows a tax loss while cash-flowing — sheltering income. Rental losses are passive: they offset passive income freely, and up to $25,000/yr can offset ordinary (W-2) income if you actively participate and your MAGI is under $100k (phasing out to $0 by $150k); unused losses carry forward. On sale, claimed depreciation is recaptured at up to 25%, and gains may owe capital-gains tax (a 1031 exchange can defer both). Figures are a year-1 estimate at your 24.0% rate — not tax advice; consult a CPA.
Schools (NCES district)
- District
- Orange
- NCES district ID
- 1201440
- Math proficiency
- 46% ▼ -9.00%
- Reading proficiency
- 51% ▼ -2.00%
- Median HH income
- $49,350
- Composite
- 41.47/100
- National rank
- #3461
- State rank
- #43 of 73 in FL
Livability — Orlando
- Score
- 86/100
- State rank
- #12
- US rank
- #360
Category grades
Schools grade is shown separately in the Schools card above.
Census & demographics
- County
- Orange County · 1,471,359 people
- City population
- 964,969
- Metro
- Orlando-Kissimmee-Sanford, FL
- Population (ZIP)
- 67,081
- Household income
- $56,540
- Rent vs Own
- Severe rent burden
- 4246.0
Population outlook (Orange County) Hauer SSP2
- Today (2025)
- 1,618,226 people
- By 2030
- 1,787,404 · +10.5%
- By 2040
- 2,125,621 · +31.4%
- By 2050
- 2,454,016 · +51.6%
- By 2075
- 3,173,711 · +96.1%
- By 2100
- 3,607,781 · +122.9%
Race, ethnicity, and origin ACS 2023
- Neighborhood character
- Predominantly Hispanic (68%)
- Race & ethnicity
- Hispanic / Latino 68% Two or more races 36% White 17% Black 10% Asian 2%
- Hispanic origin (detail)
- Mexican 2% Puerto Rican 38% Cuban 5% Dominican 5%
- Common ancestry
- Lithuanian 1% Romanian 1% Slovak 1%
- Foreign-born
- 27% · Canada, Jamaica, China
- Languages at home
- 36% English-only · Spanish 60% French/Haitian/Cajun 1% Arabic 1%
Political lean MEDSL · Orange
- 2024 margin
- D (+13.6) · D 56.1% · R 42.5% · Other 1.3%
- 2008→2024 swing
- -5.0pp toward R · 2008: 18.6pp · 2024: 13.6pp
- All cycles
- 2024: D+13.6 2020: D+23.1 2016: D+24.6 2012: D+18.2 2008: D+18.6
Not yet ingested
- Civics
- —
Market trends
- HPI YoY
- ▼ -95.17%
- Current HPI
- 355.5775
- Rent YoY
- ▼ -0.68%
- Metro
- Orlando-Kissimmee-Sanford, FL
- State GDP YoY
- ▲ 3.28%
- F500 in state
- 36
Industry mix (Fortune 500 HQ in FL)
| Industry | F500 HQs | Revenue |
|---|---|---|
| Industrial Technology | 2 | $29B |
|
||
| Insurance | 2 | $17B |
|
||
| Retail | 1 | $60B |
|
||
| Technology Distribution | 1 | $58B |
|
||
| Homebuilding | 1 | $35B |
|
||
| Technology Manufacturing | 1 | $35B |
|
||
Price history
-16.1% since first listed4 events — show timeline
- 2026-05-21 Pending — Stellar MLS as Distributed by MLS Grid
- 2026-05-13 Price Changed $239,000 Stellar MLS as Distributed by MLS Grid
- 2026-03-20 Price Changed $269,000 Stellar MLS as Distributed by MLS Grid
- 2026-02-17 Listed $285,000 Stellar MLS as Distributed by MLS Grid
Property tax history
+9.1%/yrLatest (2025): $3,208 · +7.3% YoY. Source: county tax records.
Cash-flow waterfall
monthlySold comps — $/sqft
last 12 mo · ≤1 miLoading sold comps…