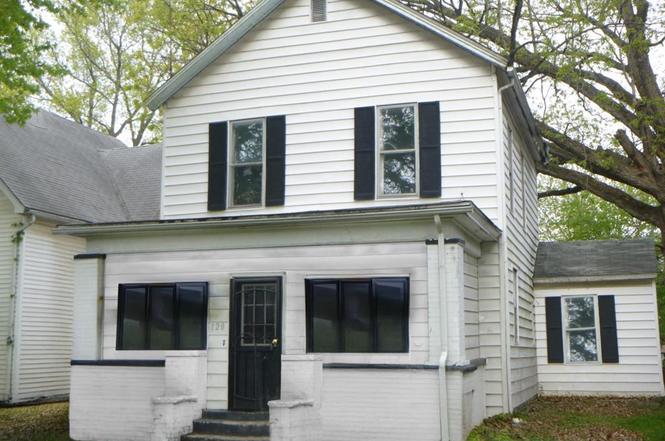
120 N Sycamore St · Centralia, IL
Flood risk 1/10 · Minimal
- FEMA flood zone
- X (unshaded)
- Chance of flooding over 30 yrs
- 0.0%
- Est. flood insurance / yr
- $473 – $860
Fire risk 1/10 · Minimal
- Est. fire insurance / yr
- $804 – $1,492
Heat risk 4/10 · Minor
- Hot days now (above 106°F)
- 7 days/yr
- Hot days in 30 yrs
- 20 days/yr
Wind risk 2/10 · Minimal
- Chance of severe wind over 30 yrs
- 2.0%
Air-quality risk 2/10 · Minimal
- Unhealthy air days now
- 1 days/yr
- Unhealthy air days in 30 yrs
- 1 days/yr
Risk factors via First Street. Map © Google.
Why this score? — see what drove the B+ grade
The composite is a weighted blend of 9 inputs, each scored 0–100. Each bar is that input's sub-score; the figure is the points it added to the 100-point composite (weight × sub-score).
- Cash flow +30.0/30.0
- ARV discount +15.0/15.0
- 1% rule +10.0/10.0
- DSCR +10.0/10.0
- Livability +3.4/5.0
- Rent growth +2.5/5.0
- Condition / age +2.5/5.0
- Schools +2.2/10.0
- Appreciation +0.0/10.0
$49,900
🖨 Deal sheet (PDF) 📄 Offer letter ✓ Due diligence
Listing remarks
Solid 3-bedroom home with a 2-car garage located in a well-maintained Centralia neighborhood. Exterior viewing only—no interior showings or photos available. Offered as a cash-only, as-is sale with no contingencies accepted, making it an excellent opportunity for investors or buyers seeking privacy. Please drive by the property first to ensure interest. Buyer or buyer's agent to verify MLS Info
Key facts
- 6,425 sq ft lot
- 2 garage spots
- Built 1923
Property features AI
Finance
- Other: Seller may consider concessions
Exterior
- Parking: Two-car garage
- Utilities: Public water; Public sewer; Electricity connected
- Home design: Single-family residence; Residential property
- Construction: Vinyl siding
- Exterior features: Level lot
Interior
- Bedrooms: Three bedrooms total with one on the main level and two on the upper level
- Bathrooms: One full bathroom (main/upper level)
- Heating & cooling: Other heating; Other cooling
- Interior features: Two levels; Estimated living area
Neighborhood map
What this means for you Summary
Snapshot
- This is a 3-bed/1.0-bath single-family listed at $50k.
Deal economics
- At list price, monthly cash flow is $236 ($3k/yr) — positive.
- The deal already cash-flows at list — no discount required.
- Meets the 1% rule at list price ($800 rent vs $50k).
- Recommended offer: $44k (12.0% below list) — sets the bar for market timing.
- Cap rate 12.0% vs local median 5.8% in Centralia — top-decile yield for the area; either an underpriced asset or a hidden risk that comps aren't pricing in. Stress-test before assuming the spread holds.
Location & tenants
- Location reads 68/100 on livability (#481 in IL) — a middle-class / working-renter tenant base. Strengths: cost of living A+, housing A+, health & safety A+; Watch: crime F, amenities F, commute F.
- Centralia Hsd 200 (town): math 21% / reading 26% proficiency, ranked #668 of 919 in IL (top 73%) — low school quality limits family demand, transient renter base, plan for 1-2y turnover.
- Zoned schools: Jordan Elem School (math 12% / reading 12%, grade F, #1,403 of 2,056 statewide, top 71%, 221 students, 0% FRL); Centralia Jr High School (math 7% / reading 22%, grade F, #517 of 665 statewide, top 79%, 604 students, 0% FRL); Centralia High School (math 22% / reading 17%, grade F, #397 of 693 statewide, top 61%, 863 students, 0% FRL).
- Market conditions: 107 active listings in the ZIP; 1 comparable units currently listed for rent nearby; 2 units permitted in Marion County in 2024 (0 in 5+ unit buildings).
Forward outlook
- Local home prices are declining (-3.0%/yr); year-one equity from $345 of loan paydown is wiped out by about $1k of value loss. Plan a longer hold.
- Marion County population projected at -20% by 2050 — secular population decline; favor cash flow + early exit over multi-decade hold.
- At projected returns (-3.0% appreciation + 3.0% rent growth), your $14k cash investment doubles in ~6 years — after that, you're playing with house money.
Negotiation context
- It's been on market 219 days — a 12% lower offer ($44k) is reasonable based on typical stale-listing flexibility.
- 4 sale attempts since 20y ago with the ask held roughly flat each time — persistent listings suggest the price (not the market) is what's stuck; bring a comps-based counter.
Risks & watch-outs
- Watch-outs: property tax is 2.7% of price; built in 1923 — expect roof / HVAC / electrical / plumbing capex.
Questions for the listing agent
- It's been on market 219 days. Have you received any prior offers? Is the seller open to a 12% concession, seller financing, or rate buy-down credit?
- Built in 1923 — when were the roof, HVAC, electrical panel, plumbing, and water heater last replaced?
- Property tax is high relative to price — has the assessment been appealed recently, and will the sale trigger a re-assessment?
- Why hasn't it sold? Are there any deal-killer items the seller is aware of (foundation, flood, title, zoning, code violations)?
- Is there a deadline driving the sale (1031 exchange, divorce, estate, relocation)? That informs how much negotiation room exists.
- Schools are D-rated, which usually means shorter tenancies and higher turnover. Who's the typical renter profile here, and what's been the actual vacancy rate?
- Crime grade is F in this area — have there been break-ins, vandalism, or insurance claims at this property in the last 3 years? What carrier currently insures it and at what premium?
- What's the average days-on-market for RENTAL listings here right now (not sales)? A rising rental-DOM trend means longer vacancies and softer asking-rent achievability than the comps imply.
- What's the recent tenant-quality profile in this submarket — average credit score on applications, eviction rate, late-payment / NSF rate, and stable-employment percentage? A property-management company in the area should have these aggregated.
- How much new for-sale + rental construction is in the pipeline within 1–3 miles? Heavy new supply typically softens prices + rents 12–24 months out; constrained supply supports both.
Investment metrics
- 1% rule
- 1.60% ✓
- Cap rate
- 11.97%
- Cash-on-cash
- 20.28%
- DSCR
- 1.90
- GRM
- 5.2
CMA / ARV
- ARV (on-the-fly)
- $88,250
- Comps found
- 12
Show comp detail 12 sales within ~0.75 mi
| Address | Dist | Beds/Ba | Sqft | Sold | Price | $/sf | Match |
|---|---|---|---|---|---|---|---|
| 804 E 4th St E | 0.35mi | 3/1.5 | 2,000 (+13%) | 2mo | $40,000 | $20 | 58 |
| 319 E 7th St | 0.63mi | 4/1.0 (+1) | 1,710 (-3%) | 6mo | $83,500 | $49 | 55 |
| 629 S Maple St | 0.56mi | 3/2.0 | 1,750 (-1%) | 18mo | $66,000 | $38 | 54 |
| 821 E 6th St | 0.57mi | 3/2.5 | 1,917 (+9%) | 1mo | $225,000 | $117 | 52 |
| 420 Linden Ave | 0.50mi | 3/1.5 | 1,595 (-10%) | 15mo | $81,000 | $51 | 46 |
| 610 S Pine St | 0.52mi | 4/2.5 (+1) | 1,858 (+5%) | 15mo | $36,000 | $19 | 43 |
| 617 N Walnut St | 0.64mi | 3/1.0 | 1,533 (-13%) | 6mo | $40,000 | $26 | 43 |
| 1340 E 6th St | 0.75mi | 3/2.0 | 1,578 (-11%) | 1mo | $140,000 | $89 | 43 |
| 1318 E 4th St | 0.71mi | 3/1.5 | 1,587 (-10%) | 11mo | $141,000 | $89 | 38 |
| 6 Charles Dr | 0.63mi | 3/1.5 | 1,500 (-15%) | 6mo | $164,000 | $109 | 38 |
| 714 Cedar St | 0.63mi | 2/1.0 (-1) | 2,020 (+14%) | 5mo | $100,700 | $50 | 37 |
| 226 N Walnut St | 0.55mi | 3/1.5 | 2,010 (+14%) | 18mo | $60,000 | $30 | 34 |
Match score weights: distance 35% · size 25% · config 20% · recency 20%. Top-matched comps best support the ARV.
Projected returns pro-forma
-3.0% appreciation · 3.0% rent growth · sell at horizon
- IRR
- 12.6%
- Equity multiple
- 1.50×
- Total profit
- $6,995
- Equity at exit
- $7,440
- IRR
- 21.5%
- Equity multiple
- 2.83×
- Total profit
- $25,632
- Equity at exit
- $4,314
Cash invested: $13,972 (down + closing). Projections, not guarantees.
Landlord ↔ Tenant lean methodology
- Overall (STATE)
- 43 Moderately Tenant-Leaning
- State Illinois
- 43 Moderately Tenant-Leaning · D+7
- County
- — inherits STATE
- City
- — inherits STATE
ZIP-level market 62801
- Home prices YoY
- -13.9%
- Active inventory
- 107
- Price-to-rent
- 5.2×
Monthly cashflow live
- Estimated rent
- $800 medium interval (Pro) →
- Mortgage (P&I)
- −$262
- Tax from tax record
- −$113 /mo · $1,361/yr
- Insurance
- −$21
- HOA
- −$0
- Vacancy / Maint / Mgmt
- −$168
- Net cashflow
- $236
Break-even live
Sensitivity live
| Price | -10% $264 | -5% $250 | +0% $236 | +5% $222 | +10% $208 |
|---|---|---|---|---|---|
| Rent | -10% $173 | -5% $205 | +0% $236 | +5% $268 | +10% $299 |
| Rate | -1.0pp $261 | -0.5pp $249 | base $236 | +0.5pp $223 | +1.0pp $210 |
UW: 25.0% down · 7.5% · 30yr · 1.5% tax · 5.0% vac · 8.0% maint · 8.0% mgmt
Financing live
Cash to close
- Down payment
- $12,475
- Closing costs
- $1,497
- Reserves months
- —
- Total cash needed
- —
Loan-product check · same deal, 3 products live
Conventional
25% down · 7.5% · 30yr
- Down + closing
- —
- Monthly P&I
- —
- Monthly cashflow
- —
- DSCR
- —
- Eligible?
- —
Personal DTI + credit; lowest rate.
DSCR
20% down · 8.5% · 30yr
- Down + closing
- —
- Monthly P&I
- —
- Monthly cashflow
- —
- DSCR
- —
- Eligible?
- —
No personal income docs; deal must DSCR.
Hard money
10% down · 12.0% · 12mo
- Down + closing
- —
- Monthly P&I
- —
- Monthly cashflow
- —
- DSCR
- —
- Eligible?
- —
Short-term bridge; refi at stabilization.
Rent comps 1 comps
| Address | Beds | Baths | Sqft | Rent | $/sqft | DOM | Units | Dist |
|---|---|---|---|---|---|---|---|---|
| 805 S Hickory St Centralia, IL | 3.0 | 2.0 | 1814 | $800 | $0.44 | 46d | 1 | 0.87mi |
Listing history 29 events
-
2026-06-22days on market $49,900 Active 219 DOM
-
2026-06-21days on market $49,900 Active 218 DOM
-
2026-06-21days on market $49,900 Active 217 DOM
-
2026-06-18days on market $49,900 Active 215 DOM
-
2026-06-17days on market $49,900 Active 214 DOM
-
2026-06-16days on market $49,900 Active 213 DOM
-
2026-06-15days on market $49,900 Active 212 DOM
-
2026-06-13days on market $49,900 Active 210 DOM
-
2026-06-12days on market $49,900 Active 209 DOM
-
2026-06-09days on market $49,900 Active 206 DOM
-
2026-06-08days on market $49,900 Active 205 DOM
-
2026-06-07days on market $49,900 Active 204 DOM
-
2026-06-07days on market $49,900 Active 203 DOM
-
2026-06-04days on market $49,900 Active 200 DOM
-
2026-06-02days on market $49,900 Active 199 DOM
-
2026-06-01days on market $49,900 Active 198 DOM
-
2026-05-31days on market $49,900 Active 197 DOM
-
2026-05-31days on market $49,900 Active 196 DOM
-
2026-04-16status Active
-
2026-04-04historical Active Under Contract
-
2025-11-15$49,900 Active
-
2021-08-06historical
-
2021-08-06historical
-
2007-03-02soldstatus
-
2007-03-02soldstatus
-
2006-10-01$34,500
-
2006-10-01$34,500
-
2006-09-12historical
-
2003-04-21historical
ⓘ Source: listings_history table (triggers on properties + properties_extension) + one-shot
backfill from property_details.listing_events for pre-trigger history.
Tax reassessment forecast IL · Partial reset (capped growth)
- Current annual tax
- $1,361 · $113/mo
- Projected year-2 tax
- $1,361 · $113/mo
- Expected delta
- $0/yr ($0/mo · 0.0%)
ⓘ Screening estimate from a state-policy table — verify with the county assessor before closing.
Climate risk First Street
- Flood 1/10 Low FEMA zone X (unshaded) · 0% chance over 30 yrs
- Wildfire 1/10 Low
- Heat 4/10 Moderate 7 d/yr ≥106°F today · 20 d/yr by 30 yrs out
- Wind 2/10 Low 2% chance of damaging wind over 30 yrs
- Air quality 2/10 Low 1 unhealthy d/yr today · 1 by 30 yrs out
Nearby sold comps map
Loading sold comps map…
Walkable amenities ~0.75 mi
Loading nearby amenities…
Taxation est. · year 1
- Rental income
- $9,600
- − Mortgage interest
- −$2,795
- − Property taxes
- −$1,361
- − Insurance
- −$250
- − Repairs & maintenance
- −$768
- − Management
- −$768
- − Depreciation
- −$1,452
- Taxable income
- $2,207
- Est. tax owed @ 24.0%
- −$530
- After-tax cash flow
- $2,304/yr
For passive investors: Depreciation is non-cash, so a rental often shows a tax loss while cash-flowing — sheltering income. Rental losses are passive: they offset passive income freely, and up to $25,000/yr can offset ordinary (W-2) income if you actively participate and your MAGI is under $100k (phasing out to $0 by $150k); unused losses carry forward. On sale, claimed depreciation is recaptured at up to 25%, and gains may owe capital-gains tax (a 1031 exchange can defer both). Figures are a year-1 estimate at your 24.0% rate — not tax advice; consult a CPA.
Schools (NCES district)
- District
- Centralia Hsd 200
- NCES district ID
- 1709300
- Math proficiency
- 21% ▲ 6.00%
- Reading proficiency
- 26% ▲ 1.00%
- Median HH income
- $34,555
- Composite
- 22.43/100
- National rank
- #13470
- State rank
- #668 of 919 in IL
Livability — Centralia
- Score
- 68/100
- State rank
- #481
- US rank
- #9987
Category grades
Schools grade is shown separately in the Schools card above.
Census & demographics
- Census place
- Centralia, IL
- City population
- 19,941
- Population (ZIP)
- 19,941
Population outlook (Marion County) Hauer SSP2
- Today (2025)
- 36,071 people
- By 2030
- 34,598 · -4.1%
- By 2040
- 31,754 · -12.0%
- By 2050
- 28,912 · -19.8%
- By 2075
- 22,527 · -37.5%
- By 2100
- 16,455 · -54.4%
Race, ethnicity, and origin ACS 2023
- Neighborhood character
- Predominantly White (81%)
- Race & ethnicity
- White 81% Black 11% Two or more races 4% Hispanic / Latino 4% Asian 1%
- Common ancestry
- Serbian 2% Romanian 2% Lithuanian 1%
- Foreign-born
- 3% · Canada, China
- Languages at home
- 96% English-only · Spanish 2%
Political lean MEDSL · Marion
- 2024 margin
- Solid R (+49.5) · D 24.6% · R 74.1% · Other 1.4%
- 2008→2024 swing
- -47.5pp toward R · 2008: -2.0pp · 2024: -49.5pp
- All cycles
- 2024: R+49.5 2020: R+46.6 2016: R+44.9 2012: R+19.2 2008: R+2.0
Not yet ingested
- Civics
- —
Market trends
- HPI YoY
- ▼ -34.12%
- Current HPI
- 211.3835
- Rent YoY
- —
- Metro
- —
- State GDP YoY
- ▲ 1.59%
- F500 in state
- 60
Industry mix (Fortune 500 HQ in IL)
| Industry | F500 HQs | Revenue |
|---|---|---|
| Insurance | 4 | $201B |
|
||
| Consumer Goods | 4 | $87B |
|
||
| Industrial Machinery | 3 | $64B |
|
||
| Healthcare | 2 | $55B |
|
||
| Retail / Pharmacy | 1 | $148B |
|
||
| Agriculture / Food | 1 | $86B |
|
||
Price history
+44.6% since first listed11 events — show timeline
- 2026-04-16 Relisted — MARIS as Distributed by MLS Grid
- 2026-04-04 Contingent — MARIS as Distributed by MLS Grid
- 2025-11-15 Listed $49,900 MARIS as Distributed by MLS Grid
- 2021-08-06 Listing Removed — RMLSA as Distributed by MLS Grid
- 2021-08-06 Listing Removed — RMLSA as Distributed by MLS Grid
- 2007-03-02 Sold (MLS) — RMLSA as Distributed by MLS Grid
- 2007-03-02 Sold (MLS) — MRED as Distributed by MLS Grid
- 2006-10-01 Listed $34,500 RMLSA as Distributed by MLS Grid
- 2006-10-01 Listed $34,500 MRED as Distributed by MLS Grid
- 2006-09-12 Listing Removed — MRED as Distributed by MLS Grid
- 2003-04-21 Listing Removed — MRED as Distributed by MLS Grid
Property tax history
+8.8%/yrLatest (2024): $1,361 · -3.1% YoY. Source: county tax records.
Cash-flow waterfall
monthlySold comps — $/sqft
last 12 mo · ≤1 miLoading sold comps…