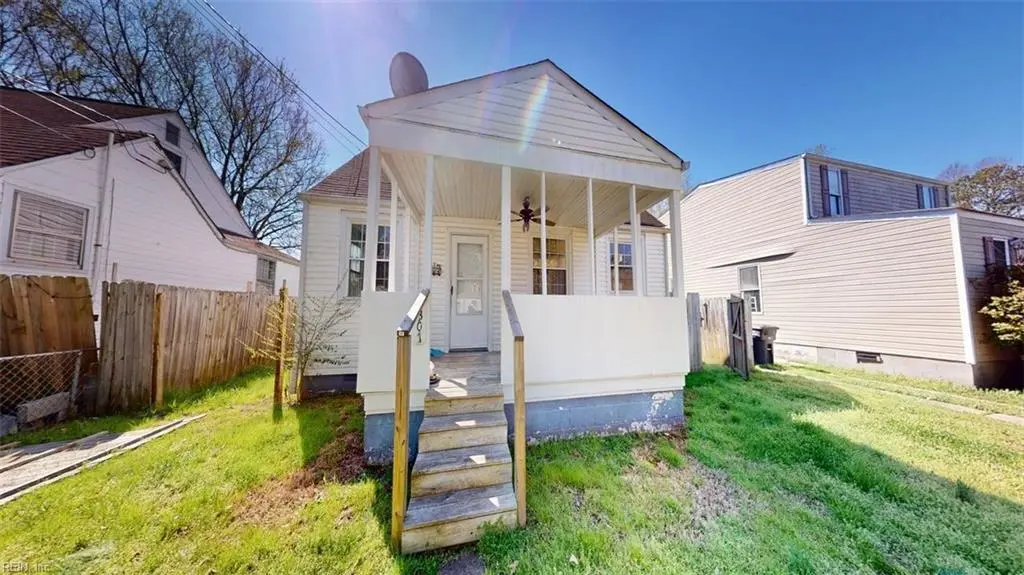
3307 Arlington Pl · Portsmouth, VA
Flood risk 4/10 · Minor
- FEMA flood zone
- X (unshaded)
- Chance of flooding over 30 yrs
- 0.13%
- Est. flood insurance / yr
- $507 – $1,088
Fire risk 1/10 · Minimal
- Est. fire insurance / yr
- $666 – $1,236
Heat risk 9/10 · Severe
- Hot days now (above 106°F)
- 7 days/yr
- Hot days in 30 yrs
- 16 days/yr
Wind risk 8/10 · Major
- Chance of severe wind over 30 yrs
- 80.0%
Air-quality risk 5/10 · Moderate
- Unhealthy air days now
- 6 days/yr
- Unhealthy air days in 30 yrs
- 7 days/yr
Risk factors via First Street. Map © Google.
Why this score? — see what drove the D grade
The composite is a weighted blend of 9 inputs, each scored 0–100. Each bar is that input's sub-score; the figure is the points it added to the 100-point composite (weight × sub-score).
- Cash flow +12.3/30.0
- ARV discount +11.5/15.0
- Schools +3.9/10.0
- DSCR +3.7/10.0
- Livability +3.7/5.0
- 1% rule +2.8/10.0
- Rent growth +2.5/5.0
- Condition / age +2.5/5.0
- Appreciation +0.0/10.0
$240,000
🖨 Deal sheet (PDF) 📄 Offer letter ✓ Due diligence
Listing remarks MLS
Opportunity knocks! This 4-bedroom, 2-bath home features LVP flooring throughout and a functional, flexible layout. Two bedrooms are located on the main level and share a convenient Jack-and-Jill bath, while upstairs offers two additional bedrooms, including one with an updated en suite. Whether you're a first-time buyer or investor, this property has excellent potential! Don’t wait!
Key facts
- 5,662 sq ft lot
- Built 1941
- Listed 90 days
Neighborhood map
What this means for you Summary
Snapshot
- This is a 4-bed/1.0-bath single-family listed at $240k.
Deal economics
- At list price, monthly cash flow is $-42 ($-509/yr) — negative.
- To cash-flow at today's rent, offer at most $233k (3.1% below list).
- To meet the 1% rule (rent ≥ 1% of price), the offer needs to be $188k (21.6% below list).
- Recommended offer: $188k (21.6% below list) — sets the bar for 1% rule.
- Cap rate 6.1% vs local median 4.6% in Portsmouth — top-decile yield for the area; either an underpriced asset or a hidden risk that comps aren't pricing in. Stress-test before assuming the spread holds.
Location & tenants
- Location reads 73/100 on livability (#172 in VA) — a middle-class / working-renter tenant base. Strengths: amenities A+, cost of living A+, housing A+; Watch: employment C-, crime F, commute F.
- Portsmouth City Public School District (urban): math 34% / reading 58% proficiency, ranked #107 of 131 in VA (top 82%) — families likely to look elsewhere, expect single-tenant / working-renter base with shorter leases.
- Zoned schools: Westhaven Elementary (math 22% / reading 52%, grade F, #933 of 1,108 statewide, top 86%, 442 students, 100% FRL); William E. Waters Middle (math 47% / reading 72%, grade B, #160 of 342 statewide, top 48%, 534 students, 99% FRL); Manor High (math 48% / reading 75%, grade B-, #240 of 319 statewide, top 75%, 1,236 students, 99% FRL) — zoned schools average 99% FRL vs 60% district-wide (39 pts higher); higher-poverty schools than district average — tighter screening recommended.
- Market conditions: 86 active listings in the ZIP; 300 units permitted in Portsmouth city in 2024 (112 in 5+ unit buildings).
- At $1,882/mo this rent would consume 46% of the median local household income ($49k/yr) (locally 963% of renters already pay >50% of income on rent) — very limited rent-growth headroom before tenants either downsize or default.
Forward outlook
- Local home prices are declining (-3.0%/yr); year-one equity from $2k of loan paydown is wiped out by about $7k of value loss. Plan a longer hold.
Negotiation context
- It's been on market 90 days — a 6% lower offer ($226k) is reasonable based on typical stale-listing flexibility.
- Current owner paid $105k; list at $240k implies a 129% gain — meaningful room to come down on a strong offer.
Risks & watch-outs
- Watch-outs: built in 1941 — expect roof / HVAC / electrical / plumbing capex.
- Climate carrying-cost: severe wind risk, 80% chance of damaging wind over 30y; extreme-heat days projected 7→16/yr by 2055 (HVAC capex compounding) — expect insurance premiums to compound above CPI over the hold.
Questions for the listing agent
- What do current leases actually rent for vs. the listed asking? Can we see a recent rent roll and the last 12 months of T-12 income?
- It's been on market 90 days. Have you received any prior offers? Is the seller open to a 22% concession, seller financing, or rate buy-down credit?
- Built in 1941 — when were the roof, HVAC, electrical panel, plumbing, and water heater last replaced?
- Why hasn't it sold? Are there any deal-killer items the seller is aware of (foundation, flood, title, zoning, code violations)?
- Is there a deadline driving the sale (1031 exchange, divorce, estate, relocation)? That informs how much negotiation room exists.
- Schools are B-rated — typically a magnet for longer-tenancy family renters. What's the average tenant stay here, and is there a school-zone premium baked into asking?
- Crime grade is F in this area — have there been break-ins, vandalism, or insurance claims at this property in the last 3 years? What carrier currently insures it and at what premium?
- The area grade is low — what's the realistic commute time and amenity access for the typical tenant pool here? Any planned neighborhood developments (good or bad) we should know about?
- What's the average days-on-market for RENTAL listings here right now (not sales)? A rising rental-DOM trend means longer vacancies and softer asking-rent achievability than the comps imply.
- What's the recent tenant-quality profile in this submarket — average credit score on applications, eviction rate, late-payment / NSF rate, and stable-employment percentage? A property-management company in the area should have these aggregated.
- How much new for-sale + rental construction is in the pipeline within 1–3 miles? Heavy new supply typically softens prices + rents 12–24 months out; constrained supply supports both.
Investment metrics
- 1% rule
- 0.78% ✗
- Cap rate
- 6.08%
- Cash-on-cash
- -0.76%
- DSCR
- 0.97
- GRM
- 10.6
CMA / ARV
- ARV (median comp)
- $263,622
- List price
- $240,000
- Delta
- -8.96%
- Verdict
- FAIR
- Comps
- 20 within 1.0 mi
Projected returns pro-forma
-3.0% appreciation · 3.0% rent growth · sell at horizon
- IRR
- -17.6%
- Equity multiple
- 0.38×
- Total profit
- $-41,643
- Equity at exit
- $35,785
- IRR
- -9.7%
- Equity multiple
- 0.41×
- Total profit
- $-39,949
- Equity at exit
- $20,751
Cash invested: $67,200 (down + closing). Projections, not guarantees.
Landlord ↔ Tenant lean methodology
- Overall (STATE)
- 55 Moderately Landlord-Leaning
- State Virginia
- 55 Moderately Landlord-Leaning · D+2
- County
- — inherits STATE
- City
- — inherits STATE
ZIP-level market 23707
- Home prices YoY
- -23.7%
- Active inventory
- 86
- Price-to-rent
- 10.6×
Monthly cashflow live
- Estimated rent
- $1,882 medium interval (Pro) →
- Mortgage (P&I)
- −$1,259
- Tax from tax record
- −$170 /mo · $2,046/yr
- Insurance
- −$100
- HOA
- −$0
- Vacancy / Maint / Mgmt
- −$395
- Net cashflow
- $-42
Break-even live
Sensitivity live
| Price | -10% $93 | -5% $26 | +0% $-42 | +5% $-110 | +10% $-178 |
|---|---|---|---|---|---|
| Rent | -10% $-191 | -5% $-117 | +0% $-42 | +5% $32 | +10% $106 |
| Rate | -1.0pp $78 | -0.5pp $19 | base $-42 | +0.5pp $-105 | +1.0pp $-168 |
UW: 25.0% down · 7.5% · 30yr · 1.5% tax · 5.0% vac · 8.0% maint · 8.0% mgmt
Financing live
Cash to close
- Down payment
- $60,000
- Closing costs
- $7,200
- Reserves months
- —
- Total cash needed
- —
Loan-product check · same deal, 3 products live
Conventional
25% down · 7.5% · 30yr
- Down + closing
- —
- Monthly P&I
- —
- Monthly cashflow
- —
- DSCR
- —
- Eligible?
- —
Personal DTI + credit; lowest rate.
DSCR
20% down · 8.5% · 30yr
- Down + closing
- —
- Monthly P&I
- —
- Monthly cashflow
- —
- DSCR
- —
- Eligible?
- —
No personal income docs; deal must DSCR.
Hard money
10% down · 12.0% · 12mo
- Down + closing
- —
- Monthly P&I
- —
- Monthly cashflow
- —
- DSCR
- —
- Eligible?
- —
Short-term bridge; refi at stabilization.
Listing history 16 events
-
2026-06-21days on market $240,000 Active 90 DOM
-
2026-06-18days on market $240,000 Active 87 DOM
-
2026-06-17days on market $240,000 Active 86 DOM
-
2026-06-16days on market $240,000 Active 85 DOM
-
2026-06-15days on market $240,000 Active 84 DOM
-
2026-06-13days on market $240,000 Active 82 DOM
-
2026-06-09days on market $240,000 Active 78 DOM
-
2026-06-08days on market $240,000 Active 77 DOM
-
2026-06-07days on market $240,000 Active 76 DOM
-
2026-06-03days on market $240,000 Active 72 DOM
-
2026-06-02days on market $240,000 Active 71 DOM
-
2026-06-01days on market $240,000 Active 70 DOM
-
2026-05-31days on market $240,000 Active 69 DOM
-
2026-03-23$240,000 Active 392-char remark
Show marketing remark (392 chars)
Opportunity knocks! This 4-bedroom, 2-bath home features LVP flooring throughout and a functional, flexible layout. Two bedrooms are located on the main level and share a convenient Jack-and-Jill bath, while upstairs offers two additional bedrooms, including one with an updated en suite. Whether you're a first-time buyer or investor, this property has excellent potential! Don’t wait!
-
2010-04-30soldstatus $105,000
-
2005-04-25soldstatus $115,000
ⓘ Source: listings_history table (triggers on properties + properties_extension) + one-shot
backfill from property_details.listing_events for pre-trigger history.
Tax reassessment forecast VA · Resets to sale price
- Current annual tax
- $2,046 · $170/mo
- Projected year-2 tax
- $2,046 · $170/mo
- Expected delta
- $0/yr ($0/mo · 0.0%)
ⓘ Screening estimate from a state-policy table — verify with the county assessor before closing.
Climate risk First Street
- Flood 4/10 Moderate FEMA zone X (unshaded) · 13% chance over 30 yrs
- Wildfire 1/10 Low
- Heat 9/10 Extreme 7 d/yr ≥106°F today · 16 d/yr by 30 yrs out
- Wind 8/10 Severe 80% chance of damaging wind over 30 yrs
- Air quality 5/10 Major 6 unhealthy d/yr today · 7 by 30 yrs out
Nearby sold comps map
Loading sold comps map…
Walkable amenities ~0.75 mi
Loading nearby amenities…
Taxation est. · year 1
- Rental income
- $22,582
- − Mortgage interest
- −$13,444
- − Property taxes
- −$2,046
- − Insurance
- −$1,200
- − Repairs & maintenance
- −$1,807
- − Management
- −$1,807
- − Depreciation
- −$6,982
- Taxable loss
- −$4,702
- Est. tax savings @ 24.0%
- +$1,129
- After-tax cash flow
- $620/yr
For passive investors: Depreciation is non-cash, so a rental often shows a tax loss while cash-flowing — sheltering income. Rental losses are passive: they offset passive income freely, and up to $25,000/yr can offset ordinary (W-2) income if you actively participate and your MAGI is under $100k (phasing out to $0 by $150k); unused losses carry forward. On sale, claimed depreciation is recaptured at up to 25%, and gains may owe capital-gains tax (a 1031 exchange can defer both). Figures are a year-1 estimate at your 24.0% rate — not tax advice; consult a CPA.
Schools (NCES district)
- District
- Portsmouth City Public School District
- NCES district ID
- 5103000
- Math proficiency
- 34% ▼ -40.00%
- Reading proficiency
- 58% ▼ -12.00%
- Median HH income
- $46,152
- Composite
- 39.01/100
- National rank
- #4071
- State rank
- #107 of 131 in VA
Livability — Portsmouth
- Score
- 73/100
- State rank
- #172
- US rank
- #5381
Category grades
Schools grade is shown separately in the Schools card above.
Census & demographics
- Census place
- Portsmouth, VA
- County
- Portsmouth City · 96,366 people
- City population
- 96,366
- Metro
- Virginia Beach-Norfolk-Newport News, VA-NC
- Population (ZIP)
- 14,766
- Household income
- $48,926
- Rent vs Own
- Severe rent burden
- 963.0
Population outlook (Portsmouth County) Hauer SSP2
- Today (2025)
- 96,730 people
- By 2030
- 96,760 · +0.0%
- By 2040
- 96,573 · -0.2%
- By 2050
- 95,606 · -1.2%
- By 2075
- 93,579 · -3.3%
- By 2100
- 83,756 · -13.4%
Race, ethnicity, and origin ACS 2023
- Neighborhood character
- Diverse neighborhood (Simpson 0.64)
- Race & ethnicity
- White 43% Black 41% Two or more races 9% Hispanic / Latino 3% Asian 3%
- Common ancestry
- Slovak 2% Italian 1% Serbian 1%
- Foreign-born
- 5% · Canada, China
- Languages at home
- 94% English-only · Spanish 2% Tagalog/Filipino 1% Chinese 1%
Political lean MEDSL · Portsmouth
- 2024 margin
- Solid D (+38.6) · D 68.6% · R 30.0% · Other 1.4%
- 2008→2024 swing
- -0.7pp no change · 2008: 39.3pp · 2024: 38.6pp
- All cycles
- 2024: D+38.6 2020: D+40.8 2016: D+36.5 2012: D+39.6 2008: D+39.3
Not yet ingested
- Civics
- —
Market trends
- HPI YoY
- ▼ -93.03%
- Current HPI
- 299.832
- Rent YoY
- —
- Metro
- Virginia Beach-Norfolk-Newport News, VA-NC
- State GDP YoY
- ▲ 2.40%
- F500 in state
- 50
Industry mix (Fortune 500 HQ in VA)
| Industry | F500 HQs | Revenue |
|---|---|---|
| Aerospace / Defense | 4 | $236B |
|
||
| Technology / Defense | 3 | $32B |
|
||
| Financial Services | 2 | $176B |
|
||
| Utilities | 2 | $27B |
|
||
| Insurance | 2 | $25B |
|
||
| Technology | 2 | $15B |
|
||
Price history
+108.7% since first listed3 events — show timeline
- 2026-03-23 Listed $240,000 REINMLS
- 2010-04-30 Sold (Public Records) $105,000 Public Records
- 2005-04-25 Sold (Public Records) $115,000 Public Records
Property tax history
+3.3%/yrLatest (2025): $2,046 · +2.0% YoY. Source: county tax records.
Cash-flow waterfall
monthlySold comps — $/sqft
last 12 mo · ≤1 miLoading sold comps…