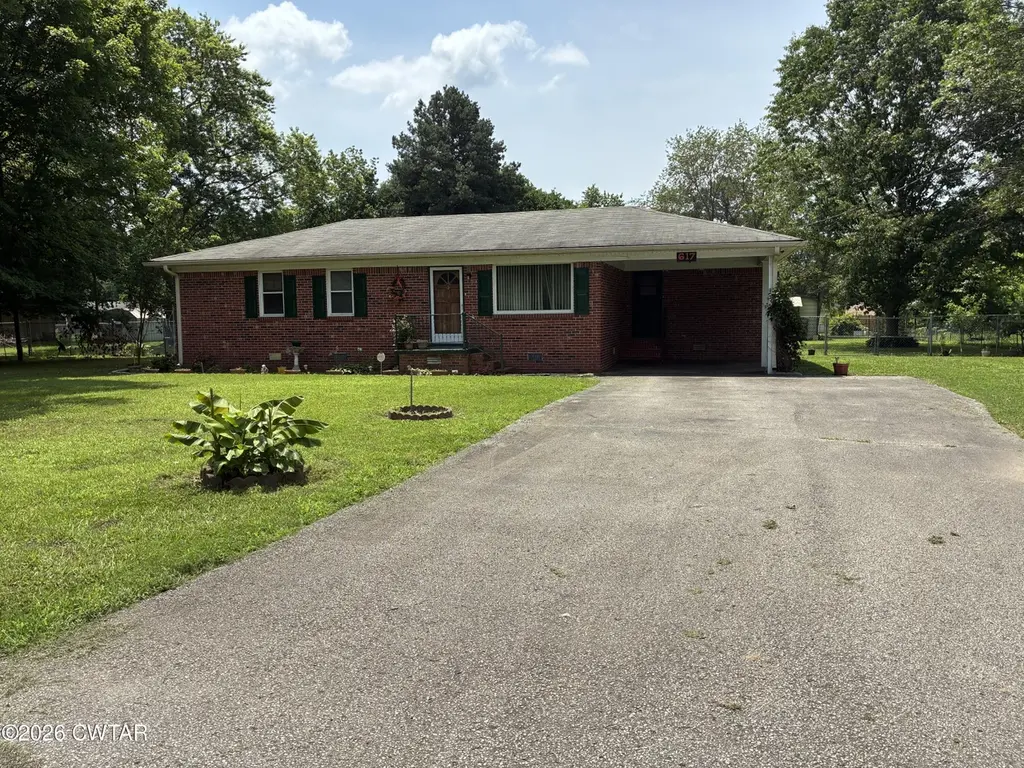
617 Drew Rd · Dyersburg, TN
Flood risk 1/10 · Minimal
- FEMA flood zone
- X (unshaded)
- Chance of flooding over 30 yrs
- 0.0%
- Est. flood insurance / yr
- $507 – $1,088
Fire risk 1/10 · Minimal
- Est. fire insurance / yr
- $949 – $1,763
Heat risk 5/10 · Moderate
- Hot days now (above 107°F)
- 7 days/yr
- Hot days in 30 yrs
- 20 days/yr
Wind risk 4/10 · Minor
- Chance of severe wind over 30 yrs
- 13.0%
Air-quality risk 2/10 · Minimal
- Unhealthy air days now
- 0 days/yr
- Unhealthy air days in 30 yrs
- 1 days/yr
Risk factors via First Street. Map © Google.
Why this score? — see what drove the D+ grade
The composite is a weighted blend of 9 inputs, each scored 0–100. Each bar is that input's sub-score; the figure is the points it added to the 100-point composite (weight × sub-score).
- Cash flow +14.4/30.0
- ARV discount +14.4/15.0
- DSCR +4.4/10.0
- Schools +3.3/10.0
- Livability +3.2/5.0
- 1% rule +2.8/10.0
- Rent growth +2.5/5.0
- Condition / age +2.5/5.0
- Appreciation +0.0/10.0
$155,000
🖨 Deal sheet 📄 Offer letter ✓ Due diligence
Key facts
- 0.56 acre lot
- 3 parking spots
- Built 1975
Property features AI
Exterior
- Parking: Three total parking spaces; One covered carport space; Two open parking spaces
- Security: Security system
- Utilities: Public water; Septic tank sewer; 200+ amp electric service; Cable available; electricity and water connected
- Home design: Single-family residence; One story; Brick construction
- Construction: Brick exterior; Composition roof; Permanent foundation; Built as a one-level home
- Exterior features: Rain gutters; Front porch; Chain link fencing; Workshop on property; Level lot; Asphalt road frontage (county road), public maintained
Interior
- Kitchen: Dishwasher; Electric range; Range hood; Refrigerator
- Bedrooms: Three bedrooms on the main level
- Flooring: Carpet
- Bathrooms: One full bathroom
- Heating & cooling: Central heating (electric); Central air conditioning; Ceiling fan(s)
- Interior features: Ceiling fans; Security system
- Laundry & utility: Washer hookup; Electric dryer hookup; Electric water heater
Neighborhood map
What this means for you Summary
Snapshot
- This is a 3-bed/1.0-bath single-family listed at $155k.
Deal economics
- At list price, monthly cash flow is $31 ($377/yr) — positive.
- The deal already cash-flows at list — no discount required.
- To meet the 1% rule (rent ≥ 1% of price), the offer needs to be $121k (21.8% below list).
- Recommended offer: $121k (21.8% below list) — sets the bar for 1% rule.
Location & tenants
- Location reads 64/100 on livability (#177 in TN) — a middle-class / working-renter tenant base. Strengths: cost of living A+, housing A+, health & safety A+; Watch: schools D, crime F, amenities F.
- Dyer County (rural): math 40% / reading 38% proficiency, ranked #16 of 139 in TN (top 12%) — families likely to look elsewhere, expect single-tenant / working-renter base with shorter leases.
- Market conditions: 66 active listings in the ZIP; 74 units permitted in Dyer County in 2024 (6 in 5+ unit buildings).
Forward outlook
- Local home prices are declining (-3.0%/yr); year-one equity from $1k of loan paydown is wiped out by about $5k of value loss. Plan a longer hold.
- Dyer County population projected at -13% by 2050 — secular population decline; favor cash flow + early exit over multi-decade hold.
Negotiation context
- It's been on market 17 days — a 2% lower offer ($153k) is reasonable based on typical stale-listing flexibility.
- Current owner paid $50k; list at $155k implies a 210% gain — meaningful room to come down on a strong offer.
Risks & watch-outs
- Climate carrying-cost: extreme-heat days projected 7→20/yr by 2055 (HVAC capex compounding) — expect insurance premiums to compound above CPI over the hold.
Questions for the listing agent
- Built in 1975 — when were the roof, HVAC, electrical panel, plumbing, and water heater last replaced?
- Is there a deadline driving the sale (1031 exchange, divorce, estate, relocation)? That informs how much negotiation room exists.
- Schools are D-rated, which usually means shorter tenancies and higher turnover. Who's the typical renter profile here, and what's been the actual vacancy rate?
- Crime grade is F in this area — have there been break-ins, vandalism, or insurance claims at this property in the last 3 years? What carrier currently insures it and at what premium?
- The area grade is low — what's the realistic commute time and amenity access for the typical tenant pool here? Any planned neighborhood developments (good or bad) we should know about?
- What's the average days-on-market for RENTAL listings here right now (not sales)? A rising rental-DOM trend means longer vacancies and softer asking-rent achievability than the comps imply.
- What's the recent tenant-quality profile in this submarket — average credit score on applications, eviction rate, late-payment / NSF rate, and stable-employment percentage? A property-management company in the area should have these aggregated.
- How much new for-sale + rental construction is in the pipeline within 1–3 miles? Heavy new supply typically softens prices + rents 12–24 months out; constrained supply supports both.
Investment metrics
- 1% rule
- 0.78% ✗
- Cap rate
- 6.54%
- Cash-on-cash
- 0.87%
- DSCR
- 1.04
- GRM
- 10.7
CMA / ARV
- ARV (on-the-fly)
- $183,009
- Comps found
- 2
Show comp detail 2 sales within ~0.75 mi
| Address | Dist | Beds/Ba | Sqft | Sold | Price | $/sf | Match |
|---|---|---|---|---|---|---|---|
| 618 Drew Rd | 0.03mi | 3/1.0 | 1,151 (0%) | 14mo | $145,000 | $126 | 87 |
| 265 Jo Cir | 0.05mi | 3/1.5 | 1,164 (+1%) | 19mo | $185,000 | $159 | 78 |
Match score weights: distance 35% · size 25% · config 20% · recency 20%. Top-matched comps best support the ARV.
Projected returns pro-forma
-3.0% appreciation · 3.0% rent growth · sell at horizon
- IRR
- -15.0%
- Equity multiple
- 0.47×
- Total profit
- $-23,186
- Equity at exit
- $23,111
- IRR
- -6.4%
- Equity multiple
- 0.59×
- Total profit
- $-17,900
- Equity at exit
- $13,402
Cash invested: $43,400 (down + closing). Projections, not guarantees.
Landlord ↔ Tenant lean methodology
- Overall (STATE)
- 87 Strongly Landlord-Friendly
- State Tennessee
- 87 Strongly Landlord-Friendly · R+13
- County
- — inherits STATE
- City
- — inherits STATE
ZIP-level market 38024
- Home prices YoY
- -28.5%
- Active inventory
- 66
- Price-to-rent
- 10.7×
Monthly cashflow live
- Estimated rent
- $1,212 medium interval (Pro) →
- Mortgage (P&I)
- −$813
- Tax from tax record
- −$49 /mo · $585/yr
- Insurance
- −$65
- HOA
- −$0
- Vacancy / Maint / Mgmt
- −$255
- Net cashflow
- $31
Break-even live
UW: 25.0% down · 7.5% · 30yr · 1.5% tax · 5.0% vac · 8.0% maint · 8.0% mgmt
Financing live
Cash to close
- Down payment
- $38,750
- Closing costs
- $4,650
- Reserves months
- —
- Total cash needed
- —
Loan-product check · same deal, 3 products live
Conventional
25% down · 7.5% · 30yr
- Down + closing
- —
- Monthly P&I
- —
- Monthly cashflow
- —
- DSCR
- —
- Eligible?
- —
Personal DTI + credit; lowest rate.
DSCR
20% down · 8.5% · 30yr
- Down + closing
- —
- Monthly P&I
- —
- Monthly cashflow
- —
- DSCR
- —
- Eligible?
- —
No personal income docs; deal must DSCR.
Hard money
10% down · 12.0% · 12mo
- Down + closing
- —
- Monthly P&I
- —
- Monthly cashflow
- —
- DSCR
- —
- Eligible?
- —
Short-term bridge; refi at stabilization.
Listing history 12 events
-
2026-06-19days on market $155,000 Active 17 DOM
-
2026-06-18days on market $155,000 Active 16 DOM
-
2026-06-17days on market $155,000 Active 15 DOM
-
2026-06-16days on market $155,000 Active 14 DOM
-
2026-06-15days on market $155,000 Active 13 DOM
-
2026-06-14days on market $155,000 Active 11 DOM
-
2026-06-12days on market $155,000 Active 10 DOM
-
2026-06-09days on market $155,000 Active 7 DOM
-
2026-06-08days on market $155,000 Active 6 DOM
-
2026-06-07days on market $155,000 Active 5 DOM
-
2026-06-07days on market $155,000 Active 4 DOM
-
2026-06-03$155,000 Active 1 DOM
ⓘ Source: listings_history table (triggers on properties + properties_extension) + one-shot
backfill from property_details.listing_events for pre-trigger history.
Tax reassessment forecast TN · Resets to sale price
- Current annual tax
- $585 · $49/mo
- Projected year-2 tax
- $1,100 · $92/mo
- Expected delta
- +$516/yr (+$43/mo · 88.1%)
ⓘ Screening estimate from a state-policy table — verify with the county assessor before closing.
Climate risk First Street
- Flood 1/10 Low FEMA zone X (unshaded) · 0% chance over 30 yrs
- Wildfire 1/10 Low
- Heat 5/10 Major 7 d/yr ≥107°F today · 20 d/yr by 30 yrs out
- Wind 4/10 Moderate 13% chance of damaging wind over 30 yrs
- Air quality 2/10 Low 0 unhealthy d/yr today · 1 by 30 yrs out
Nearby sold comps map
Loading sold comps map…
Walkable amenities ~0.75 mi
Loading nearby amenities…
Taxation est. · year 1
- Rental income
- $14,546
- − Mortgage interest
- −$8,682
- − Property taxes
- −$585
- − Insurance
- −$775
- − Repairs & maintenance
- −$1,164
- − Management
- −$1,164
- − Depreciation
- −$4,509
- Taxable loss
- −$2,333
- Est. tax savings @ 24.0%
- +$560
- After-tax cash flow
- $937/yr
For passive investors: Depreciation is non-cash, so a rental often shows a tax loss while cash-flowing — sheltering income. Rental losses are passive: they offset passive income freely, and up to $25,000/yr can offset ordinary (W-2) income if you actively participate and your MAGI is under $100k (phasing out to $0 by $150k); unused losses carry forward. On sale, claimed depreciation is recaptured at up to 25%, and gains may owe capital-gains tax (a 1031 exchange can defer both). Figures are a year-1 estimate at your 24.0% rate — not tax advice; consult a CPA.
Schools (NCES district)
- District
- Dyer County
- NCES district ID
- 4701050
- Math proficiency
- 40% ▼ -14.00%
- Reading proficiency
- 38% ▼ -1.00%
- Median HH income
- $44,865
- Composite
- 33.19/100
- National rank
- #5536
- State rank
- #16 of 139 in TN
Livability — Dyersburg
- Score
- 64/100
- State rank
- #177
- US rank
- #14658
Category grades
Schools grade is shown separately in the Schools card above.
Census & demographics
- County
- Dyer County · 25,952 people
- City population
- 25,952
- Metro
- Dyersburg, TN
- Population (ZIP)
- 25,952
- Household income
- $57,061
- Rent vs Own
- Severe rent burden
- 939.0
Population outlook (Dyer County) Hauer SSP2
- Today (2025)
- 36,770 people
- By 2030
- 35,863 · -2.5%
- By 2040
- 33,989 · -7.6%
- By 2050
- 32,124 · -12.6%
- By 2075
- 28,702 · -21.9%
- By 2100
- 25,745 · -30.0%
Race, ethnicity, and origin ACS 2023
- Neighborhood character
- Predominantly White (74%)
- Race & ethnicity
- White 74% Black 19% Two or more races 4% Hispanic / Latino 3%
- Common ancestry
- Italian 2% Romanian 2% Serbian 2%
- Foreign-born
- 2% · Canada
- Languages at home
- 97% English-only · Spanish 2%
Political lean MEDSL · Dyer
- 2024 margin
- Solid R (+61.8) · D 18.8% · R 80.6%
- 2008→2024 swing
- -24.1pp toward R · 2008: -37.7pp · 2024: -61.8pp
- All cycles
- 2024: R+61.8 2020: R+57.1 2016: R+55.4 2012: R+44.7 2008: R+37.7
Not yet ingested
- Civics
- —
Market trends
- HPI YoY
- ▼ -64.52%
- Current HPI
- 162.1695
- Rent YoY
- —
- Metro
- Dyersburg, TN
- State GDP YoY
- ▲ 2.78%
- F500 in state
- 22
Industry mix (Fortune 500 HQ in TN)
| Industry | F500 HQs | Revenue |
|---|---|---|
| Healthcare | 3 | $91B |
|
||
| Retail | 3 | $72B |
|
||
| Transportation / Logistics | 1 | $88B |
|
||
| Paper / Packaging | 1 | $19B |
|
||
| Insurance | 1 | $13B |
|
||
| Energy | 1 | $12B |
|
||
Price history
+416.7% since first listed4 events — show timeline
- 2026-05-29 Listed $155,000 CWTAR
- 2003-09-16 Sold (Public Records) $50,000 Public Records
- 1993-09-19 Sold (Public Records) $43,000 Public Records
- 1985-03-15 Sold (Public Records) $30,000 Public Records
Property tax history
+2.2%/yrLatest (2025): $585 · +19.1% YoY. Source: county tax records.
Cash-flow waterfall
monthlySold comps — $/sqft
last 12 mo · ≤1 miLoading sold comps…