1708 Redwood Dr · Harker Heights, TX
Flood risk 1/10 · Minimal
- FEMA flood zone
- X (unshaded)
- Chance of flooding over 30 yrs
- 0.0%
- Est. flood insurance / yr
- $507 – $1,088
Fire risk 2/10 · Minimal
- Est. fire insurance / yr
- $1,222 – $2,270
Heat risk 8/10 · Major
- Hot days now (above 107°F)
- 7 days/yr
- Hot days in 30 yrs
- 23 days/yr
Wind risk 6/10 · Moderate
- Chance of severe wind over 30 yrs
- 61.0%
Air-quality risk 1/10 · Minimal
- Unhealthy air days now
- 0 days/yr
- Unhealthy air days in 30 yrs
- 0 days/yr
Risk factors via First Street. Map © Google.
Why this score? — see what drove the D- grade
The composite is a weighted blend of 9 inputs, each scored 0–100. Each bar is that input's sub-score; the figure is the points it added to the 100-point composite (weight × sub-score).
- ARV discount +15.0/15.0
- Cash flow +8.0/30.0
- Livability +4.0/5.0
- Schools +3.0/10.0
- Rent growth +2.7/5.0
- 1% rule +2.6/10.0
- Condition / age +2.5/5.0
- DSCR +2.1/10.0
- Appreciation +0.0/10.0
$225,000
🖨 Deal sheet 📄 Offer letter ✓ Due diligence
Listing remarks MLS
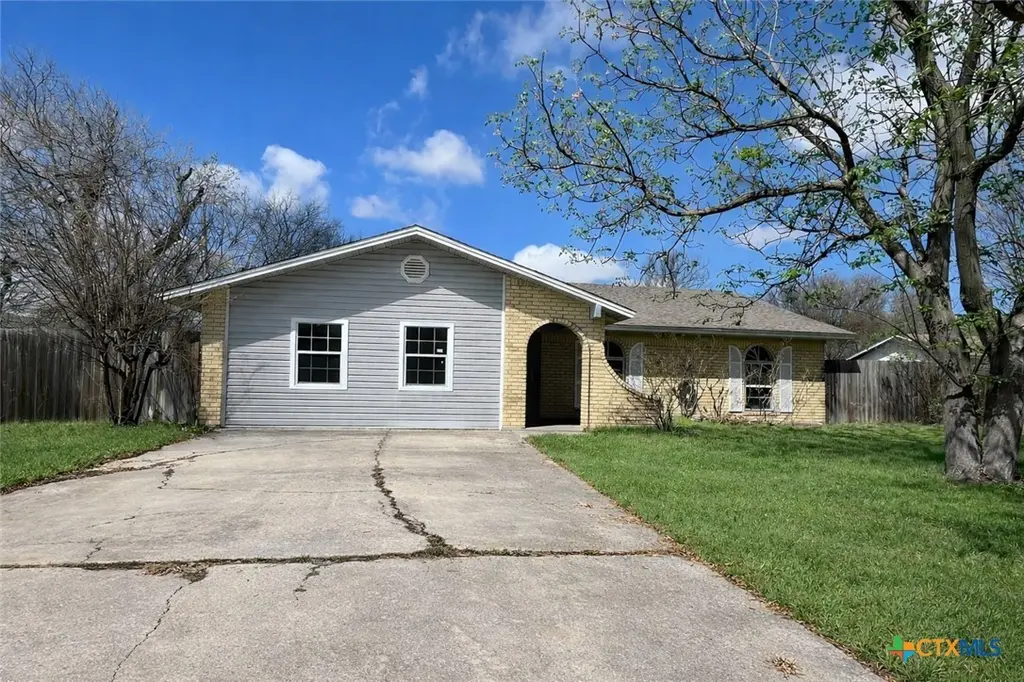
Single-story home offering great potential in a well-established neighborhood! Featuring a spacious layout, this property provides a solid foundation for homeowners or investors looking to add their personal touch. The home boasts a bright exterior with a combination of classic brick and siding. Inside, you’ll find a functional floor plan with plenty of natural light and room to customize. With just a few cosmetic updates, this home can truly shine and become a beautiful primary residence or investment opportunity. Conveniently located near local schools, shopping, and dining, this property combines location, space, and value.
Key facts
- 0.24 acre lot
- Built 1977
- Listed 72 days
Neighborhood map
What this means for you Summary
Snapshot
- This is a 3-bed/2.0-bath single-family listed at $225k.
Deal economics
- At list price, monthly cash flow is $-230 ($-3k/yr) — negative.
- To cash-flow at today's rent, offer at most $184k (18.0% below list).
- To meet the 1% rule (rent ≥ 1% of price), the offer needs to be $170k (24.4% below list).
- Recommended offer: $170k (24.4% below list) — sets the bar for 1% rule.
- Cap rate 5.1% vs local median 3.8% in Harker Heights — top-decile yield for the area; either an underpriced asset or a hidden risk that comps aren't pricing in. Stress-test before assuming the spread holds.
Location & tenants
- Location reads 79/100 on livability (#61 in TX, #2,271 nationally) — a middle-class / working-renter tenant base. Strengths: cost of living A+, housing A+, health & safety A+; Watch: amenities F, commute F.
- Killeen ISD (urban): math 31% / reading 38% proficiency, ranked #524 of 826 in TX (top 63%) — families likely to look elsewhere, expect single-tenant / working-renter base with shorter leases.
- Market conditions: Rents flat; 267 active listings in the ZIP; 30 comparable units currently listed for rent nearby; rentals lingering (median 44d on market — plan ~5-8 weeks vacancy on turnover, expect pricing pressure); 63% of comp listings sitting > 30 days — soft ceiling on asking rent; solid renter incomes; 3,222 units permitted in Bell County in 2024 (246 in 5+ unit buildings).
Forward outlook
- Local home prices are declining (-3.0%/yr); year-one equity from $2k of loan paydown is wiped out by about $7k of value loss. Plan a longer hold.
- Bell County population projected at +21% by 2050 — long-run rental-demand tailwind backs the buy-and-hold thesis.
Negotiation context
- It's been on market 72 days — a 6% lower offer ($212k) is reasonable based on typical stale-listing flexibility.
Risks & watch-outs
- Climate carrying-cost: major wind risk, 61% chance of damaging wind over 30y; extreme-heat days projected 7→23/yr by 2055 (HVAC capex compounding) — expect insurance premiums to compound above CPI over the hold.
Questions for the listing agent
- What do current leases actually rent for vs. the listed asking? Can we see a recent rent roll and the last 12 months of T-12 income?
- It's been on market 72 days. Have you received any prior offers? Is the seller open to a 24% concession, seller financing, or rate buy-down credit?
- Built in 1977 — when were the roof, HVAC, electrical panel, plumbing, and water heater last replaced?
- Why hasn't it sold? Are there any deal-killer items the seller is aware of (foundation, flood, title, zoning, code violations)?
- Is there a deadline driving the sale (1031 exchange, divorce, estate, relocation)? That informs how much negotiation room exists.
- The area grade is low — what's the realistic commute time and amenity access for the typical tenant pool here? Any planned neighborhood developments (good or bad) we should know about?
- What's the average days-on-market for RENTAL listings here right now (not sales)? A rising rental-DOM trend means longer vacancies and softer asking-rent achievability than the comps imply.
- What's the recent tenant-quality profile in this submarket — average credit score on applications, eviction rate, late-payment / NSF rate, and stable-employment percentage? A property-management company in the area should have these aggregated.
- How much new for-sale + rental construction is in the pipeline within 1–3 miles? Heavy new supply typically softens prices + rents 12–24 months out; constrained supply supports both.
Investment metrics
- 1% rule
- 0.76% ✗
- Cap rate
- 5.07%
- Cash-on-cash
- -4.37%
- DSCR
- 0.81
- GRM
- 11.0
CMA / ARV
- ARV (median comp)
- $271,106
- List price
- $225,000
- Delta
- -17.01%
- Verdict
- UNDERPRICED
- Comps
- 20 within 1.0 mi
Show comp detail 12 sales within ~0.75 mi
| Address | Dist | Beds/Ba | Sqft | Sold | Price | $/sf | Match |
|---|---|---|---|---|---|---|---|
| 606 E Briarwood Ln | 0.17mi | 4/2.0 (+1) | 2,265 (+2%) | 2mo | $292,000 | $129 | 82 |
| 1705 Redwood Dr | 0.04mi | 3/2.0 | 2,417 (+9%) | 6mo | $300,000 | $124 | 78 |
| 103 W Woodlawn Dr | 0.44mi | 3/2.0 | 2,186 (-2%) | 12mo | $283,000 | $129 | 66 |
| 403 Evergreen Dr | 0.40mi | 3/2.0 | 1,995 (-10%) | 8mo | $340,000 | $170 | 57 |
| 128 Shawnee Trl | 0.54mi | 4/2.0 (+1) | 2,281 (+3%) | 12mo | $275,000 | $121 | 55 |
| 6300 Emilie Ln | 0.66mi | 3/2.0 | 2,378 (+7%) | 4mo | $266,000 | $112 | 54 |
| 2210 Calumet Dr | 0.67mi | 4/2.0 (+1) | 2,351 (+6%) | 2mo | $299,990 | $128 | 53 |
| 2201 Calumet Dr | 0.73mi | 4/2.0 (+1) | 2,283 (+3%) | 9mo | $299,900 | $131 | 49 |
| 210 Black Hawk Trl | 0.71mi | 3/2.0 | 1,990 (-10%) | 6mo | $259,000 | $130 | 45 |
| 104 Missouri Dr | 0.71mi | 4/2.0 (+1) | 2,400 (+8%) | 7mo | $360,000 | $150 | 43 |
| 2421 Caroline Ct | 0.71mi | 4/2.0 (+1) | 2,032 (-9%) | 8mo | $280,000 | $138 | 41 |
| 2209 Wickiup Trl | 0.73mi | 4/2.0 (+1) | 2,410 (+8%) | 12mo | $299,000 | $124 | 37 |
Match score weights: distance 35% · size 25% · config 20% · recency 20%. Top-matched comps best support the ARV.
Projected returns pro-forma
-3.0% appreciation · 0.93% rent growth · sell at horizon
- IRR
- -26.0%
- Equity multiple
- 0.13×
- Total profit
- $-54,520
- Equity at exit
- $33,548
- IRR
- -31.3%
- Equity multiple
- -0.27×
- Total profit
- $-79,827
- Equity at exit
- $19,454
Cash invested: $63,000 (down + closing). Projections, not guarantees.
Landlord ↔ Tenant lean methodology
- Overall (STATE)
- 87 Strongly Landlord-Friendly
- State Texas
- 87 Strongly Landlord-Friendly · R+5
- County
- — inherits STATE
- City
- — inherits STATE
ZIP-level market 76548
- Home prices YoY
- -25.2%
- Rents YoY
- 0.9%
- Active inventory
- 267
- Price-to-rent
- 11.0×
Monthly cashflow live
- Estimated rent
- $1,702 high interval (Pro) →
- Mortgage (P&I)
- −$1,180
- Tax from tax record
- −$300 /mo · $3,605/yr
- Insurance
- −$94
- HOA
- −$0
- Vacancy / Maint / Mgmt
- −$357
- Net cashflow
- $-230
Break-even live
UW: 25.0% down · 7.5% · 30yr · 1.5% tax · 5.0% vac · 8.0% maint · 8.0% mgmt
Financing live
Cash to close
- Down payment
- $56,250
- Closing costs
- $6,750
- Reserves months
- —
- Total cash needed
- —
Loan-product check · same deal, 3 products live
Conventional
25% down · 7.5% · 30yr
- Down + closing
- —
- Monthly P&I
- —
- Monthly cashflow
- —
- DSCR
- —
- Eligible?
- —
Personal DTI + credit; lowest rate.
DSCR
20% down · 8.5% · 30yr
- Down + closing
- —
- Monthly P&I
- —
- Monthly cashflow
- —
- DSCR
- —
- Eligible?
- —
No personal income docs; deal must DSCR.
Hard money
10% down · 12.0% · 12mo
- Down + closing
- —
- Monthly P&I
- —
- Monthly cashflow
- —
- DSCR
- —
- Eligible?
- —
Short-term bridge; refi at stabilization.
Rent comps 30 comps
| Address | Beds | Baths | Sqft | Rent | $/sqft | DOM | Units | Dist |
|---|---|---|---|---|---|---|---|---|
| 1612 Harley Dr Harker Heights, TX | 4.0 | 2.0 | 1449 | $1,495 | $1.03 | 43d | 1 | 0.27mi |
| 226 Lottie Ln Harker Heights, TX | 3.0 | 2.0 | 2469 | $1,727 | $0.70 | 43d | 1 | 0.51mi |
| 5302 Rose Garden Loop Unit 100P Killeen, TX | 3.0 | 2.0 | 2492 | $1,500 | $0.60 | 13d | 1 | 0.54mi |
| 5402 Birmingham Cir Killeen, TX | 4.0 | 2.0 | 2194 | $1,900 | $0.87 | 43d | 1 | 0.63mi |
| 5322 Birmingham Cir Killeen, TX | 4.0 | 2.0 | 1773 | $1,667 | $0.94 | 43d | 1 | 0.65mi |
| 2128 Modoc Dr Harker Heights, TX | 4.0 | 2.0 | 2283 | $1,652 | $0.72 | 23d | 1 | 0.66mi |
| 803 White Meadow Ln Unit B Harker Heights, TX | 3.0 | 2.5 | 2802 | $1,450 | $0.52 | 43d | 1 | 0.69mi |
| 6110 Melanie Dr Killeen, TX | 3.0 | 2.0 | 1814 | $1,900 | $1.05 | 23d | 1 | 0.75mi |
| 210 Dale Earnhardt Dr Unit B Harker Heights, TX | 3.0 | 2.0 | 2275 | $1,250 | $0.55 | 43d | 1 | 0.76mi |
| 2208 Illinois Dr Harker Heights, TX | 3.0 | 2.5 | 1894 | $1,795 | $0.95 | 23d | 1 | 0.76mi |
| 3020 Rain Dance Loop Harker Heights, TX | 3.0 | 2.5 | 2212 | $2,150 | $0.97 | 43d | 1 | 0.78mi |
| 5106 White Rose Dr Killeen, TX | 3.0 | 2.0 | 1419 | $1,650 | $1.16 | 43d | 1 | 0.79mi |
| 307 Illinois Dr Harker Heights, TX | 3.0 | 2.0 | 2195 | $1,875 | $0.85 | 43d | 1 | 0.84mi |
| 506 Harley Dr Unit A Harker Heights, TX | 2.0 | 1.0 | 1700 | $800 | $0.47 | 21d | 1 | 0.91mi |
| 2304 Skipcha Dr Harker Heights, TX | 3.0 | 2.0 | 1892 | $1,895 | $1.00 | 13d | 1 | 0.91mi |
| 313 Jeff Gordon Dr Unit A Harker Heights, TX | 3.0 | 2.0 | 2316 | $1,125 | $0.49 | 13d | 1 | 1.02mi |
| 5110 Glenoak Dr Killeen, TX | 4.0 | 2.0 | 1929 | $1,795 | $0.93 | 43d | 1 | 1.07mi |
| 5107 Daybreak Dr Killeen, TX | 3.0 | 2.0 | 2301 | $1,175 | $0.51 | 23d | 1 | 1.07mi |
| 5006 Morning Star Ln Killeen, TX | 4.0 | 2.0 | 1611 | $1,695 | $1.05 | 23d | 1 | 1.14mi |
| 5006 Parkwood Dr Killeen, TX | 4.0 | 2.0 | 1506 | $1,550 | $1.03 | 43d | 1 | 1.18mi |
| 4806 Greenlee Dr Killeen, TX | 3.0 | 2.5 | 1620 | $1,400 | $0.86 | 43d | 1 | 1.25mi |
| 1701 Lynx Cir Harker Heights, TX | 4.0 | 2.0 | 1451 | $2,800 | $1.93 | 43d | 1 | 1.26mi |
| 5010 White Rock Dr Killeen, TX | 3.0 | 2.5 | 2249 | $1,600 | $0.71 | 43d | 1 | 1.29mi |
| 4716 Glass Mountain Dr Killeen, TX | 3.0 | 2.0 | 1480 | $1,545 | $1.04 | 13d | 1 | 1.34mi |
| 5005 Shawn Dr Killeen, TX | 3.0 | 2.0 | 1530 | $1,400 | $0.92 | 43d | 1 | 1.34mi |
| 237 N Mary Jo Dr Harker Heights, TX | 3.0 | 2.0 | 2402 | $1,150 | $0.48 | 43d | 1 | 1.39mi |
| 5311 White Rock Dr Killeen, TX | 4.0 | 2.5 | 2247 | $1,975 | $0.88 | 43d | 1 | 1.39mi |
| 4807 Teal Dr Killeen, TX | 3.0 | 2.0 | 1421 | $1,495 | $1.05 | 43d | 1 | 1.40mi |
| 5510 Shawn Dr Killeen, TX | 4.0 | 2.0 | 2186 | $1,700 | $0.78 | 23d | 1 | 1.49mi |
| 603 Mustang Trl Harker Heights, TX | 4.0 | 2.5 | 2074 | $2,000 | $0.96 | 43d | 1 | 1.50mi |
Listing history 17 events
-
2026-06-18days on market $225,000 Active 72 DOM
-
2026-06-17days on market $225,000 Active 71 DOM
-
2026-06-16days on market $225,000 Active 70 DOM
-
2026-06-15days on market $225,000 Active 69 DOM
-
2026-06-14days on market $225,000 Active 67 DOM
-
2026-06-13days on market $225,000 Active 66 DOM
-
2026-06-10days on market $225,000 Active 64 DOM
-
2026-06-09days on market $225,000 Active 63 DOM
-
2026-06-08days on market $225,000 Active 62 DOM
-
2026-06-07days on market $225,000 Active 61 DOM
-
2026-06-03days on market $225,000 Active 57 DOM
-
2026-06-02days on market $225,000 Active 56 DOM
-
2026-06-01days on market $225,000 Active 55 DOM
-
2026-05-31days on market $225,000 Active 54 DOM
-
2026-05-30days on market $225,000 Active 53 DOM
-
2026-04-07$225,000 Active 640-char remark
Show marketing remark (640 chars)
Single-story home offering great potential in a well-established neighborhood! Featuring a spacious layout, this property provides a solid foundation for homeowners or investors looking to add their personal touch. The home boasts a bright exterior with a combination of classic brick and siding. Inside, you’ll find a functional floor plan with plenty of natural light and room to customize. With just a few cosmetic updates, this home can truly shine and become a beautiful primary residence or investment opportunity. Conveniently located near local schools, shopping, and dining, this property combines location, space, and value.
-
1993-01-19soldstatus
ⓘ Source: listings_history table (triggers on properties + properties_extension) + one-shot
backfill from property_details.listing_events for pre-trigger history.
Tax reassessment forecast TX · Resets to sale price
- Current annual tax
- $3,605 · $300/mo
- Projected year-2 tax
- $4,118 · $343/mo
- Expected delta
- +$512/yr (+$43/mo · 14.2%)
ⓘ Screening estimate from a state-policy table — verify with the county assessor before closing.
Climate risk First Street
- Flood 1/10 Low FEMA zone X (unshaded) · 0% chance over 30 yrs
- Wildfire 2/10 Low
- Heat 8/10 Severe 7 d/yr ≥107°F today · 23 d/yr by 30 yrs out
- Wind 6/10 Major 61% chance of damaging wind over 30 yrs
- Air quality 1/10 Low 0 unhealthy d/yr today · 0 by 30 yrs out
Nearby sold comps map
Loading sold comps map…
Walkable amenities ~0.75 mi
Loading nearby amenities…
Taxation est. · year 1
- Rental income
- $20,423
- − Mortgage interest
- −$12,603
- − Property taxes
- −$3,605
- − Insurance
- −$1,125
- − Repairs & maintenance
- −$1,634
- − Management
- −$1,634
- − Depreciation
- −$6,545
- Taxable loss
- −$6,724
- Est. tax savings @ 24.0%
- +$1,614
- After-tax cash flow
- $-1,142/yr
For passive investors: Depreciation is non-cash, so a rental often shows a tax loss while cash-flowing — sheltering income. Rental losses are passive: they offset passive income freely, and up to $25,000/yr can offset ordinary (W-2) income if you actively participate and your MAGI is under $100k (phasing out to $0 by $150k); unused losses carry forward. On sale, claimed depreciation is recaptured at up to 25%, and gains may owe capital-gains tax (a 1031 exchange can defer both). Figures are a year-1 estimate at your 24.0% rate — not tax advice; consult a CPA.
Schools (NCES district)
- District
- Killeen ISD
- NCES district ID
- 4825660
- Math proficiency
- 31% ▼ -16.00%
- Reading proficiency
- 38% ▼ -3.00%
- Median HH income
- $47,665
- Composite
- 29.69/100
- National rank
- #6458
- State rank
- #524 of 826 in TX
Livability — Harker Heights
- Score
- 79/100
- State rank
- #61
- US rank
- #2271
Category grades
Schools grade is shown separately in the Schools card above.
Census & demographics
- Census place
- Harker Heights, TX
- County
- Bell County · 345,090 people
- City population
- 33,729
- Metro
- Killeen-Temple, TX
- Population (ZIP)
- 33,729
- Household income
- $80,520
- Rent vs Own
- Severe rent burden
- 672.0
Population outlook (Bell County) Hauer SSP2
- Today (2025)
- 371,114 people
- By 2030
- 389,104 · +4.8%
- By 2040
- 420,592 · +13.3%
- By 2050
- 447,779 · +20.7%
- By 2075
- 499,130 · +34.5%
- By 2100
- 505,680 · +36.3%
Race, ethnicity, and origin ACS 2023
- Neighborhood character
- Highly diverse neighborhood (Simpson 0.72)
- Race & ethnicity
- White 40% Black 27% Hispanic / Latino 22% Two or more races 13% Asian 3% Pacific Islander 2% Native American 1%
- Hispanic origin (detail)
- Mexican 14% Puerto Rican 3%
- Common ancestry
- Iranian 3% Lithuanian 2% Italian 2%
- Foreign-born
- 10% · Canada, Vietnam, South Korea
- Languages at home
- 83% English-only · Spanish 9% French/Haitian/Cajun 2% German/W. Germanic 1%
Political lean MEDSL · Bell
- 2024 margin
- R (+16.2) · D 41.3% · R 57.6% · Other 1.1%
- 2008→2024 swing
- -6.5pp toward R · 2008: -9.8pp · 2024: -16.2pp
- All cycles
- 2024: R+16.2 2020: R+8.5 2016: R+15.1 2012: R+16.4 2008: R+9.8
Not yet ingested
- Civics
- —
Market trends
- HPI YoY
- ▼ -52.76%
- Current HPI
- 156.4499
- Rent YoY
- ▲ 0.93%
- Metro
- Killeen-Temple, TX
- State GDP YoY
- ▲ 3.95%
- F500 in state
- 110
Industry mix (Fortune 500 HQ in TX)
| Industry | F500 HQs | Revenue |
|---|---|---|
| Energy | 16 | $1,198B |
|
||
| Technology | 5 | $198B |
|
||
| Engineering / Construction | 4 | $72B |
|
||
| Energy Services | 3 | $60B |
|
||
| Utilities | 3 | $41B |
|
||
| Healthcare | 2 | $330B |
|
||
Price history
2 events — show timeline
- 2026-04-07 Listed $225,000 CTXMLS
- 1993-01-19 Sold (Public Records) — Public Records
Property tax history
+5.0%/yrLatest (2025): $3,605 · +10.1% YoY. Source: county tax records.
Cash-flow waterfall
monthlySold comps — $/sqft
last 12 mo · ≤1 miLoading sold comps…