 Multi-family
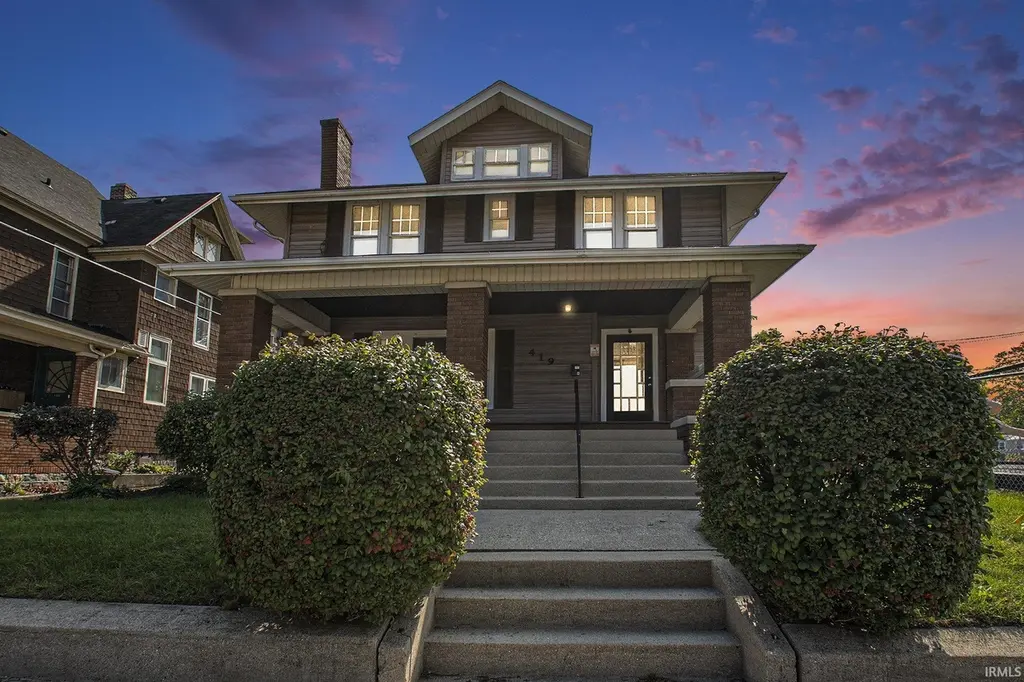
419 W High St · Elkhart, IN
Flood risk 1/10 · Minimal
- FEMA flood zone
- X (unshaded)
- Chance of flooding over 30 yrs
- 0.0%
- Est. flood insurance / yr
- $473 – $860
Fire risk 1/10 · Minimal
- Est. fire insurance / yr
- $717 – $1,331
Heat risk 3/10 · Minor
- Hot days now (above 101°F)
- 7 days/yr
- Hot days in 30 yrs
- 16 days/yr
Wind risk 2/10 · Minimal
- Chance of severe wind over 30 yrs
- —
Air-quality risk 3/10 · Minor
- Unhealthy air days now
- 2 days/yr
- Unhealthy air days in 30 yrs
- 3 days/yr
Risk factors via First Street. Map © Google.
Why this score? — see what drove the B- grade
The composite is a weighted blend of 9 inputs, each scored 0–100. Each bar is that input's sub-score; the figure is the points it added to the 100-point composite (weight × sub-score).
- Cash flow +29.8/30.0
- DSCR +10.0/10.0
- 1% rule +8.2/10.0
- ARV discount +7.5/15.0
- Livability +3.4/5.0
- Rent growth +2.5/5.0
- Condition / age +2.5/5.0
- Schools +1.8/10.0
- Appreciation +0.0/10.0
$249,900
🖨 Deal sheet 📄 Offer letter ✓ Due diligence
Multi-family units
County records classify this as Multi-Family (2-4 Unit). Listing-text estimate: 1 unit. estimate disagrees with records
Listing remarks
The moment you step through the front door your feet touch gleaming hardwood floors with a rich dark restored finish. These floors run throughout the home, adding warmth and character, each plank telling its own story through subtle imperfections that enhance the authenticity of the space. This updated two story home with four (possibly five) spacious bedrooms and two full bathrooms is close to the downtown Riverwalk, parks, shopping, restaurants, and the Aquatic Center. The kitchen, while respecting the home's vintage feel, features stainless steel appliances, new countertops, and plenty of cabinetry that complements the historical architecture. Two new modern tiled bathrooms, main level l
Key facts
- New countertops
- 6,970 sq ft lot
- 2 garage spots
Tags
Property features AI
Exterior
- Parking: Detached 2-car garage
- Utilities: Public water; Public sewer
- Home design: Single-family residence (site-built); Two stories
- Construction: Brick and vinyl siding exterior
- Exterior features: Level lot; Lot dimensions approximately 41 x 165; Lot about 0.16 acres
Interior
- Kitchen: Refrigerator; Gas range
- Bathrooms: Two full bathrooms; One bathroom on the main level
- Heating & cooling: Forced air heating; No cooling system
- Interior features: Blinds on windows; Fireplace (1)
- Laundry & utility: Washer and dryer; Laundry on the main level; Unfinished basement
Neighborhood map
What this means for you Summary
Snapshot
- This is a 3-bed/1.0-bath multifamily listed at $250k.
Deal economics
- At list price, monthly cash flow is $917 ($11k/yr) — positive.
- The deal already cash-flows at list — no discount required.
- Meets the 1% rule at list price ($3k rent vs $250k).
- Recommended offer: $242k (3.0% below list) — sets the bar for market timing.
- Cap rate 10.7% vs local median 4.0% in Elkhart — top-decile yield for the area; either an underpriced asset or a hidden risk that comps aren't pricing in. Stress-test before assuming the spread holds.
Location & tenants
- Location reads 68/100 on livability (#224 in IN) — a middle-class / working-renter tenant base. Strengths: cost of living A+, housing A+, health & safety A+; Watch: amenities C-, crime F, commute F.
- Elkhart Community Schools (urban): math 18% / reading 25% proficiency, ranked #271 of 301 in IN (top 90%) — low school quality limits family demand, transient renter base, plan for 1-2y turnover.
- Zoned schools: Mary Beck Elementary School (math 8% / reading 8%, grade F, #949 of 994 statewide, top 97%, 384 students, 89% FRL); North Side Middle School (math 15% / reading 31%, grade F, #263 of 330 statewide, top 80%, 627 students, 72% FRL); Elkhart High School (math 17% / reading 51%, grade F, #285 of 369 statewide, top 78%, 3,325 students, 63% FRL) — zoned schools average 75% FRL vs 60% district-wide (15 pts higher); higher-poverty schools than district average — tighter screening recommended.
- Market conditions: 146 active listings in the ZIP; 2 comparable units currently listed for rent nearby; 484 units permitted in Elkhart County in 2024 (136 in 5+ unit buildings).
- At $3,291/mo this rent would consume 70% of the median local household income ($56k/yr) (locally 995% of renters already pay >50% of income on rent) — very limited rent-growth headroom before tenants either downsize or default.
Forward outlook
- Local home prices are declining (-3.0%/yr); year-one equity from $2k of loan paydown is wiped out by about $7k of value loss. Plan a longer hold.
- Elkhart County population projected at +7% by 2050 — modest demand growth; plan on rents tracking national, not racing it.
- At projected returns (-3.0% appreciation + 3.0% rent growth), your $70k cash investment doubles in ~8 years — after that, you're playing with house money.
Negotiation context
- It's been on market 49 days — a 3% lower offer ($242k) is reasonable based on typical stale-listing flexibility.
- 6 sale attempts since 2y ago with the ask held roughly flat each time — persistent listings suggest the price (not the market) is what's stuck; bring a comps-based counter.
- Current owner paid $126k; list at $250k implies a 98% gain — meaningful room to come down on a strong offer.
Risks & watch-outs
- Watch-outs: built in 1910 — expect roof / HVAC / electrical / plumbing capex.
Questions for the listing agent
- It's been on market 49 days. Have you received any prior offers? Is the seller open to a 3% concession, seller financing, or rate buy-down credit?
- Built in 1910 — when were the roof, HVAC, electrical panel, plumbing, and water heater last replaced?
- Is there a deadline driving the sale (1031 exchange, divorce, estate, relocation)? That informs how much negotiation room exists.
- Schools are F-rated, which usually means shorter tenancies and higher turnover. Who's the typical renter profile here, and what's been the actual vacancy rate?
- Crime grade is F in this area — have there been break-ins, vandalism, or insurance claims at this property in the last 3 years? What carrier currently insures it and at what premium?
- What's the average days-on-market for RENTAL listings here right now (not sales)? A rising rental-DOM trend means longer vacancies and softer asking-rent achievability than the comps imply.
- What's the recent tenant-quality profile in this submarket — average credit score on applications, eviction rate, late-payment / NSF rate, and stable-employment percentage? A property-management company in the area should have these aggregated.
- How much new apartment / multifamily construction is in the pipeline within 1–3 miles? Heavy new supply (>2% of stock underway) typically softens rents 12–24 months out; light construction supports rent growth.
Investment metrics
- 1% rule
- 1.32% ✓
- Cap rate
- 10.69%
- Cash-on-cash
- 15.72%
- DSCR
- 1.70
- GRM
- 6.3
CMA / ARV
- ARV (median comp)
- $132,536
- List price
- $249,900
- Delta
- 88.55%
- Verdict
- OVERPRICED
- Comps
- 20 within 1.0 mi
Show comp detail 3 sales within ~0.75 mi
| Address | Dist | Beds/Ba | Sqft | Sold | Price | $/sf | Match |
|---|---|---|---|---|---|---|---|
| 607 W Marion St | 0.21mi | 4/4.0 (+1) | 2,028 (-4%) | 5mo | $95,000 | $47 | 63 |
| 421 Vistula St | 0.07mi | 3/2.5 | 1,983 (-6%) | 23mo | $166,000 | $84 | 62 |
| 719 W Franklin St | 0.25mi | 3/2.0 | 2,300 (+9%) | 10mo | $121,000 | $53 | 61 |
Match score weights: distance 35% · size 25% · config 20% · recency 20%. Top-matched comps best support the ARV.
Projected returns pro-forma
-3.0% appreciation · 3.0% rent growth · sell at horizon
- IRR
- 6.6%
- Equity multiple
- 1.26×
- Total profit
- $17,904
- Equity at exit
- $37,261
- IRR
- 15.9%
- Equity multiple
- 2.30×
- Total profit
- $90,851
- Equity at exit
- $21,607
Cash invested: $69,972 (down + closing). Projections, not guarantees.
Landlord ↔ Tenant lean methodology
- Overall (STATE)
- 90 Strongly Landlord-Friendly
- State Indiana
- 90 Strongly Landlord-Friendly · R+11
- County
- — inherits STATE
- City
- — inherits STATE
ZIP-level market 46516
- Active inventory
- 146
- Price-to-rent
- 25.3×
Monthly cashflow live
- Estimated rent
- $3,291 high interval (Pro) →
- Mortgage (P&I)
- −$1,311
- Tax from tax record
- −$269 /mo · $3,225/yr
- Insurance
- −$104
- HOA
- −$0
- Vacancy / Maint / Mgmt
- −$691
- Net cashflow
- $917
Break-even live
4-unit breakdown (identical units grouped — click to expand)
| Units | Beds | Baths | Est. rent |
|---|---|---|---|
| 4× units | 2 | 1 | $3,292 |
| #1 | 2 | 1 | $823 |
| #2 | 2 | 1 | $823 |
| #3 | 2 | 1 | $823 |
| #4 | 2 | 1 | $823 |
| Total (4 units) | $3,291 | ||
UW: 25.0% down · 7.5% · 30yr · 1.5% tax · 5.0% vac · 8.0% maint · 8.0% mgmt
Financing live
Cash to close
- Down payment
- $62,475
- Closing costs
- $7,497
- Reserves months
- —
- Total cash needed
- —
Loan-product check · same deal, 3 products live
Conventional
25% down · 7.5% · 30yr
- Down + closing
- —
- Monthly P&I
- —
- Monthly cashflow
- —
- DSCR
- —
- Eligible?
- —
Personal DTI + credit; lowest rate.
DSCR
20% down · 8.5% · 30yr
- Down + closing
- —
- Monthly P&I
- —
- Monthly cashflow
- —
- DSCR
- —
- Eligible?
- —
No personal income docs; deal must DSCR.
Hard money
10% down · 12.0% · 12mo
- Down + closing
- —
- Monthly P&I
- —
- Monthly cashflow
- —
- DSCR
- —
- Eligible?
- —
Short-term bridge; refi at stabilization.
Rent comps 2 comps
| Address | Beds | Baths | Sqft | Rent | $/sqft | DOM | Units | Dist |
|---|---|---|---|---|---|---|---|---|
| 721 N Michigan St Elkhart, IN | 4.0 | 2.0 | 1952 | $2,499 | $1.28 | 21d | 1 | 0.73mi |
| 1568 W Franklin St Elkhart, IN | 3.0 | 2.0 | 1486 | $1,600 | $1.08 | 21d | 1 | 0.96mi |
Listing history 30 events
-
2026-06-19days on market $249,900 Active 49 DOM
-
2026-06-18days on market $249,900 Active 48 DOM
-
2026-06-17days on market $249,900 Active 47 DOM
-
2026-06-16days on market $249,900 Active 46 DOM
-
2026-06-15days on market $249,900 Active 45 DOM
-
2026-06-14days on market $249,900 Active 43 DOM
-
2026-06-13days on market $249,900 Active 42 DOM
-
2026-06-10days on market $249,900 Active 40 DOM
-
2026-06-09days on market $249,900 Active 39 DOM
-
2026-06-08days on market $249,900 Active 38 DOM
-
2026-06-07days on market $249,900 Active 37 DOM
-
2026-06-05days on market $249,900 Active 34 DOM
-
2026-06-03days on market $249,900 Active 33 DOM
-
2026-06-02days on market $249,900 Active 32 DOM
-
2026-06-01days on market $249,900 Active 31 DOM
-
2026-05-31days on market $249,900 Active 30 DOM
-
2026-05-30days on market $249,900 Active 29 DOM
-
2026-05-01$249,900 Active 994-char remark
-
2025-10-30price $249,900
-
2025-10-10$252,900 Active
-
2025-09-23price $252,900
-
2025-08-23status Active
-
2025-08-23historical
-
2025-08-15price $257,400
-
2025-07-10price $259,900
-
2025-02-28status Active
-
2024-10-07$263,900 Active
-
2024-03-14soldstatus $126,000 Closed
-
2024-02-29status Pending
-
2024-02-21$135,000 Active
ⓘ Source: listings_history table (triggers on properties + properties_extension) + one-shot
backfill from property_details.listing_events for pre-trigger history.
Tax reassessment forecast IN · Partial reset (capped growth)
- Current annual tax
- $3,225 · $269/mo
- Projected year-2 tax
- $3,225 · $269/mo
- Expected delta
- $0/yr ($0/mo · 0.0%)
ⓘ Screening estimate from a state-policy table — verify with the county assessor before closing.
Climate risk First Street
- Flood 1/10 Low FEMA zone X (unshaded) · 0% chance over 30 yrs
- Wildfire 1/10 Low
- Heat 3/10 Moderate 7 d/yr ≥101°F today · 16 d/yr by 30 yrs out
- Wind 2/10 Low
- Air quality 3/10 Moderate 2 unhealthy d/yr today · 3 by 30 yrs out
Nearby sold comps map
Loading sold comps map…
Walkable amenities ~0.75 mi
Loading nearby amenities…
Taxation est. · year 1
- Rental income
- $39,492
- − Mortgage interest
- −$13,998
- − Property taxes
- −$3,225
- − Insurance
- −$1,250
- − Repairs & maintenance
- −$3,159
- − Management
- −$3,159
- − Depreciation
- −$7,270
- Taxable income
- $7,431
- Est. tax owed @ 24.0%
- −$1,783
- After-tax cash flow
- $9,215/yr
For passive investors: Depreciation is non-cash, so a rental often shows a tax loss while cash-flowing — sheltering income. Rental losses are passive: they offset passive income freely, and up to $25,000/yr can offset ordinary (W-2) income if you actively participate and your MAGI is under $100k (phasing out to $0 by $150k); unused losses carry forward. On sale, claimed depreciation is recaptured at up to 25%, and gains may owe capital-gains tax (a 1031 exchange can defer both). Figures are a year-1 estimate at your 24.0% rate — not tax advice; consult a CPA.
Schools (NCES district)
- District
- Elkhart Community Schools
- NCES district ID
- 1803270
- Math proficiency
- 18% ▼ -12.00%
- Reading proficiency
- 25% ▼ -9.00%
- Median HH income
- $42,881
- Composite
- 18.45/100
- National rank
- #8928
- State rank
- #271 of 301 in IN
Livability — Elkhart
- Score
- 68/100
- State rank
- #224
- US rank
- #9852
Category grades
Schools grade is shown separately in the Schools card above.
Census & demographics
- Census place
- Elkhart, IN
- County
- Elkhart County · 107,928 people
- City population
- 74,260
- Metro
- Elkhart-Goshen, IN
- Population (ZIP)
- 31,871
- Household income
- $56,492
- Rent vs Own
- Severe rent burden
- 995.0
Population outlook (Elkhart County) Hauer SSP2
- Today (2025)
- 213,761 people
- By 2030
- 218,103 · +2.0%
- By 2040
- 225,381 · +5.4%
- By 2050
- 229,447 · +7.3%
- By 2075
- 232,856 · +8.9%
- By 2100
- 214,088 · +0.2%
Race, ethnicity, and origin ACS 2023
- Neighborhood character
- Diverse neighborhood (Simpson 0.56)
- Race & ethnicity
- White 60% Hispanic / Latino 26% Black 9% Two or more races 8% Asian 1%
- Hispanic origin (detail)
- Mexican 15%
- Common ancestry
- Romanian 2% Iranian 2% Lithuanian 2%
- Foreign-born
- 15% · Canada
- Languages at home
- 77% English-only · Spanish 19% Other Indo-European 3%
Political lean MEDSL · Elkhart
- 2024 margin
- Solid R (+32.4) · D 33.1% · R 65.5% · Other 1.4%
- 2008→2024 swing
- -21.2pp toward R · 2008: -11.2pp · 2024: -32.4pp
- All cycles
- 2024: R+32.4 2020: R+28.1 2016: R+32.4 2012: R+26.5 2008: R+11.2
Not yet ingested
- Civics
- —
Market trends
- HPI YoY
- ▼ -233.42%
- Current HPI
- 239.2508
- Rent YoY
- —
- Metro
- Elkhart-Goshen, IN
- State GDP YoY
- ▲ 2.90%
- F500 in state
- 18
Industry mix (Fortune 500 HQ in IN)
| Industry | F500 HQs | Revenue |
|---|---|---|
| Industrial Machinery | 2 | $37B |
|
||
| Healthcare | 1 | $177B |
|
||
| Pharmaceuticals | 1 | $45B |
|
||
| Metals / Steel | 1 | $18B |
|
||
| Agriculture | 1 | $17B |
|
||
| Packaging | 1 | $12B |
|
||
Price history
+85.1% since first listed13 events — show timeline
- 2026-05-01 Listed $249,900 IRMLS
- 2025-10-30 Price Changed $249,900 IRMLS
- 2025-10-10 Listed $252,900 IRMLS
- 2025-09-23 Price Changed $252,900 IRMLS
- 2025-08-23 Relisted — IRMLS
- 2025-08-23 Delisted — IRMLS
- 2025-08-15 Price Changed $257,400 IRMLS
- 2025-07-10 Price Changed $259,900 IRMLS
- 2025-02-28 Relisted — IRMLS
- 2024-10-07 Listed $263,900 IRMLS
- 2024-03-14 Sold (MLS) $126,000 IRMLS
- 2024-02-29 Pending — IRMLS
- 2024-02-21 Listed $135,000 IRMLS
Property tax history
+8.9%/yrLatest (2025): $3,225 · +21.8% YoY. Source: county tax records.
Cash-flow waterfall
monthlySold comps — $/sqft
last 12 mo · ≤1 miLoading sold comps…