79 Brittany Unit B · Delray Beach, FL
Flood risk 1/10 · Minimal
- FEMA flood zone
- X (unshaded)
- Chance of flooding over 30 yrs
- 0.0%
- Est. flood insurance / yr
- $507 – $1,088
Fire risk 1/10 · Minimal
- Est. fire insurance / yr
- $947 – $1,759
Heat risk 9/10 · Severe
- Hot days now (above 107°F)
- 6 days/yr
- Hot days in 30 yrs
- 22 days/yr
Wind risk 10/10 · Severe
- Chance of severe wind over 30 yrs
- 99.0%
Air-quality risk 2/10 · Minimal
- Unhealthy air days now
- 2 days/yr
- Unhealthy air days in 30 yrs
- 2 days/yr
Risk factors via First Street. Map © Google.
Why this score? — see what drove the B+ grade
The composite is a weighted blend of 9 inputs, each scored 0–100. Each bar is that input's sub-score; the figure is the points it added to the 100-point composite (weight × sub-score).
- Cash flow +30.0/30.0
- 1% rule +10.0/10.0
- DSCR +10.0/10.0
- ARV discount +7.5/15.0
- Appreciation +5.3/10.0
- Schools +4.3/10.0
- Livability +3.9/5.0
- Rent growth +2.6/5.0
- Condition / age +2.5/5.0
$52,900
🖨 Deal sheet 📄 Offer letter ✓ Due diligence
Listing remarks
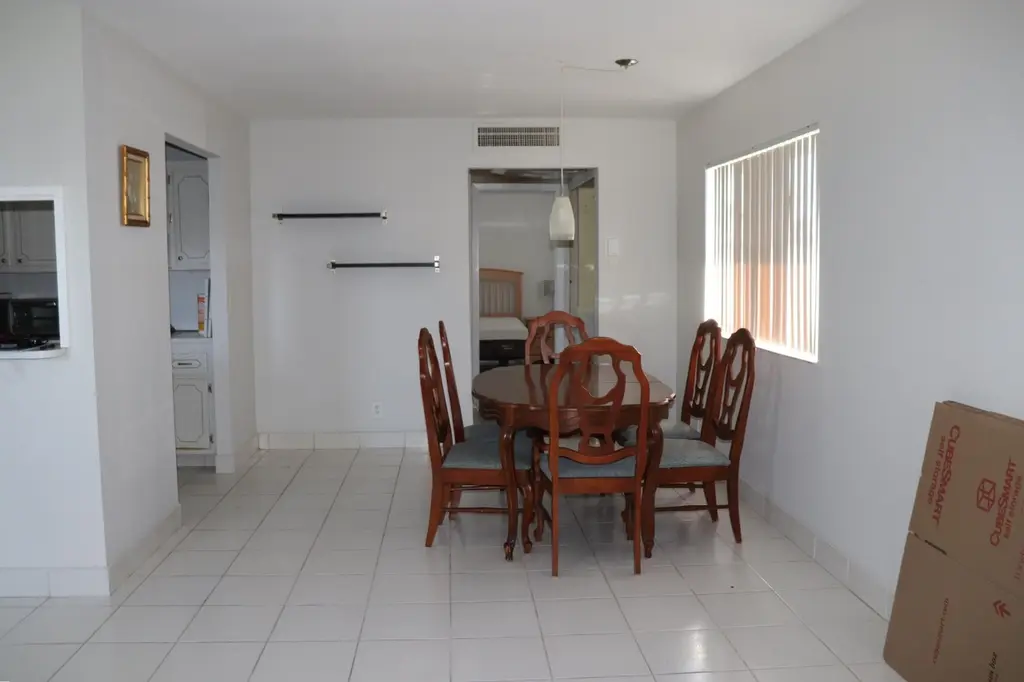
New opportunity in Kings Point! This 1-bedroom, 1.5-bath second-floor condo is ready for its next owner to add their own style and updates. The unit features tile flooring throughout, a partially updated primary bathroom, open balcony space, a newer A/C replaced in April 2025, and a water heater that's only 3 years old. Great layout, solid condition, and tons of potential at an attractive price point. Enjoy everything Kings Point has to offer, including golf courses, multiple pools, tennis courts, fitness center, dining, entertainment, and an active social lifestyle with endless amenities and activities.
Key facts
- $637 HOA
- Parking
- Community pool
Property features AI
Finance
- Financial info: Pets not allowed; Senior community
- HOA & community: Monthly HOA fee; HOA includes cable TV, insurance, and grounds maintenance; Community amenities: pool, fitness center, clubhouse, community room, library, game room, billiard room, cafe/restaurant, workshop area, picnic area, street lights, basketball court, shuffleboard court, bocce ball, pickleball courts
Exterior
- Parking: Assigned parking (1 open/assigned space)
- Security: Gated community with guard; Security patrol; Smoke detectors
- Utilities: Public water; Public sewer; Three-phase electric service; Cable available
- Home design: Condominium; 2 stories total; Resale property; Unit faces east
- Construction: Pre-fab construction
- Exterior features: Waterfront property (no specific waterfront features listed); Flat roof
Interior
- Kitchen: Dishwasher; Refrigerator; Electric water heater
- Bedrooms: 2 bedrooms on the main level
- Flooring: Tile flooring
- Bathrooms: 1 full bathroom; 1 half bathroom
- Heating & cooling: Central electric heating; Central electric cooling
- Interior features: No notable built-in interior features; Furnished
- Laundry & utility: In-unit laundry
Neighborhood map
What this means for you Summary
Snapshot
- This is a 1-bed/1.5-bath condo listed at $53k.
Deal economics
- At list price, monthly cash flow is $338 ($4k/yr) — positive.
- The deal already cash-flows at list — no discount required.
- Meets the 1% rule at list price ($2k rent vs $53k).
- Recommended offer: $51k (3.0% below list) — sets the bar for market timing.
- Cap rate 14.0% vs local median 4.3% in Delray Beach — top-decile yield for the area; either an underpriced asset or a hidden risk that comps aren't pricing in. Stress-test before assuming the spread holds.
Location & tenants
- Location reads 77/100 on livability (#202 in FL, #3,160 nationally) — a middle-class / working-renter tenant base. Strengths: housing A+, health & safety A+, commute A-; Watch: cost of living C-, crime D-, amenities F.
- Palm Beach (suburban): math 46% / reading 53% proficiency, ranked #34 of 73 in FL (top 47%) — families likely to look elsewhere, expect single-tenant / working-renter base with shorter leases.
- Zoned schools: Orchard View Elementary School (math 48% / reading 47%, grade D, #1,182 of 2,144 statewide, top 55%, 596 students, 76% FRL); Spanish River Community High School (math 64% / reading 74%, grade B, #63 of 667 statewide, top 10%, 2,578 students, 25% FRL) — zoned schools at 50% FRL track the district average.
- Market conditions: Rents flat; 577 active listings in the ZIP; 40 comparable units currently listed for rent nearby; rentals at typical pace (median 24d on market — plan ~3-4 weeks tenant-placement turnaround); solid renter incomes; 3,974 units permitted in Palm Beach County in 2024 (1,012 in 5+ unit buildings).
Forward outlook
- In year one you build about $729 of equity ($366 loan paydown + $363 appreciation (0.7% local appreciation)).
- Palm Beach County population projected at +30% by 2050 — long-run rental-demand tailwind backs the buy-and-hold thesis.
- At projected returns (0.7% appreciation + 0.5% rent growth), your $15k cash investment doubles in ~4 years — after that, you're playing with house money.
Negotiation context
- It's been on market 41 days — a 3% lower offer ($51k) is reasonable based on typical stale-listing flexibility.
- 7 sale attempts since 21y ago with the ask held roughly flat each time — persistent listings suggest the price (not the market) is what's stuck; bring a comps-based counter.
- Current owner paid $43k; 23% above their basis — modest negotiation headroom, anchor on the comps not their cost.
Risks & watch-outs
- Watch-outs: HOA is 37% of rent.
- Climate carrying-cost: severe wind risk, 99% chance of damaging wind over 30y; extreme-heat days projected 6→22/yr by 2055 (HVAC capex compounding) — expect insurance premiums to compound above CPI over the hold.
Questions for the listing agent
- It's been on market 41 days. Have you received any prior offers? Is the seller open to a 3% concession, seller financing, or rate buy-down credit?
- Built in 1973 — when were the roof, HVAC, electrical panel, plumbing, and water heater last replaced?
- What does the HOA fee cover, when was the last increase, and are there any pending special assessments or reserve-fund shortfalls?
- Any open or pending special assessments — roof, HVAC, plumbing, elevator, façade? What's the per-unit balance and payoff schedule, and is the seller paying it off at close or rolling it to the buyer?
- Is there a deadline driving the sale (1031 exchange, divorce, estate, relocation)? That informs how much negotiation room exists.
- Schools are B-rated — typically a magnet for longer-tenancy family renters. What's the average tenant stay here, and is there a school-zone premium baked into asking?
- Crime grade is D in this area — have there been break-ins, vandalism, or insurance claims at this property in the last 3 years? What carrier currently insures it and at what premium?
- What's the average days-on-market for RENTAL listings here right now (not sales)? A rising rental-DOM trend means longer vacancies and softer asking-rent achievability than the comps imply.
- What's the recent tenant-quality profile in this submarket — average credit score on applications, eviction rate, late-payment / NSF rate, and stable-employment percentage? A property-management company in the area should have these aggregated.
- How much new apartment / multifamily construction is in the pipeline within 1–3 miles? Heavy new supply (>2% of stock underway) typically softens rents 12–24 months out; light construction supports rent growth.
Investment metrics
- 1% rule
- 3.30% ✓
- Cap rate
- 13.95%
- Cash-on-cash
- 27.35%
- DSCR
- 2.22
- GRM
- 2.5
CMA / ARV
No comps found within radius.
Projected returns pro-forma
0.69% appreciation · 0.51% rent growth · sell at horizon
- IRR
- 25.0%
- Equity multiple
- 2.21×
- Total profit
- $17,867
- Equity at exit
- $17,202
- IRR
- 25.2%
- Equity multiple
- 3.52×
- Total profit
- $37,355
- Equity at exit
- $22,212
Cash invested: $14,812 (down + closing). Projections, not guarantees.
Landlord ↔ Tenant lean methodology
- Overall (STATE)
- 87 Strongly Landlord-Friendly
- State Florida
- 87 Strongly Landlord-Friendly · R+3
- County
- — inherits STATE
- City
- — inherits STATE
ZIP-level market 33446
- Home prices YoY
- 0.3%
- Rents YoY
- 0.5%
- Active inventory
- 577
- Price-to-rent
- 2.5×
Monthly cashflow live
- Estimated rent
- $1,744 high interval (Pro) →
- Mortgage (P&I)
- −$277
- Tax from tax record
- −$103 /mo · $1,240/yr
- Insurance
- −$22
- HOA
- −$637
- Vacancy / Maint / Mgmt
- −$366
- Net cashflow
- $338
Break-even live
UW: 25.0% down · 7.5% · 30yr · 1.5% tax · 5.0% vac · 8.0% maint · 8.0% mgmt
Financing live
Cash to close
- Down payment
- $13,225
- Closing costs
- $1,587
- Reserves months
- —
- Total cash needed
- —
Loan-product check · same deal, 3 products live
Conventional
25% down · 7.5% · 30yr
- Down + closing
- —
- Monthly P&I
- —
- Monthly cashflow
- —
- DSCR
- —
- Eligible?
- —
Personal DTI + credit; lowest rate.
DSCR
20% down · 8.5% · 30yr
- Down + closing
- —
- Monthly P&I
- —
- Monthly cashflow
- —
- DSCR
- —
- Eligible?
- —
No personal income docs; deal must DSCR.
Hard money
10% down · 12.0% · 12mo
- Down + closing
- —
- Monthly P&I
- —
- Monthly cashflow
- —
- DSCR
- —
- Eligible?
- —
Short-term bridge; refi at stabilization.
Rent comps 40 comps
| Address | Beds | Baths | Sqft | Rent | $/sqft | DOM | Units | Dist |
|---|---|---|---|---|---|---|---|---|
| 419 Brittany I Delray Beach, FL | 1.0 | 1.5 | 720 | $1,450 | $2.01 | 24d | 1 | 0.03mi |
| 568 Brittany L Delray Beach, FL | 2.0 | 2.0 | 883 | $1,950 | $2.21 | 24d | 1 | 0.03mi |
| 564 Brittany L Delray Beach, FL | 2.0 | 2.5 | 880 | $1,800 | $2.05 | 24d | 1 | 0.03mi |
| 233 Brittany F Unit F Delray Beach, FL | 2.0 | 2.0 | 988 | $1,600 | $1.62 | 24d | 1 | 0.03mi |
| 159 Brittany Ter Unit 159 Delray Beach, FL | 1.0 | 1.5 | 720 | $1,795 | $2.49 | 16d | 1 | 0.03mi |
| 270 Brittany F Unit F Delray Beach, FL | 1.0 | 1.5 | 720 | $1,600 | $2.22 | 7d | 1 | 0.03mi |
| 292 Brittany Ave #292 Delray Beach, FL | 2.0 | 2.0 | 880 | $1,700 | $1.93 | 3d | 1 | 0.03mi |
| 260 Brittany F Unit F Delray Beach, FL | 2.0 | 2.0 | 880 | $1,600 | $1.82 | 2d | 1 | 0.03mi |
| 233 Brittany F Unit F Delray Beach, FL | 2.0 | 2.0 | 988 | $1,600 | $1.62 | 7d | 1 | 0.03mi |
| 537 Brittany K Unit 537 Delray Beach, FL | 2.0 | 2.0 | 880 | $1,700 | $1.93 | 24d | 1 | 0.03mi |
| 233 Brittany Dr Unit 233 Delray Beach, FL | 2.0 | 2.0 | 988 | $1,700 | $1.72 | 24d | 1 | 0.03mi |
| 417 Brittany Dr #417 Delray Beach, FL | 2.0 | 2.0 | 880 | $1,750 | $1.99 | 20d | 1 | 0.06mi |
| 318 Monaco G Delray Beach, FL | 2.0 | 2.0 | 907 | $2,200 | $2.43 | 24d | 1 | 0.09mi |
| 286 Monaco F Delray Beach, FL | 1.0 | 2.0 | 726 | $1,700 | $2.34 | 24d | 1 | 0.09mi |
| 276 Monaco F Delray Beach, FL | 2.0 | 2.0 | 883 | $1,650 | $1.87 | 24d | 1 | 0.09mi |
| 72 Monaco Blvd Unit 72 Delray Beach, FL | 2.0 | 2.0 | 880 | $1,950 | $2.22 | 22d | 1 | 0.09mi |
| 58 Monaco Blvd Unit 58 Delray Beach, FL | 1.0 | 1.5 | 720 | $1,650 | $2.29 | 24d | 1 | 0.09mi |
| 459 Monaco J #459 Delray Beach, FL | 1.0 | 1.5 | 720 | $1,400 | $1.94 | 1d | 1 | 0.12mi |
| 195 Monaco E Delray Beach, FL | 1.0 | 1.5 | 728 | $1,550 | $2.13 | 24d | 1 | 0.13mi |
| 11 Brittany a Delray Beach, FL | 1.0 | 1.5 | 725 | $1,500 | $2.07 | 7d | 1 | 0.13mi |
| 711 Monaco O Delray Beach, FL | 1.0 | 1.5 | 720 | $1,550 | $2.15 | 24d | 1 | 0.15mi |
| 459 Monaco Blvd Unit 459 Delray Beach, FL | 1.0 | 1.5 | 720 | $1,500 | $2.08 | 20d | 1 | 0.15mi |
| 581 Monaco Blvd Unit 581 Delray Beach, FL | 2.0 | 2.0 | 880 | $2,000 | $2.27 | 24d | 1 | 0.15mi |
| 451 Monaco Blvd Unit J Delray Beach, FL | 1.0 | 1.5 | 720 | $1,599 | $2.22 | 24d | 1 | 0.15mi |
| 399 Brittany I Delray Beach, FL | 1.0 | 1.5 | 720 | $1,450 | $2.01 | 18d | 1 | 0.16mi |
| 399 Brittany I Delray Beach, FL | 1.0 | 1.5 | 720 | $1,450 | $2.01 | 12d | 1 | 0.16mi |
| 482 Monaco Blvd #482 Delray Beach, FL | 1.0 | 1.5 | 726 | $1,400 | $1.93 | 24d | 1 | 0.16mi |
| 153 Monaco D Delray Beach, FL | 2.0 | 2.0 | 880 | $1,750 | $1.99 | 16d | 1 | 0.16mi |
| 675 Brittany O Delray Beach, FL | 1.0 | 1.5 | 720 | $1,500 | $2.08 | 24d | 1 | 0.16mi |
| 401 Monaco Way Unit 401 Delray Beach, FL | 2.0 | 2.0 | 920 | $1,950 | $2.12 | 24d | 1 | 0.17mi |
| 686 Brittany O Delray Beach, FL | 1.0 | 1.5 | 720 | $1,600 | $2.22 | 24d | 1 | 0.18mi |
| 718 Brittany Park #718 Delray Beach, FL | 1.0 | 1.5 | 720 | $1,795 | $2.49 | 16d | 1 | 0.20mi |
| 569 Monaco L Delray Beach, FL | 2.0 | 2.0 | 880 | $1,500 | $1.70 | 24d | 1 | 0.21mi |
| 679 Saxony Way Delray Beach, FL | 1.0 | 1.5 | 720 | $1,600 | $2.22 | 5d | 1 | 0.25mi |
| 715 Saxony O Delray Beach, FL | 1.0 | 1.5 | 726 | $1,200 | $1.65 | 24d | 1 | 0.26mi |
| 669 Monaco N Delray Beach, FL | 2.0 | 2.0 | 880 | $1,700 | $1.93 | 24d | 1 | 0.26mi |
| 596 Saxony M Delray Beach, FL | 2.0 | 2.0 | 883 | $1,400 | $1.59 | 14d | 1 | 0.27mi |
| 468 Saxony J Delray Beach, FL | 2.0 | 2.0 | 907 | $1,850 | $2.04 | 24d | 1 | 0.28mi |
| 185 Valencia H Delray Beach, FL | 2.0 | 2.0 | 883 | $1,700 | $1.93 | 24d | 1 | 0.28mi |
| 175 Valencia H Delray Beach, FL | 1.0 | 1.5 | 726 | $1,500 | $2.07 | 7d | 1 | 0.28mi |
HOA detail condo
- Monthly dues
- $637 · $7,644/yr
- Likely covers
- waterpoolgym
- Assessments
- None detected in remarks — confirm with the listing agent.
Listing history 13 events
-
2026-06-18days on market $52,900 Active 41 DOM
-
2026-06-17days on market $52,900 Active 40 DOM
-
2026-06-16days on market $52,900 Active 39 DOM
-
2026-06-15days on market $52,900 Active 38 DOM
-
2026-06-13days on market $52,900 Active 36 DOM
-
2026-06-09days on market $52,900 Active 32 DOM
-
2026-06-08days on market $52,900 Active 31 DOM
-
2026-06-07days on market $52,900 Active 30 DOM
-
2026-06-04days on market $52,900 Active 27 DOM
-
2026-06-03days on market $52,900 Active 26 DOM
-
2026-06-02days on market $52,900 Active 25 DOM
-
2026-06-02remarks 611-char remark
-
2026-06-02$52,900 Active 24 DOM
ⓘ Source: listings_history table (triggers on properties + properties_extension) + one-shot
backfill from property_details.listing_events for pre-trigger history.
Tax reassessment forecast FL · Resets to sale price
- Current annual tax
- $1,240 · $103/mo
- Projected year-2 tax
- $1,240 · $103/mo
- Expected delta
- $0/yr ($0/mo · 0.0%)
ⓘ Screening estimate from a state-policy table — verify with the county assessor before closing.
Climate risk First Street
- Flood 1/10 Low FEMA zone X (unshaded) · 0% chance over 30 yrs
- Wildfire 1/10 Low
- Heat 9/10 Extreme 6 d/yr ≥107°F today · 22 d/yr by 30 yrs out
- Wind 10/10 Extreme 99% chance of damaging wind over 30 yrs
- Air quality 2/10 Low 2 unhealthy d/yr today · 2 by 30 yrs out
Nearby sold comps map
Loading sold comps map…
Walkable amenities ~0.75 mi
Loading nearby amenities…
Taxation est. · year 1
- Rental income
- $20,924
- − Mortgage interest
- −$2,963
- − Property taxes
- −$1,240
- − Insurance
- −$264
- − Repairs & maintenance
- −$1,674
- − Management
- −$1,674
- − HOA
- −$7,644
- − Depreciation
- −$1,539
- Taxable income
- $3,925
- Est. tax owed @ 24.0%
- −$942
- After-tax cash flow
- $3,110/yr
For passive investors: Depreciation is non-cash, so a rental often shows a tax loss while cash-flowing — sheltering income. Rental losses are passive: they offset passive income freely, and up to $25,000/yr can offset ordinary (W-2) income if you actively participate and your MAGI is under $100k (phasing out to $0 by $150k); unused losses carry forward. On sale, claimed depreciation is recaptured at up to 25%, and gains may owe capital-gains tax (a 1031 exchange can defer both). Figures are a year-1 estimate at your 24.0% rate — not tax advice; consult a CPA.
Schools (NCES district)
- District
- Palm Beach
- NCES district ID
- 1201500
- Math proficiency
- 46% ▼ -16.00%
- Reading proficiency
- 53% ▼ -4.00%
- Median HH income
- $53,943
- Composite
- 42.72/100
- National rank
- #3160
- State rank
- #34 of 73 in FL
Livability — Delray Beach
- Score
- 77/100
- State rank
- #202
- US rank
- #3160
Category grades
Schools grade is shown separately in the Schools card above.
Census & demographics
- County
- Palm Beach County · 1,438,312 people
- City population
- 123,167
- Metro
- Miami-Fort Lauderdale-Pompano Beach, FL
- Population (ZIP)
- 28,431
- Household income
- $80,187
- Rent vs Own
- Severe rent burden
- 494.0
Population outlook (Palm Beach County) Hauer SSP2
- Today (2025)
- 1,637,487 people
- By 2030
- 1,743,255 · +6.5%
- By 2040
- 1,948,712 · +19.0%
- By 2050
- 2,132,979 · +30.3%
- By 2075
- 2,530,027 · +54.5%
- By 2100
- 2,706,979 · +65.3%
Race, ethnicity, and origin ACS 2023
- Neighborhood character
- Predominantly White (79%)
- Race & ethnicity
- White 79% Hispanic / Latino 13% Two or more races 9% Black 4%
- Hispanic origin (detail)
- Puerto Rican 3% Dominican 1%
- Common ancestry
- Romanian 9% Scotch-Irish 9% Italian 2%
- Foreign-born
- 20% · Canada, Jamaica, Guatemala
- Languages at home
- 80% English-only · Spanish 12% Other Indo-European 2% French/Haitian/Cajun 2%
Political lean MEDSL · Palm Beach
- 2024 margin
- Toss-up / Even · D 50.0% · R 49.2%
- 2008→2024 swing
- -22.1pp toward R · 2008: 22.9pp · 2024: 0.8pp
- All cycles
- 2024: D+0.8 2020: D+12.8 2016: D+15.3 2012: D+17.0 2008: D+22.9
Not yet ingested
- Civics
- —
Market trends
- HPI YoY
- ▲ 0.69%
- Current HPI
- 242.5138
- Rent YoY
- ▲ 0.51%
- Metro
- Miami-Fort Lauderdale-Pompano Beach, FL
- State GDP YoY
- ▲ 3.28%
- F500 in state
- 36
Industry mix (Fortune 500 HQ in FL)
| Industry | F500 HQs | Revenue |
|---|---|---|
| Industrial Technology | 2 | $29B |
|
||
| Insurance | 2 | $17B |
|
||
| Retail | 1 | $60B |
|
||
| Technology Distribution | 1 | $58B |
|
||
| Homebuilding | 1 | $35B |
|
||
| Technology Manufacturing | 1 | $35B |
|
||
Price history
+306.9% since first listed21 events — show timeline
- 2026-05-28 Price Changed $52,900 Beaches MLS
- 2026-05-23 Price Changed $53,900 Beaches MLS
- 2026-05-08 Listed $54,900 Beaches MLS
- 2026-04-10 Sold (Public Records) $43,000 Public Records
- 2022-10-15 Sold (Public Records) $132,500 Public Records
- 2021-01-01 Listing Removed — Beaches MLS
- 2020-07-22 Listed $63,000 Beaches MLS
- 2017-12-05 Sold (Public Records) $44,000 Public Records
- 2013-09-22 Listing Removed — Beaches MLS
- 2013-09-21 Listing Removed — Beaches MLS
- 2013-09-21 Listing Removed — Beaches MLS
- 2011-06-02 Sold (MLS) $10,500 Beaches MLS
- 2011-04-26 Listing Removed — Beaches MLS
- 2011-04-07 Listed $9,999 Beaches MLS
- 2011-03-31 Listing Removed — Beaches MLS
- 2010-05-01 Listed $12,000 Beaches MLS
- 2007-03-31 Listed $63,500 Beaches MLS
- 2006-11-21 Listed $69,900 Beaches MLS
- 2005-11-09 Listed $63,500 Beaches MLS
- 1990-12-31 Sold (Public Records) $21,000 Public Records
- 1973-01-01 Sold (Public Records) $13,000 Public Records
Property tax history
+9.4%/yrLatest (2025): $1,240 · -20.6% YoY. Source: county tax records.
Cash-flow waterfall
monthlySold comps — $/sqft
last 12 mo · ≤1 miLoading sold comps…