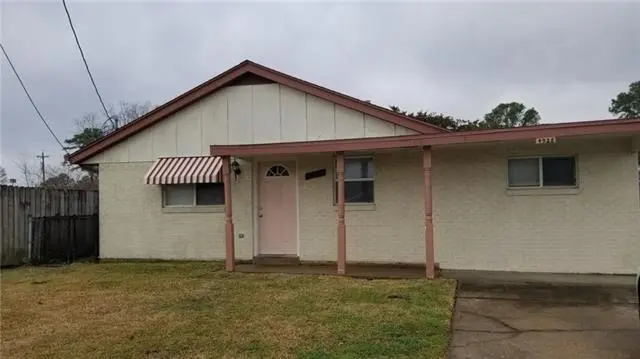
4928 Sandalwood St · New Orleans, LA
Flood risk 9/10 · Severe
- FEMA flood zone
- X (shaded)
- Chance of flooding over 30 yrs
- 0.6%
- Est. flood insurance / yr
- $507 – $1,088
Fire risk 1/10 · Minimal
- Est. fire insurance / yr
- $1,269 – $2,357
Heat risk 10/10 · Severe
- Hot days now (above 107°F)
- 7 days/yr
- Hot days in 30 yrs
- 21 days/yr
Wind risk 10/10 · Severe
- Chance of severe wind over 30 yrs
- 99.0%
Air-quality risk 3/10 · Minor
- Unhealthy air days now
- 3 days/yr
- Unhealthy air days in 30 yrs
- 3 days/yr
Risk factors via First Street. Map © Google.
Why this score? — see what drove the B- grade
The composite is a weighted blend of 9 inputs, each scored 0–100. Each bar is that input's sub-score; the figure is the points it added to the 100-point composite (weight × sub-score).
- Cash flow +25.8/30.0
- ARV discount +15.0/15.0
- DSCR +8.6/10.0
- 1% rule +6.3/10.0
- Livability +4.0/5.0
- Rent growth +2.5/5.0
- Condition / age +2.5/5.0
- Schools +1.6/10.0
- Appreciation +0.0/10.0
$135,000
🖨 Deal sheet 📄 Offer letter ✓ Due diligence
Listing remarks MLS
Charming 3-Bedroom Home with Open Concept Living! This well-maintained 3-bedroom, 1.5-bathroom home offers a spacious open-concept floor plan with tile flooring throughout for easy maintenance. The inviting kitchen features a wrap-around bar, providing ample counter space and seating--great for casual dining and/or entertaining. The home also includes a covered carport for convenient parking and a large fenced yard, offering plenty of space for outdoor activities, pets, or gardening. Multiple schools within walking distance. Quick access to interstate and just a short drive from New Orleans. Property is currently leased with $1100/mth income. Sold by Owner/Agent
Key facts
- Covered carport
- Wrap-around bar
- Large fenced yard
Tags
Neighborhood map
What this means for you Summary
Snapshot
- This is a 3-bed/2.0-bath single-family listed at $135k.
Deal economics
- At list price, monthly cash flow is $260 ($3k/yr) — positive.
- The deal already cash-flows at list — no discount required.
- Meets the 1% rule at list price ($2k rent vs $135k).
- Recommended offer: $123k (9.0% below list) — sets the bar for market timing.
- Cap rate 9.2% vs local median 4.4% in New Orleans — top-decile yield for the area; either an underpriced asset or a hidden risk that comps aren't pricing in. Stress-test before assuming the spread holds.
Location & tenants
- Location reads 81/100 on livability (#3 in LA, #1,383 nationally) — a professional / high-income tenant draw. Strengths: amenities A+, commute A+, health & safety A+; Watch: crime C-, employment D.
- Orleans Parish (urban): math 11% / reading 27% proficiency, ranked #69 of 98 in LA (top 70%) — low school quality limits family demand, transient renter base, plan for 1-2y turnover; 68% free/reduced lunch — lower-income household profile, screen leases tightly.
- Market conditions: 128 active listings in the ZIP; 21 comparable units currently listed for rent nearby; rentals at typical pace (median 24d on market — plan ~3-4 weeks tenant-placement turnaround); lower-income renter base — watch delinquency; 710 units permitted in Orleans Parish in 2024 (244 in 5+ unit buildings).
- This rent runs 45% of the median local income ($41k/yr) — at the standard rent-burdened threshold; future hikes will face affordability resistance.
Forward outlook
- Local home prices are declining (-3.0%/yr); year-one equity from $933 of loan paydown is wiped out by about $4k of value loss. Plan a longer hold.
- Orleans County population projected at +61% by 2050 — long-run rental-demand tailwind backs the buy-and-hold thesis.
Negotiation context
- It's been on market 107 days — a 9% lower offer ($123k) is reasonable based on typical stale-listing flexibility.
- 3 sale attempts with the ask held roughly flat each time — persistent listings suggest the price (not the market) is what's stuck; bring a comps-based counter.
Risks & watch-outs
- Watch-outs: flood insurance adds $66/mo.
- Climate carrying-cost: severe flood risk; severe wind risk, 99% chance of damaging wind over 30y; extreme-heat days projected 7→21/yr by 2055 (HVAC capex compounding) — expect insurance premiums to compound above CPI over the hold.
Questions for the listing agent
- It's been on market 107 days. Have you received any prior offers? Is the seller open to a 9% concession, seller financing, or rate buy-down credit?
- Built in 1960 — when were the roof, HVAC, electrical panel, plumbing, and water heater last replaced?
- What's the actual annual flood-insurance premium (NFIP or private), and is the property in a SFHA with mandatory coverage?
- Why hasn't it sold? Are there any deal-killer items the seller is aware of (foundation, flood, title, zoning, code violations)?
- Is there a deadline driving the sale (1031 exchange, divorce, estate, relocation)? That informs how much negotiation room exists.
- What's the average days-on-market for RENTAL listings here right now (not sales)? A rising rental-DOM trend means longer vacancies and softer asking-rent achievability than the comps imply.
- What's the recent tenant-quality profile in this submarket — average credit score on applications, eviction rate, late-payment / NSF rate, and stable-employment percentage? A property-management company in the area should have these aggregated.
- How much new for-sale + rental construction is in the pipeline within 1–3 miles? Heavy new supply typically softens prices + rents 12–24 months out; constrained supply supports both.
Investment metrics
- 1% rule
- 1.13% ✓
- Cap rate
- 9.19%
- Cash-on-cash
- 10.35%
- DSCR
- 1.46
- GRM
- 7.4
CMA / ARV
- ARV (median comp)
- $179,468
- List price
- $135,000
- Delta
- -24.78%
- Verdict
- UNDERPRICED
- Comps
- 20 within 1.0 mi
Show comp detail 12 sales within ~0.75 mi
| Address | Dist | Beds/Ba | Sqft | Sold | Price | $/sf | Match |
|---|---|---|---|---|---|---|---|
| 4818 Sandalwood St | 0.14mi | 4/2.0 (+1) | 1,297 (-3%) | 12mo | $170,000 | $131 | 74 |
| 4901 Cardenas St | 0.30mi | 3/2.0 | 1,412 (+6%) | 9mo | $185,000 | $131 | 69 |
| 4927 Sandalwood St | 0.03mi | 4/2.5 (+1) | 1,481 (+11%) | 7mo | $260,000 | $176 | 68 |
| 5001 Warren Dr | 0.26mi | 3/1.5 | 1,397 (+4%) | 13mo | $165,000 | $118 | 68 |
| 10131 Springwood St | 0.35mi | 3/2.0 | 1,418 (+6%) | 12mo | $252,950 | $178 | 64 |
| 4651 Lurline St | 0.32mi | 3/2.0 | 1,224 (-8%) | 11mo | $158,000 | $129 | 62 |
| 5011 Hauck Dr | 0.48mi | 3/2.0 | 1,405 (+5%) | 10mo | $205,450 | $146 | 61 |
| 4844 Sierra Madre Dr | 0.34mi | 3/2.0 | 1,518 (+14%) | 2mo | $195,000 | $128 | 60 |
| 10118 Springwood St | 0.37mi | 3/2.0 | 1,228 (-8%) | 12mo | $167,000 | $136 | 59 |
| 4635 Longfellow Dr | 0.59mi | 3/2.0 | 1,530 (+14%) | 1mo | $225,000 | $147 | 48 |
| 10700 Vienna St | 0.57mi | 3/2.0 | 1,508 (+13%) | 8mo | $120,000 | $80 | 46 |
| 4897 Cerise Ave | 0.66mi | 3/2.0 | 1,536 (+15%) | 6mo | $170,000 | $111 | 39 |
Match score weights: distance 35% · size 25% · config 20% · recency 20%. Top-matched comps best support the ARV.
Projected returns pro-forma
-3.0% appreciation · 3.0% rent growth · sell at horizon
- IRR
- -3.7%
- Equity multiple
- 0.86×
- Total profit
- $-5,310
- Equity at exit
- $20,129
- IRR
- 6.0%
- Equity multiple
- 1.44×
- Total profit
- $16,791
- Equity at exit
- $11,672
Cash invested: $37,800 (down + closing). Projections, not guarantees.
Landlord ↔ Tenant lean methodology
- Overall (STATE)
- 90 Strongly Landlord-Friendly
- State Louisiana
- 90 Strongly Landlord-Friendly · R+12
- County
- — inherits STATE
- City
- — inherits STATE
ZIP-level market 70127
- Home prices YoY
- -29.2%
- Active inventory
- 128
- Price-to-rent
- 7.4×
Monthly cashflow live
- Estimated rent
- $1,525 high interval (Pro) →
- Mortgage (P&I)
- −$708
- Tax from tax record
- −$114 /mo · $1,374/yr
- Insurance
- −$56
- Flood insurance flood zone
- −$66 /mo · $798/yr
- HOA
- −$0
- Vacancy / Maint / Mgmt
- −$320
- Net cashflow
- $260
Break-even live
UW: 25.0% down · 7.5% · 30yr · 1.5% tax · 5.0% vac · 8.0% maint · 8.0% mgmt
Financing live
Cash to close
- Down payment
- $33,750
- Closing costs
- $4,050
- Reserves months
- —
- Total cash needed
- —
Loan-product check · same deal, 3 products live
Conventional
25% down · 7.5% · 30yr
- Down + closing
- —
- Monthly P&I
- —
- Monthly cashflow
- —
- DSCR
- —
- Eligible?
- —
Personal DTI + credit; lowest rate.
DSCR
20% down · 8.5% · 30yr
- Down + closing
- —
- Monthly P&I
- —
- Monthly cashflow
- —
- DSCR
- —
- Eligible?
- —
No personal income docs; deal must DSCR.
Hard money
10% down · 12.0% · 12mo
- Down + closing
- —
- Monthly P&I
- —
- Monthly cashflow
- —
- DSCR
- —
- Eligible?
- —
Short-term bridge; refi at stabilization.
Rent comps 21 comps
| Address | Beds | Baths | Sqft | Rent | $/sqft | DOM | Units | Dist |
|---|---|---|---|---|---|---|---|---|
| 5000 Cardenas Dr New Orleans, LA | 3.0 | 2.0 | 1800 | $1,920 | $1.07 | 23d | 1 | 0.31mi |
| 5131 Bundy Rd New Orleans, LA | 1.0–3.0 | 1.0–2.0 | 1000 | $1,314 | $1.31 | 2d | 21 | 0.41mi |
| 10704 Roger Dr Unit D New Orleans, LA | 2.0 | 1.5 | 1050 | $950 | $0.90 | 23d | 1 | 1.08mi |
| 9042 Bunker Hill Rd New Orleans, LA | 3.0 | 1.5 | 1400 | $1,450 | $1.04 | 16d | 1 | 1.11mi |
| 9040 Bunker Hill Rd New Orleans, LA | 3.0 | 1.5 | 1400 | $1,450 | $1.04 | 16d | 1 | 1.11mi |
| 9022 Bunker Hill Rd New Orleans, LA | 3.0 | 1.5 | 1400 | $1,400 | $1.00 | 23d | 1 | 1.11mi |
| 9020 Bunker Hill Rd New Orleans, LA | 3.0 | 1.5 | 1400 | $1,400 | $1.00 | 23d | 1 | 1.12mi |
| 10821 Roger Dr Unit A New Orleans, LA | 2.0 | 1.5 | 1200 | $1,400 | $1.17 | 23d | 1 | 1.15mi |
| 10940 Roger Dr Unit A New Orleans, LA | 2.0 | 2.0 | 1000 | $900 | $0.90 | 23d | 1 | 1.17mi |
| 11040 Roger Dr Unit C New Orleans, LA | 2.0 | 2.5 | 1505 | $1,500 | $1.00 | 23d | 1 | 1.21mi |
| 6910 Bunker Hill Rd New Orleans, LA | 3.0 | 2.5 | 1785 | $1,400 | $0.78 | 20d | 1 | 1.22mi |
| 7063 Boston Dr New Orleans, LA | 4.0 | 2.5 | 1750 | $1,900 | $1.09 | 16d | 1 | 1.27mi |
| 4923 Eastview Dr New Orleans, LA | 3.0 | 2.0 | 912 | $1,400 | $1.54 | 23d | 1 | 1.31mi |
| 7201 Salem Dr New Orleans, LA | 3.0 | 2.5 | 1764 | $1,650 | $0.94 | 23d | 1 | 1.34mi |
| 4828 Eastview Dr New Orleans, LA | 4.0 | 2.0 | 1260 | $1,675 | $1.33 | 23d | 1 | 1.34mi |
| 7019 Crowder Blvd Unit 126 New Orleans, LA | 2.0 | 1.5 | 952 | $982 | $1.03 | 23d | 1 | 1.37mi |
| 4901 Bonita Dr New Orleans, LA | 2.0 | 1.0 | 900 | $1,100 | $1.22 | 23d | 1 | 1.43mi |
| 7230 Yorktown Dr New Orleans, LA | 3.0 | 2.0 | 1550 | $1,600 | $1.03 | 16d | 1 | 1.43mi |
| 7230 Yorktown Dr New Orleans, LA | 3.0 | 2.0 | 1550 | $1,600 | $1.03 | 23d | 1 | 1.43mi |
| 9002 Morrison Rd New Orleans, LA | 2.0 | 1.5 | 1050 | $1,150 | $1.10 | 20d | 1 | 1.44mi |
| 8802 Morrison Rd New Orleans, LA | 2.0 | 1.0 | 1071 | $1,275 | $1.19 | 23d | 1 | 1.49mi |
Listing history 20 events
-
2026-06-08days on market $135,000 Active 107 DOM
-
2026-06-07days on market $135,000 Active 106 DOM
-
2026-06-05days on market $135,000 Active 103 DOM
-
2026-06-03days on market $135,000 Active 102 DOM
-
2026-06-02days on market $135,000 Active 101 DOM
-
2026-06-01days on market $135,000 Active 100 DOM
-
2026-05-31days on market $135,000 Active 99 DOM
-
2026-02-21$135,000 Active 670-char remark
Show marketing remark (675 chars)
Charming 3-Bedroom Home with Open Concept Living! This well-maintained 3-bedroom, 1.5-bathroom home offers a spacious open-concept floor plan with tile flooring throughout for easy maintenance. The inviting kitchen features a wrap-around bar, providing ample counter space and seating—great for casual dining and/or entertaining. The home also includes a covered carport for convenient parking and a large fenced yard, offering plenty of space for outdoor activities, pets, or gardening. Multiple schools within walking distance. Quick access to interstate and just a short drive from New Orleans. Property is currently leased with $1100/mth income. Sold by Owner/Agent
-
2026-02-21$135,000 Active 675-char remark
Show marketing remark (675 chars)
Charming 3-Bedroom Home with Open Concept Living! This well-maintained 3-bedroom, 1.5-bathroom home offers a spacious open-concept floor plan with tile flooring throughout for easy maintenance. The inviting kitchen features a wrap-around bar, providing ample counter space and seating—great for casual dining and/or entertaining. The home also includes a covered carport for convenient parking and a large fenced yard, offering plenty of space for outdoor activities, pets, or gardening. Multiple schools within walking distance. Quick access to interstate and just a short drive from New Orleans. Property is currently leased with $1100/mth income. Sold by Owner/Agent
-
2025-09-08price $129,500
-
2025-09-08price $129,500
-
2025-06-06price $129,900
-
2025-06-06price $129,900
-
2025-05-10price $139,900
-
2025-05-10price $139,900
-
2025-04-20price $150,000
-
2025-04-19price $150,000
-
2025-04-01price $160,000
-
2025-04-01price $160,000
-
2025-03-18$170,000 Active
ⓘ Source: listings_history table (triggers on properties + properties_extension) + one-shot
backfill from property_details.listing_events for pre-trigger history.
Tax reassessment forecast LA · Resets to sale price
- Current annual tax
- $1,374 · $114/mo
- Projected year-2 tax
- $1,374 · $114/mo
- Expected delta
- $0/yr ($0/mo · 0.0%)
ⓘ Screening estimate from a state-policy table — verify with the county assessor before closing.
Climate risk First Street
- Flood 9/10 Extreme FEMA zone X (shaded) · 60% chance over 30 yrs
- Wildfire 1/10 Low
- Heat 10/10 Extreme 7 d/yr ≥107°F today · 21 d/yr by 30 yrs out
- Wind 10/10 Extreme 99% chance of damaging wind over 30 yrs
- Air quality 3/10 Moderate 3 unhealthy d/yr today · 3 by 30 yrs out
Nearby sold comps map
Loading sold comps map…
Walkable amenities ~0.75 mi
Loading nearby amenities…
Taxation est. · year 1
- Rental income
- $18,300
- − Mortgage interest
- −$7,562
- − Property taxes
- −$1,374
- − Insurance
- −$1,472
- − Repairs & maintenance
- −$1,464
- − Management
- −$1,464
- − Depreciation
- −$3,927
- Taxable income
- $1,036
- Est. tax owed @ 24.0%
- −$249
- After-tax cash flow
- $2,867/yr
For passive investors: Depreciation is non-cash, so a rental often shows a tax loss while cash-flowing — sheltering income. Rental losses are passive: they offset passive income freely, and up to $25,000/yr can offset ordinary (W-2) income if you actively participate and your MAGI is under $100k (phasing out to $0 by $150k); unused losses carry forward. On sale, claimed depreciation is recaptured at up to 25%, and gains may owe capital-gains tax (a 1031 exchange can defer both). Figures are a year-1 estimate at your 24.0% rate — not tax advice; consult a CPA.
Schools (NCES district)
- District
- Orleans Parish
- NCES district ID
- 2201170
- Math proficiency
- 11% ▼ -52.00%
- Reading proficiency
- 27% ▼ -46.00%
- Median HH income
- $37,011
- Composite
- 15.78/100
- National rank
- #9271
- State rank
- #69 of 98 in LA
Livability — New Orleans
- Score
- 81/100
- State rank
- #3
- US rank
- #1383
Category grades
Schools grade is shown separately in the Schools card above.
Census & demographics
- Census place
- New Orleans, LA
- County
- Orleans Parish · 338,817 people
- City population
- 338,817
- Metro
- New Orleans-Metairie, LA
- Population (ZIP)
- 23,107
- Household income
- $40,765
- Rent vs Own
- Severe rent burden
- 2030.0
Population outlook (Orleans County) Hauer SSP2
- Today (2025)
- 513,025 people
- By 2030
- 575,781 · +12.2%
- By 2040
- 700,174 · +36.5%
- By 2050
- 826,541 · +61.1%
- By 2075
- 1,123,374 · +119.0%
- By 2100
- 1,355,609 · +164.2%
Race, ethnicity, and origin ACS 2023
- Neighborhood character
- Predominantly Black (91%)
- Race & ethnicity
- Black 91% Hispanic / Latino 4% Two or more races 4% White 2%
- Common ancestry
- Lithuanian 1% Hispanic 1%
- Foreign-born
- 3% · Canada, Vietnam
- Languages at home
- 96% English-only · Spanish 2%
Political lean MEDSL · Orleans
- 2024 margin
- Solid D (+67.0) · D 82.2% · R 15.2% · Other 2.7%
- 2008→2024 swing
- +6.7pp toward D · 2008: 60.3pp · 2024: 67.0pp
- All cycles
- 2024: D+67.0 2020: D+68.2 2016: D+66.2 2012: D+62.5 2008: D+60.3
Not yet ingested
- Civics
- —
Market trends
- HPI YoY
- ▼ -72.43%
- Current HPI
- 175.4465
- Rent YoY
- —
- Metro
- New Orleans-Metairie, LA
- State GDP YoY
- ▲ 3.29%
- F500 in state
- 10
Industry mix (Fortune 500 HQ in LA)
| Industry | F500 HQs | Revenue |
|---|---|---|
| Telecommunications | 2 | $23B |
|
||
| Utilities | 1 | $12B |
|
||
| Wholesale / Distribution | 1 | $5B |
|
||
| Advertising | 1 | $2B |
|
||
Price history
-20.6% since first listed13 events — show timeline
- 2026-02-21 Listed $135,000 GSREIN
- 2026-02-21 Listed $135,000 AcadianaMLS
- 2025-09-08 Price Changed $129,500 AcadianaMLS
- 2025-09-08 Price Changed $129,500 GSREIN
- 2025-06-06 Price Changed $129,900 AcadianaMLS
- 2025-06-06 Price Changed $129,900 GSREIN
- 2025-05-10 Price Changed $139,900 AcadianaMLS
- 2025-05-10 Price Changed $139,900 GSREIN
- 2025-04-20 Price Changed $150,000 AcadianaMLS
- 2025-04-19 Price Changed $150,000 GSREIN
- 2025-04-01 Price Changed $160,000 AcadianaMLS
- 2025-04-01 Price Changed $160,000 GSREIN
- 2025-03-18 Listed $170,000 AcadianaMLS
Property tax history
-1.3%/yrLatest (2026): $1,374 · +1.1% YoY. Source: county tax records.
Cash-flow waterfall
monthlySold comps — $/sqft
last 12 mo · ≤1 miLoading sold comps…