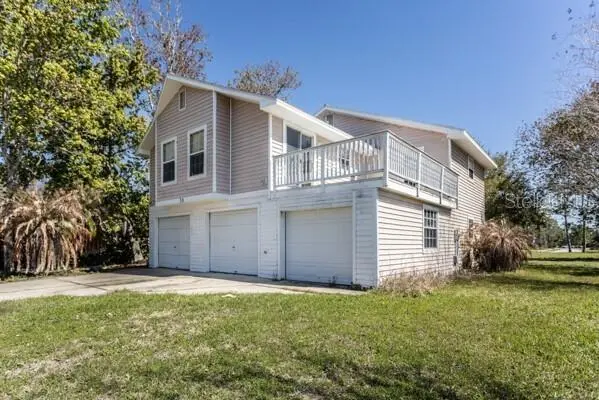
58 Kankakee Trl · Palm Coast, FL
Flood risk 6/10 · Moderate
- FEMA flood zone
- X (unshaded)
- Chance of flooding over 30 yrs
- 0.67%
- Est. flood insurance / yr
- $507 – $1,088
Fire risk 5/10 · Moderate
- Est. fire insurance / yr
- $947 – $1,759
Heat risk 9/10 · Severe
- Hot days now (above 107°F)
- 7 days/yr
- Hot days in 30 yrs
- 21 days/yr
Wind risk 10/10 · Severe
- Chance of severe wind over 30 yrs
- 99.0%
Air-quality risk 3/10 · Minor
- Unhealthy air days now
- 2 days/yr
- Unhealthy air days in 30 yrs
- 3 days/yr
Risk factors via First Street. Map © Google.
Why this score? — see what drove the B grade
The composite is a weighted blend of 9 inputs, each scored 0–100. Each bar is that input's sub-score; the figure is the points it added to the 100-point composite (weight × sub-score).
- Cash flow +26.8/30.0
- ARV discount +15.0/15.0
- DSCR +9.2/10.0
- 1% rule +6.3/10.0
- Schools +4.6/10.0
- Livability +3.5/5.0
- Rent growth +2.8/5.0
- Condition / age +2.5/5.0
- Appreciation +0.0/10.0
$245,900
🖨 Deal sheet 📄 Offer letter ✓ Due diligence
Listing remarks
Under contract-accepting backup offers. Spacious 4BD/3BA split-level home. Priced for a quick sale and ready for some TLC. THE LAYOUT: Upstairs features a living/dining combo, kitchen, master suite, second bedroom/bath, and deck access. The lower level adds 2 bedrooms and a 3rd full bath—perfect for high-resale appeal or rental. THE X-FACTOR: A rare 3-car garage provides a massive value-add for the area. The exterior includes a fenced area for pets. PRIME LOCATION: Strategy is all about convenience. Located seconds from US-1 and within 20 minutes of the beach, hospitals, major shopping, and I-95. Roof 2013, AC 2017 Property needs TLC and is sold AS-IS. This is the high-margin projec
Key facts
- Deck access
- Living dining combo
- Split-level home
Tags
Property features AI
Finance
- Other: Homestead exempt
- HOA & community: Located in the Quail Hollow development
Exterior
- Parking: Attached garage; 3-car garage
- Utilities: Public water; Holding tank sewer; Electricity connected; Cable available; Water service connected
- Home design: Single family residence; Two stories; Faces west; Residential zoning (SFR 3)
- Construction: Vinyl siding; Shingle roof; Slab foundation; Built on lot of about 0.23 acres
- Exterior features: Other exterior features; Asphalt road access
Interior
- Kitchen: Dishwasher; Microwave
- Bedrooms: 4 bedrooms
- Flooring: Concrete floors; Laminate floors
- Bathrooms: 3 full bathrooms
- Heating & cooling: Central heating; Central air conditioning
- Interior features: Ceiling fans; High ceilings; Split bedroom layout; Walk-in closets
- Laundry & utility: Laundry in garage
Neighborhood map
What this means for you Summary
Snapshot
- This is a 4-bed/3.0-bath single-family listed at $246k.
Deal economics
- At list price, monthly cash flow is $677 ($8k/yr) — positive.
- The deal already cash-flows at list — no discount required.
- Meets the 1% rule at list price ($3k rent vs $246k).
- Recommended offer: $239k (3.0% below list) — sets the bar for market timing.
- Cap rate 9.6% vs local median 3.8% in Palm Coast — top-decile yield for the area; either an underpriced asset or a hidden risk that comps aren't pricing in. Stress-test before assuming the spread holds.
Location & tenants
- Location reads 69/100 on livability (#478 in FL) — a middle-class / working-renter tenant base. Strengths: housing A+, health & safety A+, cost of living B+; Watch: amenities F, commute F.
- Flagler (rural): math 53% / reading 56% proficiency, ranked #20 of 73 in FL (top 27%) — acceptable for families but not a draw, mixed tenant base, ~2y average lease.
- Zoned schools: Bunnell Elementary School (math 42% / reading 44%, grade F, #1,366 of 2,144 statewide, top 64%, 1,080 students, 73% FRL); Flagler-Palm Coast High School (math 36% / reading 51%, grade F, #248 of 667 statewide, top 38%, 2,523 students, 52% FRL).
- Market conditions: Rents rising (+1.2%/yr); 1367 active listings in the ZIP; 11 comparable units currently listed for rent nearby; rentals at typical pace (median 21d on market — plan ~3-4 weeks tenant-placement turnaround); solid renter incomes; 2,588 units permitted in Flagler County in 2024 (0 in 5+ unit buildings).
- This rent runs 44% of the median local income ($76k/yr) — at the standard rent-burdened threshold; future hikes will face affordability resistance.
Forward outlook
- Local home prices are declining (-3.0%/yr); year-one equity from $2k of loan paydown is wiped out by about $7k of value loss. Plan a longer hold.
- Flagler County population projected at +28% by 2050 — long-run rental-demand tailwind backs the buy-and-hold thesis.
Negotiation context
- It's been on market 41 days — a 3% lower offer ($239k) is reasonable based on typical stale-listing flexibility.
- 2 sale attempts; this cycle's ask has dropped $14k (5%) from the opening price — seller is motivated, your offer sets the floor, not the list.
Risks & watch-outs
- Climate carrying-cost: major flood risk; severe wind risk, 99% chance of damaging wind over 30y; moderate wildfire risk; extreme-heat days projected 7→21/yr by 2055 (HVAC capex compounding) — expect insurance premiums to compound above CPI over the hold.
Questions for the listing agent
- It's been on market 41 days. Have you received any prior offers? Is the seller open to a 3% concession, seller financing, or rate buy-down credit?
- Is there a deadline driving the sale (1031 exchange, divorce, estate, relocation)? That informs how much negotiation room exists.
- What's the average days-on-market for RENTAL listings here right now (not sales)? A rising rental-DOM trend means longer vacancies and softer asking-rent achievability than the comps imply.
- What's the recent tenant-quality profile in this submarket — average credit score on applications, eviction rate, late-payment / NSF rate, and stable-employment percentage? A property-management company in the area should have these aggregated.
- How much new for-sale + rental construction is in the pipeline within 1–3 miles? Heavy new supply typically softens prices + rents 12–24 months out; constrained supply supports both.
Investment metrics
- 1% rule
- 1.13% ✓
- Cap rate
- 9.60%
- Cash-on-cash
- 11.79%
- DSCR
- 1.52
- GRM
- 7.4
CMA / ARV
- ARV (on-the-fly)
- $323,400
- Comps found
- 12
Show comp detail 12 sales within ~0.75 mi
| Address | Dist | Beds/Ba | Sqft | Sold | Price | $/sf | Match |
|---|---|---|---|---|---|---|---|
| 58 Kankakee Trl | 0.00mi | 4/3.0 | 1,848 (0%) | 0mo | $220,000 | $119 | 100 |
| 65 Kalamazoo Trl | 0.25mi | 4/2.0 | 1,798 (-3%) | 5mo | $315,000 | $175 | 75 |
| 1 Kaslo Ct | 0.06mi | 4/2.0 | 1,684 (-9%) | 6mo | $280,888 | $167 | 74 |
| 5 Kalendar Ct | 0.17mi | 3/2.0 (-1) | 1,764 (-4%) | 4mo | $324,900 | $184 | 72 |
| 3 Kanawha Ct | 0.20mi | 3/2.0 (-1) | 1,808 (-2%) | 8mo | $308,000 | $170 | 72 |
| 75 Kankakee Trl | 0.14mi | 4/2.0 | 2,044 (+11%) | 3mo | $414,990 | $203 | 70 |
| 77 Kankakee Trl | 0.16mi | 3/2.0 (-1) | 2,034 (+10%) | 3mo | $335,000 | $165 | 65 |
| 44 Kalamazoo Trl | 0.42mi | 3/2.0 (-1) | 1,879 (+2%) | 9mo | $317,000 | $169 | 61 |
| 36 Kaywood Pl | 0.56mi | 4/3.0 | 1,969 (+6%) | 4mo | $320,000 | $163 | 60 |
| 5 Kaffee Ct | 0.26mi | 3/2.0 (-1) | 1,662 (-10%) | 9mo | $300,000 | $181 | 55 |
| 76 Kankakee Trl | 0.15mi | 3/2.0 (-1) | 1,614 (-13%) | 10mo | $296,000 | $183 | 55 |
| 12 Kathleen Trl | 0.58mi | 4/2.0 | 2,017 (+9%) | 2mo | $352,500 | $175 | 52 |
Match score weights: distance 35% · size 25% · config 20% · recency 20%. Top-matched comps best support the ARV.
Projected returns pro-forma
-3.0% appreciation · 1.18% rent growth · sell at horizon
- IRR
- -0.7%
- Equity multiple
- 0.97×
- Total profit
- $-1,801
- Equity at exit
- $36,664
- IRR
- 7.1%
- Equity multiple
- 1.49×
- Total profit
- $33,923
- Equity at exit
- $21,261
Cash invested: $68,852 (down + closing). Projections, not guarantees.
Landlord ↔ Tenant lean methodology
- Overall (STATE)
- 87 Strongly Landlord-Friendly
- State Florida
- 87 Strongly Landlord-Friendly · R+3
- County
- — inherits STATE
- City
- — inherits STATE
ZIP-level market 32164
- Home prices YoY
- -6.3%
- Rents YoY
- 1.2%
- Active inventory
- 1367
- Price-to-rent
- 7.4×
Monthly cashflow live
- Estimated rent
- $2,770 high interval (Pro) →
- Mortgage (P&I)
- −$1,290
- Tax from tax record
- −$119 /mo · $1,431/yr
- Insurance
- −$102
- HOA
- −$0
- Vacancy / Maint / Mgmt
- −$582
- Net cashflow
- $677
Break-even live
UW: 25.0% down · 7.5% · 30yr · 1.5% tax · 5.0% vac · 8.0% maint · 8.0% mgmt
Financing live
Cash to close
- Down payment
- $61,475
- Closing costs
- $7,377
- Reserves months
- —
- Total cash needed
- —
Loan-product check · same deal, 3 products live
Conventional
25% down · 7.5% · 30yr
- Down + closing
- —
- Monthly P&I
- —
- Monthly cashflow
- —
- DSCR
- —
- Eligible?
- —
Personal DTI + credit; lowest rate.
DSCR
20% down · 8.5% · 30yr
- Down + closing
- —
- Monthly P&I
- —
- Monthly cashflow
- —
- DSCR
- —
- Eligible?
- —
No personal income docs; deal must DSCR.
Hard money
10% down · 12.0% · 12mo
- Down + closing
- —
- Monthly P&I
- —
- Monthly cashflow
- —
- DSCR
- —
- Eligible?
- —
Short-term bridge; refi at stabilization.
Rent comps 11 comps
| Address | Beds | Baths | Sqft | Rent | $/sqft | DOM | Units | Dist |
|---|---|---|---|---|---|---|---|---|
| 67 Kashmir Trl Unit 1261620P Palm Coast, FL | 3.0 | 3.0 | 2594 | $5,074 | $1.96 | 2d | 1 | 0.28mi |
| 8 Kaiser Pl Palm Coast, FL | 3.0 | 2.5 | 1834 | $2,200 | $1.20 | 21d | 1 | 0.64mi |
| 92 Karas Trl Palm Coast, FL | 4.0 | 2.0 | 1650 | $2,050 | $1.24 | 14d | 1 | 1.00mi |
| 21 Zorach Pl Palm Coast, FL | 3.0 | 2.0 | 1376 | $1,649 | $1.20 | 14d | 1 | 1.07mi |
| 9 Zorro Ct Palm Coast, FL | 4.0 | 3.0 | 2306 | $2,350 | $1.02 | 2d | 1 | 1.09mi |
| 29 Zoeller Ct Palm Coast, FL | 3.0 | 2.0 | 2112 | $1,800 | $0.85 | 23d | 1 | 1.21mi |
| 48 Karas Trl Palm Coast, FL | 3.0 | 2.0 | 1558 | $1,750 | $1.12 | 23d | 1 | 1.24mi |
| 5 Llestone Path Palm Coast, FL | 4.0 | 2.0 | 1867 | $2,200 | $1.18 | 23d | 1 | 1.25mi |
| 6 Lleberry Path Palm Coast, FL | 4.0 | 2.0 | 1867 | $2,200 | $1.18 | 23d | 1 | 1.25mi |
| 28 Karas Trl Palm Coast, FL | 4.0 | 2.0 | 1617 | $2,065 | $1.28 | 23d | 1 | 1.37mi |
| 17 Karas Trl Unit B Palm Coast, FL | 4.0 | 2.0 | 1524 | $1,715 | $1.13 | 2d | 1 | 1.45mi |
Listing history 7 events
-
2026-05-14status Pending
-
2026-05-06price $245,900
-
2026-04-27price $247,900
-
2026-04-16status Active
-
2026-04-03status Pending
-
2026-03-31price $254,900
-
2026-03-21$259,900 Active
ⓘ Source: listings_history table (triggers on properties + properties_extension) + one-shot
backfill from property_details.listing_events for pre-trigger history.
Tax reassessment forecast FL · Resets to sale price
- Current annual tax
- $1,431 · $119/mo
- Projected year-2 tax
- $2,041 · $170/mo
- Expected delta
- +$610/yr (+$51/mo · 42.6%)
ⓘ Screening estimate from a state-policy table — verify with the county assessor before closing.
Climate risk First Street
- Flood 6/10 Major FEMA zone X (unshaded) · 67% chance over 30 yrs
- Wildfire 5/10 Major
- Heat 9/10 Extreme 7 d/yr ≥107°F today · 21 d/yr by 30 yrs out
- Wind 10/10 Extreme 99% chance of damaging wind over 30 yrs
- Air quality 3/10 Moderate 2 unhealthy d/yr today · 3 by 30 yrs out
Nearby sold comps map
Loading sold comps map…
Walkable amenities ~0.75 mi
Loading nearby amenities…
Taxation est. · year 1
- Rental income
- $33,235
- − Mortgage interest
- −$13,774
- − Property taxes
- −$1,431
- − Insurance
- −$1,230
- − Repairs & maintenance
- −$2,659
- − Management
- −$2,659
- − Depreciation
- −$7,153
- Taxable income
- $4,329
- Est. tax owed @ 24.0%
- −$1,039
- After-tax cash flow
- $7,082/yr
For passive investors: Depreciation is non-cash, so a rental often shows a tax loss while cash-flowing — sheltering income. Rental losses are passive: they offset passive income freely, and up to $25,000/yr can offset ordinary (W-2) income if you actively participate and your MAGI is under $100k (phasing out to $0 by $150k); unused losses carry forward. On sale, claimed depreciation is recaptured at up to 25%, and gains may owe capital-gains tax (a 1031 exchange can defer both). Figures are a year-1 estimate at your 24.0% rate — not tax advice; consult a CPA.
Schools (NCES district)
- District
- Flagler
- NCES district ID
- 1200540
- Math proficiency
- 53% ▼ -9.00%
- Reading proficiency
- 56% ▼ -4.00%
- Median HH income
- $48,354
- Composite
- 46.35/100
- National rank
- #2464
- State rank
- #20 of 73 in FL
Livability — Palm Coast
- Score
- 69/100
- State rank
- #478
- US rank
- #8721
Category grades
Schools grade is shown separately in the Schools card above.
Census & demographics
- Census place
- Palm Coast, FL
- County
- Flagler County · 113,412 people
- City population
- 105,049
- Metro
- Deltona-Daytona Beach-Ormond Beach, FL
- Population (ZIP)
- 56,658
- Household income
- $76,399
- Rent vs Own
- Severe rent burden
- 1291.0
Population outlook (Flagler County) Hauer SSP2
- Today (2025)
- 123,474 people
- By 2030
- 131,864 · +6.8%
- By 2040
- 146,176 · +18.4%
- By 2050
- 157,398 · +27.5%
- By 2075
- 177,990 · +44.2%
- By 2100
- 183,381 · +48.5%
Race, ethnicity, and origin ACS 2023
- Neighborhood character
- Predominantly White (65%)
- Race & ethnicity
- White 65% Hispanic / Latino 14% Black 13% Two or more races 8% Asian 2%
- Hispanic origin (detail)
- Mexican 4% Puerto Rican 4% Cuban 2%
- Common ancestry
- Romanian 3% Russian 2% Slovak 2%
- Foreign-born
- 16% · Canada, Jamaica
- Languages at home
- 81% English-only · Spanish 9% Russian/Polish/Slavic 3% Other Indo-European 3%
Political lean MEDSL · Flagler
- 2024 margin
- Strong R (+28.2) · D 35.6% · R 63.8%
- 2008→2024 swing
- -29.8pp toward R · 2008: 1.6pp · 2024: -28.2pp
- All cycles
- 2024: R+28.2 2020: R+20.8 2016: R+20.6 2012: R+7.4 2008: D+1.6
Not yet ingested
- Civics
- —
Market trends
- HPI YoY
- ▼ -19.89%
- Current HPI
- 297.4942
- Rent YoY
- ▲ 1.18%
- Metro
- Deltona-Daytona Beach-Ormond Beach, FL
- State GDP YoY
- ▲ 3.28%
- F500 in state
- 36
Industry mix (Fortune 500 HQ in FL)
| Industry | F500 HQs | Revenue |
|---|---|---|
| Industrial Technology | 2 | $29B |
|
||
| Insurance | 2 | $17B |
|
||
| Retail | 1 | $60B |
|
||
| Technology Distribution | 1 | $58B |
|
||
| Homebuilding | 1 | $35B |
|
||
| Technology Manufacturing | 1 | $35B |
|
||
Price history
-5.4% since first listed7 events — show timeline
- 2026-05-14 Pending — Stellar MLS as Distributed by MLS Grid
- 2026-05-06 Price Changed $245,900 Stellar MLS as Distributed by MLS Grid
- 2026-04-27 Price Changed $247,900 Stellar MLS as Distributed by MLS Grid
- 2026-04-16 Relisted — Stellar MLS as Distributed by MLS Grid
- 2026-04-03 Pending — Stellar MLS as Distributed by MLS Grid
- 2026-03-31 Price Changed $254,900 Stellar MLS as Distributed by MLS Grid
- 2026-03-21 Listed $259,900 Stellar MLS as Distributed by MLS Grid
Property tax history
+1.9%/yrLatest (2025): $1,431 · +3.1% YoY. Source: county tax records.
Cash-flow waterfall
monthlySold comps — $/sqft
last 12 mo · ≤1 miLoading sold comps…