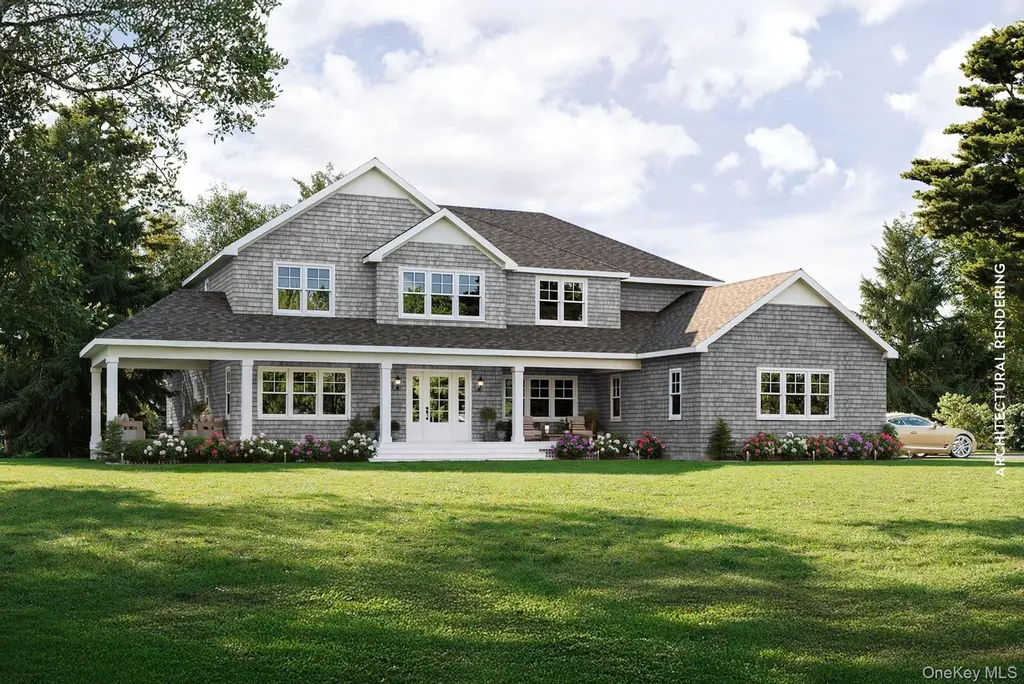
17 Sophia Ct · Westhampton, NY
Flood risk 9/10 · Severe
- FEMA flood zone
- X (unshaded)
- Chance of flooding over 30 yrs
- 0.99%
- Est. flood insurance / yr
- $507 – $1,088
Fire risk 3/10 · Minor
- Est. fire insurance / yr
- $691 – $1,283
Heat risk 4/10 · Minor
- Hot days now (above 90°F)
- 7 days/yr
- Hot days in 30 yrs
- 19 days/yr
Wind risk 8/10 · Major
- Chance of severe wind over 30 yrs
- 80.0%
Air-quality risk 4/10 · Minor
- Unhealthy air days now
- 4 days/yr
- Unhealthy air days in 30 yrs
- 5 days/yr
Risk factors via First Street. Map © Google.
Why this score? — see what drove the D grade
The composite is a weighted blend of 9 inputs, each scored 0–100. Each bar is that input's sub-score; the figure is the points it added to the 100-point composite (weight × sub-score).
- Cash flow +10.8/30.0
- Appreciation +9.4/10.0
- Schools +6.6/10.0
- 1% rule +3.2/10.0
- DSCR +3.1/10.0
- Livability +3.0/5.0
- Rent growth +2.5/5.0
- Condition / age +2.5/5.0
- ARV discount +0.0/15.0
$2,950,000
🖨 Deal sheet 📄 Offer letter ✓ Due diligence
Listing remarks MLS
New construction in Westhampton on 1.5+/- acres. This 4,000 sq ft, 5 bedroom, 5 and one-half bathroom villa is tucked away on a cul-de-sac for privacy. Heated gunite saltwater pool and spa. Room for tennis or pickleball. Pool house is an option. Add your touches pre-construction. Completion scheduled late summer-early fall 2026
Key facts
- New construction
- Spa
- Room for tennis
Tags
Neighborhood map
What this means for you Summary
Snapshot
- This is a 5-bed/5.5-bath land listed at $2.95M.
Deal economics
- At list price, monthly cash flow is $-1k ($-17k/yr) — negative.
- To cash-flow at today's rent, offer at most $2.75M (6.9% below list).
- To meet the 1% rule (rent ≥ 1% of price), the offer needs to be $2.41M (18.3% below list).
- Recommended offer: $2.41M (18.3% below list) — sets the bar for 1% rule.
- Cap rate 5.7% vs local median 9.1% in Westhampton — below-typical yield; the buyer is paying a premium for something (appreciation thesis, condition, location) that the cap rate doesn't capture.
Location & tenants
- Location reads 60/100 on livability (#969 in NY) — a middle-class / working-renter tenant base. Strengths: crime A+, employment A+; Watch: housing C-, schools D+, amenities F.
- Westhampton Beach Union Free School District (suburban): math 72% / reading 75% proficiency, ranked #81 of 590 in NY (top 14%) — strong family-tenant draw, lease renewals of 3-5y typical.
- Market conditions: 63 active listings in the ZIP; 5 comparable units currently listed for rent nearby; rentals at typical pace (median 22d on market — plan ~3-4 weeks tenant-placement turnaround); 40% of comp listings sitting > 30 days — soft ceiling on asking rent; high-income renter base; 1,366 units permitted in Suffolk County in 2024 (216 in 5+ unit buildings).
- At $24,111/mo this rent would consume 191% of the median local household income ($151k/yr) — very limited rent-growth headroom before tenants either downsize or default.
Forward outlook
- In year one you build about $281k of equity ($20k loan paydown + $260k appreciation (8.8% local appreciation)).
- Suffolk County population projected to shrink 5% by 2050 — rents likely to lag national; underwrite the cash flow, not the appreciation.
- By year 2, paydown + projected appreciation supports a ~$450k cash-out refi (75% LTV) — recoverable capital for the next deal without selling this one.
Negotiation context
- It's been on market 217 days — a 12% lower offer ($2.60M) is reasonable based on typical stale-listing flexibility.
- 3 sale attempts since 4y ago with the ask held roughly flat each time — persistent listings suggest the price (not the market) is what's stuck; bring a comps-based counter.
- Current owner paid $650k; list at $2.95M implies a 354% gain — meaningful room to come down on a strong offer.
Risks & watch-outs
- Watch-outs: flood insurance adds $66/mo.
- Climate carrying-cost: severe flood risk; severe wind risk, 80% chance of damaging wind over 30y — expect insurance premiums to compound above CPI over the hold.
Questions for the listing agent
- What do current leases actually rent for vs. the listed asking? Can we see a recent rent roll and the last 12 months of T-12 income?
- It's been on market 217 days. Have you received any prior offers? Is the seller open to a 18% concession, seller financing, or rate buy-down credit?
- What's the actual annual flood-insurance premium (NFIP or private), and is the property in a SFHA with mandatory coverage?
- Why hasn't it sold? Are there any deal-killer items the seller is aware of (foundation, flood, title, zoning, code violations)?
- Is there a deadline driving the sale (1031 exchange, divorce, estate, relocation)? That informs how much negotiation room exists.
- Schools are D-rated, which usually means shorter tenancies and higher turnover. Who's the typical renter profile here, and what's been the actual vacancy rate?
- The area grade is low — what's the realistic commute time and amenity access for the typical tenant pool here? Any planned neighborhood developments (good or bad) we should know about?
- What's the average days-on-market for RENTAL listings here right now (not sales)? A rising rental-DOM trend means longer vacancies and softer asking-rent achievability than the comps imply.
- What's the recent tenant-quality profile in this submarket — average credit score on applications, eviction rate, late-payment / NSF rate, and stable-employment percentage? A property-management company in the area should have these aggregated.
- How much new for-sale + rental construction is in the pipeline within 1–3 miles? Heavy new supply typically softens prices + rents 12–24 months out; constrained supply supports both.
Investment metrics
- 1% rule
- 0.82% ✗
- Cap rate
- 5.75%
- Cash-on-cash
- -1.95%
- DSCR
- 0.91
- GRM
- 10.2
CMA / ARV
- ARV (median comp)
- $2,354,169
- List price
- $2,950,000
- Delta
- 25.31%
- Verdict
- OVERPRICED
- Comps
- 20 within 1.0 mi
Projected returns pro-forma
8.82% appreciation · 3.0% rent growth · sell at horizon
- IRR
- 20.3%
- Equity multiple
- 2.55×
- Total profit
- $1,283,744
- Equity at exit
- $2,408,900
- IRR
- 18.7%
- Equity multiple
- 5.61×
- Total profit
- $3,806,773
- Equity at exit
- $4,951,119
Cash invested: $826,000 (down + closing). Projections, not guarantees.
Landlord ↔ Tenant lean methodology
- Overall (STATE)
- 15 Strongly Tenant-Friendly
- State New York
- 15 Strongly Tenant-Friendly · D+10
- County
- — inherits STATE
- City
- — inherits STATE
ZIP-level market 11977
- Home prices YoY
- 2.3%
- Active inventory
- 63
- Price-to-rent
- 10.2×
Monthly cashflow live
- Estimated rent
- $24,111 medium interval (Pro) →
- Mortgage (P&I)
- −$15,470
- Tax est. 1.5%
- −$3,688 /mo · $44,250/yr
- Insurance
- −$1,229
- Flood insurance flood zone
- −$66 /mo · $798/yr
- HOA
- −$0
- Vacancy / Maint / Mgmt
- −$5,063
- Net cashflow
- $-1,406
Break-even live
UW: 25.0% down · 7.5% · 30yr · 1.5% tax · 5.0% vac · 8.0% maint · 8.0% mgmt
Financing live
Cash to close
- Down payment
- $737,500
- Closing costs
- $88,500
- Reserves months
- —
- Total cash needed
- —
Loan-product check · same deal, 3 products live
Conventional
25% down · 7.5% · 30yr
- Down + closing
- —
- Monthly P&I
- —
- Monthly cashflow
- —
- DSCR
- —
- Eligible?
- —
Personal DTI + credit; lowest rate.
DSCR
20% down · 8.5% · 30yr
- Down + closing
- —
- Monthly P&I
- —
- Monthly cashflow
- —
- DSCR
- —
- Eligible?
- —
No personal income docs; deal must DSCR.
Hard money
10% down · 12.0% · 12mo
- Down + closing
- —
- Monthly P&I
- —
- Monthly cashflow
- —
- DSCR
- —
- Eligible?
- —
Short-term bridge; refi at stabilization.
Rent comps 5 comps
| Address | Beds | Baths | Sqft | Rent | $/sqft | DOM | Units | Dist |
|---|---|---|---|---|---|---|---|---|
| 24 N Quarter Rd Westhampton, NY | 6.0 | 3.0 | 3035 | $45,000 | $14.83 | 22d | 1 | 0.44mi |
| 8 Sweetgrass Rd Westhampton, NY | 5.0 | 4.5 | 4050 | $13,000 | $3.21 | 1d | 1 | 0.89mi |
| 3 Pine Grove Ct Westhampton, NY | 4.0 | 3.5 | 3500 | $35,000 | $10.00 | 22d | 1 | 0.94mi |
| 9 Plume Grass Way Westhampton, NY | 4.0 | 5.5 | 4405 | $40,000 | $9.08 | 44d | 1 | 1.16mi |
| 6 Bay Meadow Ln Westhampton, NY | 6.0 | 5.0 | 3500 | $40,000 | $11.43 | 44d | 1 | 1.47mi |
Listing history 20 events
-
2026-06-18days on market $2,950,000 Active 217 DOM
-
2026-06-17days on market $2,950,000 Active 216 DOM
-
2026-06-16days on market $2,950,000 Active 215 DOM
-
2026-06-15days on market $2,950,000 Active 214 DOM
-
2026-06-13days on market $2,950,000 Active 212 DOM
-
2026-06-09days on market $2,950,000 Active 208 DOM
-
2026-06-08days on market $2,950,000 Active 207 DOM
-
2026-06-07days on market $2,950,000 Active 206 DOM
-
2026-06-04days on market $2,950,000 Active 203 DOM
-
2026-06-03days on market $2,950,000 Active 202 DOM
-
2026-06-02days on market $2,950,000 Active 201 DOM
-
2026-06-01days on market $2,950,000 Active 200 DOM
-
2026-05-31days on market $2,950,000 Active 199 DOM
-
2025-11-12$2,950,000 Active 332-char remark
Show marketing remark (332 chars)
New construction in Westhampton on 1.5+/- acres. This 4,000 sq ft, 5 bedroom, 5 and one-half bathroom villa is tucked away on a cul-de-sac for privacy. Heated gunite saltwater pool and spa. Room for tennis or pickleball. Pool house is an option. Add your touches pre-construction. Completion scheduled late summer-early fall 2026
-
2024-11-04historical
-
2024-05-28status Active
-
2024-05-28price $775,000
-
2024-05-24historical
-
2022-05-30$875,000 Active
-
2005-12-23soldstatus $650,000
ⓘ Source: listings_history table (triggers on properties + properties_extension) + one-shot
backfill from property_details.listing_events for pre-trigger history.
Climate risk First Street
- Flood 9/10 Extreme FEMA zone X (unshaded) · 99% chance over 30 yrs
- Wildfire 3/10 Moderate
- Heat 4/10 Moderate 7 d/yr ≥90°F today · 19 d/yr by 30 yrs out
- Wind 8/10 Severe 80% chance of damaging wind over 30 yrs
- Air quality 4/10 Moderate 4 unhealthy d/yr today · 5 by 30 yrs out
Nearby sold comps map
Loading sold comps map…
Walkable amenities ~0.75 mi
Loading nearby amenities…
Taxation est. · year 1
- Rental income
- $289,328
- − Mortgage interest
- −$165,246
- − Property taxes
- −$44,250
- − Insurance
- −$15,548
- − Repairs & maintenance
- −$23,146
- − Management
- −$23,146
- − Depreciation
- −$85,818
- Taxable loss
- −$67,826
- Est. tax savings @ 24.0%
- +$16,278
- After-tax cash flow
- $-591/yr
For passive investors: Depreciation is non-cash, so a rental often shows a tax loss while cash-flowing — sheltering income. Rental losses are passive: they offset passive income freely, and up to $25,000/yr can offset ordinary (W-2) income if you actively participate and your MAGI is under $100k (phasing out to $0 by $150k); unused losses carry forward. On sale, claimed depreciation is recaptured at up to 25%, and gains may owe capital-gains tax (a 1031 exchange can defer both). Figures are a year-1 estimate at your 24.0% rate — not tax advice; consult a CPA.
Schools (NCES district)
- District
- Westhampton Beach Union Free School District
- NCES district ID
- 3631020
- Math proficiency
- 72% ▼ -5.00%
- Reading proficiency
- 75% ▲ 3.00%
- Median HH income
- $88,137
- Composite
- 65.91/100
- National rank
- #444
- State rank
- #81 of 590 in NY
Livability — Westhampton
- Score
- 60/100
- State rank
- #969
- US rank
- #18972
Category grades
Schools grade is shown separately in the Schools card above.
Census & demographics
- Census place
- Westhampton, NY
- County
- Suffolk County · 679,920 people
- City population
- 2,843
- Metro
- New York-Newark-Jersey City, NY-NJ-PA
- Population (ZIP)
- 2,843
- Household income
- $151,375
- Rent vs Own
- Severe rent burden
- 14.0
Population outlook (Suffolk County) Hauer SSP2
- Today (2025)
- 1,505,262 people
- By 2030
- 1,498,318 · -0.5%
- By 2040
- 1,471,101 · -2.3%
- By 2050
- 1,424,848 · -5.3%
- By 2075
- 1,337,157 · -11.2%
- By 2100
- 1,217,720 · -19.1%
Race, ethnicity, and origin ACS 2023
- Neighborhood character
- Predominantly White (89%)
- Race & ethnicity
- White 89% Hispanic / Latino 5% Asian 3% Two or more races 2%
- Hispanic origin (detail)
- Common ancestry
- Scotch-Irish 3% Romanian 3% Subsaharan African 1%
- Foreign-born
- 11% · Canada, South Korea
- Languages at home
- 89% English-only · Spanish 5% Other Indo-European 4% Korean 2%
Political lean MEDSL · Suffolk
- 2024 margin
- Lean R (+10.0) · D 45.0% · R 55.0%
- 2008→2024 swing
- -16.0pp toward R · 2008: 6.0pp · 2024: -10.0pp
- All cycles
- 2024: R+10.0 2020: R+0.0 2016: R+8.2 2012: D+2.9 2008: D+6.0
Not yet ingested
- Civics
- —
Market trends
- HPI YoY
- ▲ 8.82%
- Current HPI
- 391.8868
- Rent YoY
- —
- Metro
- New York-Newark-Jersey City, NY-NJ-PA
- State GDP YoY
- ▲ 2.60%
- F500 in state
- 92
Industry mix (Fortune 500 HQ in NY)
| Industry | F500 HQs | Revenue |
|---|---|---|
| Financial Services | 10 | $950B |
|
||
| Consumer Goods | 9 | $162B |
|
||
| Insurance | 4 | $225B |
|
||
| Telecommunications | 2 | $144B |
|
||
| Pharmaceuticals | 2 | $112B |
|
||
| Media / Entertainment | 2 | $69B |
|
||
Price history
+353.8% since first listed7 events — show timeline
- 2025-11-12 Listed $2,950,000 OneKey® MLS as Distributed by MLS Grid
- 2024-11-04 Listing Removed — OneKey® MLS as Distributed by MLS Grid
- 2024-05-28 Relisted — OneKey® MLS as Distributed by MLS Grid
- 2024-05-28 Price Changed $775,000 OneKey® MLS as Distributed by MLS Grid
- 2024-05-24 Listing Removed — OneKey® MLS as Distributed by MLS Grid
- 2022-05-30 Listed $875,000 OneKey® MLS as Distributed by MLS Grid
- 2005-12-23 Sold (Public Records) $650,000 Public Records
Property tax history
+4.0%/yrLatest (2022): $2,985 · +0.0% YoY. Source: county tax records.
Cash-flow waterfall
monthlySold comps — $/sqft
last 12 mo · ≤1 miLoading sold comps…