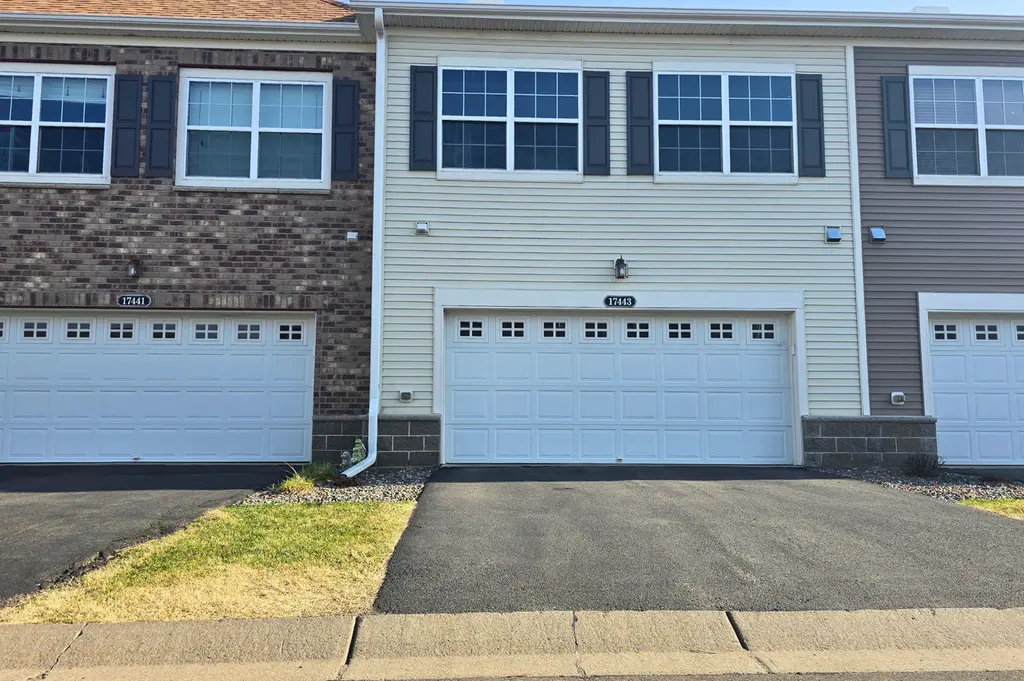
17443 72nd Ave N #2202 · Maple Grove, MN
Flood risk 1/10 · Minimal
- FEMA flood zone
- X (unshaded)
- Chance of flooding over 30 yrs
- 0.0%
- Est. flood insurance / yr
- $507 – $1,088
Fire risk 1/10 · Minimal
- Est. fire insurance / yr
- $888 – $1,650
Heat risk 2/10 · Minimal
- Hot days now (above 98°F)
- 7 days/yr
- Hot days in 30 yrs
- 14 days/yr
Wind risk 2/10 · Minimal
- Chance of severe wind over 30 yrs
- —
Air-quality risk 2/10 · Minimal
- Unhealthy air days now
- 1 days/yr
- Unhealthy air days in 30 yrs
- 1 days/yr
Risk factors via First Street. Map © Google.
Why this score? — see what drove the F grade
The composite is a weighted blend of 9 inputs, each scored 0–100. Each bar is that input's sub-score; the figure is the points it added to the 100-point composite (weight × sub-score).
- ARV discount +7.5/15.0
- Cash flow +7.3/30.0
- Schools +4.2/10.0
- Rent growth +4.0/5.0
- Livability +4.0/5.0
- 1% rule +3.2/10.0
- Condition / age +2.5/5.0
- DSCR +1.4/10.0
- Appreciation +0.0/10.0
$319,900
🖨 Deal sheet (PDF) 📄 Offer letter ✓ Due diligence
Listing remarks
Clean, bright, and move-in ready—this is the one buyers wait for in Maple Grove. Built in 2012, this well-maintained 3 bed, 2.5 bath townhome offers ~1,600 sq ft with an open layout filled with natural light. The main level features a cozy living room with a gas fireplace and stone surround, flowing into a bright dining area with bay window and a kitchen equipped with granite countertops and maple cabinets—simple, functional, and ready to go. Upstairs offers a spacious primary suite with walk-in closet, two additional bedrooms, and a versatile loft perfect for a home office, playroom, or second living space, plus convenient upper-level laundry. Step outside to enjoy open green s
Key facts
- $420 HOA
- 2 garage spots
- Built 2012
Property features AI
Finance
- Other: Living area approx. 1,624 sq ft; Lot roughly 0.324 acres
- HOA & community: HOA (RowCal) with monthly fee of $420; HOA covers hazard insurance, lawn care, grounds maintenance, professional management, sewer, snow removal and water
Exterior
- Parking: Attached tuck-under garage with guest parking; 2-car garage (approximately 18 x 21)
- Utilities: City water (connected); City sewer (connected); Natural gas; Electric service with circuit breakers
- Home design: Residential attached property; Two levels; Main living area on one level (3 bedrooms on one level)
- Construction: Brick, concrete and stone construction; Asphalt roof; Slab foundation; Built on concrete foundation area ~707
- Exterior features: Patio; Stone and metal exterior accents; City street frontage with curbs, paved streets and sidewalks
Interior
- Kitchen: Range; Microwave; Dishwasher; Refrigerator; Exhaust fan
- Bedrooms: 3 bedrooms (all on upper level)
- Bathrooms: 2 full bathrooms and 1 half bathroom (including a primary full bath and a main-floor half bath)
- Heating & cooling: Forced air heating; Fireplace heating; Central air conditioning
- Interior features: Gas fireplace (1); Breakfast area / living-dining combination; 2nd-floor laundry; No basement
- Laundry & utility: Washer; Upper-level laundry; Gas water heater; Owned water softener
Neighborhood map
What this means for you Summary
Snapshot
- This is a 3-bed/3.0-bath condo listed at $320k.
Deal economics
- At list price, monthly cash flow is $-430 ($-5k/yr) — negative.
- To cash-flow at today's rent, offer at most $244k (23.8% below list).
- To meet the 1% rule (rent ≥ 1% of price), the offer needs to be $263k (17.6% below list).
- Recommended offer: $244k (23.8% below list) — sets the bar for cash-flow.
- Cap rate 4.7% vs local median 3.4% in Maple Grove — top-decile yield for the area; either an underpriced asset or a hidden risk that comps aren't pricing in. Stress-test before assuming the spread holds.
Location & tenants
- Location reads 81/100 on livability (#54 in MN, #1,353 nationally) — a professional / high-income tenant draw. Strengths: commute A+, employment A+, housing A+; Watch: amenities D, cost of living D.
- Osseo Public School District (suburban): math 42% / reading 51% proficiency, ranked #129 of 301 in MN (top 43%) — families likely to look elsewhere, expect single-tenant / working-renter base with shorter leases.
- Zoned schools: Basswood Elementary (math 76% / reading 71%, grade A, #41 of 857 statewide, top 5%, 865 students, 18% FRL); Maple Grove Middle School (math 45% / reading 58%, grade C, #65 of 258 statewide, top 26%, 1,598 students, 30% FRL); Maple Grove Senior High (math 53% / reading 69%, grade C+, #42 of 471 statewide, top 9%, 2,324 students, 21% FRL).
- Zoned-school proficiency averages 62% at this address vs 46% district-wide (+16 pts) — the actual schools serving this property are materially stronger than the Osseo Public School District average implies; a family-tenant draw the district grade alone would hide.
- Market conditions: Rents rising fast (+5.9%/yr); 304 active listings in the ZIP; 6 comparable units currently listed for rent nearby; rentals leasing fast (median 7d on market — plan ~1-2 weeks tenant-placement turnaround); high-income renter base; 4,651 units permitted in Hennepin County in 2024 (2,443 in 5+ unit buildings).
Forward outlook
- Local home prices are declining (-3.0%/yr); year-one equity from $2k of loan paydown is wiped out by about $10k of value loss. Plan a longer hold.
- Hennepin County population projected at +30% by 2050 — long-run rental-demand tailwind backs the buy-and-hold thesis.
Negotiation context
- It's been on market 29 days — a 2% lower offer ($315k) is reasonable based on typical stale-listing flexibility.
- Current owner paid $199k; list at $320k implies a 61% gain — meaningful room to come down on a strong offer.
Questions for the listing agent
- What do current leases actually rent for vs. the listed asking? Can we see a recent rent roll and the last 12 months of T-12 income?
- What does the HOA fee cover, when was the last increase, and are there any pending special assessments or reserve-fund shortfalls?
- Any open or pending special assessments — roof, HVAC, plumbing, elevator, façade? What's the per-unit balance and payoff schedule, and is the seller paying it off at close or rolling it to the buyer?
- Is there a deadline driving the sale (1031 exchange, divorce, estate, relocation)? That informs how much negotiation room exists.
- Schools are A-rated — typically a magnet for longer-tenancy family renters. What's the average tenant stay here, and is there a school-zone premium baked into asking?
- The area grade is low — what's the realistic commute time and amenity access for the typical tenant pool here? Any planned neighborhood developments (good or bad) we should know about?
- What's the average days-on-market for RENTAL listings here right now (not sales)? A rising rental-DOM trend means longer vacancies and softer asking-rent achievability than the comps imply.
- What's the recent tenant-quality profile in this submarket — average credit score on applications, eviction rate, late-payment / NSF rate, and stable-employment percentage? A property-management company in the area should have these aggregated.
- How much new apartment / multifamily construction is in the pipeline within 1–3 miles? Heavy new supply (>2% of stock underway) typically softens rents 12–24 months out; light construction supports rent growth.
Investment metrics
- 1% rule
- 0.82% ✗
- Cap rate
- 4.68%
- Cash-on-cash
- -5.76%
- DSCR
- 0.74
- GRM
- 10.1
CMA / ARV
No comps found within radius.
Projected returns pro-forma
-3.0% appreciation · 5.86% rent growth · sell at horizon
- IRR
- -22.5%
- Equity multiple
- 0.20×
- Total profit
- $-71,220
- Equity at exit
- $47,698
- IRR
- -10.0%
- Equity multiple
- 0.30×
- Total profit
- $-62,458
- Equity at exit
- $27,659
Cash invested: $89,572 (down + closing). Projections, not guarantees.
Landlord ↔ Tenant lean methodology
- Overall (STATE)
- 46 Balanced
- State Minnesota
- 46 Balanced · D+2
- County
- — inherits STATE
- City
- — inherits STATE
ZIP-level market 55311
- Rents YoY
- 5.9%
- Active inventory
- 304
- Price-to-rent
- 10.1×
Monthly cashflow live
- Estimated rent
- $2,635 high interval (Pro) →
- Mortgage (P&I)
- −$1,678
- Tax from tax record
- −$281 /mo · $3,369/yr
- Insurance
- −$133
- HOA
- −$420
- Vacancy / Maint / Mgmt
- −$553
- Net cashflow
- $-430
Break-even live
Sensitivity live
| Price | -10% $-249 | -5% $-340 | +0% $-430 | +5% $-521 | +10% $-611 |
|---|---|---|---|---|---|
| Rent | -10% $-638 | -5% $-534 | +0% $-430 | +5% $-326 | +10% $-222 |
| Rate | -1.0pp $-269 | -0.5pp $-349 | base $-430 | +0.5pp $-513 | +1.0pp $-598 |
UW: 25.0% down · 7.5% · 30yr · 1.5% tax · 5.0% vac · 8.0% maint · 8.0% mgmt
Financing live
Cash to close
- Down payment
- $79,975
- Closing costs
- $9,597
- Reserves months
- —
- Total cash needed
- —
Loan-product check · same deal, 3 products live
Conventional
25% down · 7.5% · 30yr
- Down + closing
- —
- Monthly P&I
- —
- Monthly cashflow
- —
- DSCR
- —
- Eligible?
- —
Personal DTI + credit; lowest rate.
DSCR
20% down · 8.5% · 30yr
- Down + closing
- —
- Monthly P&I
- —
- Monthly cashflow
- —
- DSCR
- —
- Eligible?
- —
No personal income docs; deal must DSCR.
Hard money
10% down · 12.0% · 12mo
- Down + closing
- —
- Monthly P&I
- —
- Monthly cashflow
- —
- DSCR
- —
- Eligible?
- —
Short-term bridge; refi at stabilization.
Rent comps 6 comps
| Address | Beds | Baths | Sqft | Rent | $/sqft | DOM | Units | Dist |
|---|---|---|---|---|---|---|---|---|
| 17602 68th Pl N Maple Grove, MN | 2.0 | 2.5 | 1563 | $2,195 | $1.40 | 7d | 1 | 0.31mi |
| 6708 Narcissus Ln N Maple Grove, MN | 3.0 | 2.5 | 1563 | $2,550 | $1.63 | 26d | 1 | 0.52mi |
| 7343 Walnut Grove Ln N Maple Grove, MN | 3.0–4.0 | 2.5–3.5 | 2469 | $3,346 | $1.35 | 0d | 1 | 0.89mi |
| 17050 78th Pl N Maple Grove, MN | 3.0 | 3.0 | 1628 | $2,399 | $1.47 | 45d | 1 | 0.97mi |
| 7148 Brockton Ln N Maple Grove, MN | 2.0–3.0 | 2.0 | 1309 | $2,600 | $1.99 | 0d | 8 | 0.99mi |
| 6876 Vicksburg Ln N Maple Grove, MN | 2.0–3.0 | 1.5 | 1110 | $2,350 | $2.12 | 1d | 6 | 1.08mi |
HOA detail condo
- Monthly dues
- $420 · $5,040/yr
- Likely covers
- gas
- Assessments
- None detected in remarks — confirm with the listing agent.
Listing history 8 events
-
2026-06-04days on market $319,900 Active 29 DOM
-
2026-06-03days on market $319,900 Active 28 DOM
-
2026-06-02days on market $319,900 Active 27 DOM
-
2026-06-01days on market $319,900 Active 26 DOM
-
2026-05-31days on market $319,900 Active 25 DOM
-
2026-05-07$319,900 Active 1068-char remark
-
2026-05-01historical $319,900 1068-char remark
-
2016-06-17soldstatus $198,888
ⓘ Source: listings_history table (triggers on properties + properties_extension) + one-shot
backfill from property_details.listing_events for pre-trigger history.
Tax reassessment forecast MN · Partial reset (capped growth)
- Current annual tax
- $3,369 · $281/mo
- Projected year-2 tax
- $3,476 · $290/mo
- Expected delta
- +$107/yr (+$9/mo · 3.2%)
ⓘ Screening estimate from a state-policy table — verify with the county assessor before closing.
Climate risk First Street
- Flood 1/10 Low FEMA zone X (unshaded) · 0% chance over 30 yrs
- Wildfire 1/10 Low
- Heat 2/10 Low 7 d/yr ≥98°F today · 14 d/yr by 30 yrs out
- Wind 2/10 Low
- Air quality 2/10 Low 1 unhealthy d/yr today · 1 by 30 yrs out
Nearby sold comps map
Loading sold comps map…
Walkable amenities ~0.75 mi
Loading nearby amenities…
Taxation est. · year 1
- Rental income
- $31,615
- − Mortgage interest
- −$17,919
- − Property taxes
- −$3,369
- − Insurance
- −$1,600
- − Repairs & maintenance
- −$2,529
- − Management
- −$2,529
- − HOA
- −$5,040
- − Depreciation
- −$9,306
- Taxable loss
- −$10,677
- Est. tax savings @ 24.0%
- +$2,563
- After-tax cash flow
- $-2,601/yr
For passive investors: Depreciation is non-cash, so a rental often shows a tax loss while cash-flowing — sheltering income. Rental losses are passive: they offset passive income freely, and up to $25,000/yr can offset ordinary (W-2) income if you actively participate and your MAGI is under $100k (phasing out to $0 by $150k); unused losses carry forward. On sale, claimed depreciation is recaptured at up to 25%, and gains may owe capital-gains tax (a 1031 exchange can defer both). Figures are a year-1 estimate at your 24.0% rate — not tax advice; consult a CPA.
Schools (NCES district)
- District
- Osseo Public School District
- NCES district ID
- 2725200
- Math proficiency
- 42% ▼ -7.00%
- Reading proficiency
- 51% ▼ -4.00%
- Median HH income
- $76,168
- Composite
- 42.35/100
- National rank
- #3250
- State rank
- #129 of 301 in MN
Livability — Maple Grove
- Score
- 81/100
- State rank
- #54
- US rank
- #1353
Category grades
Schools grade is shown separately in the Schools card above.
Census & demographics
- Census place
- Maple Grove, MN
- County
- Hennepin County · 1,150,272 people
- City population
- 77,762
- Metro
- Minneapolis-St. Paul-Bloomington, MN-WI
- Population (ZIP)
- 38,472
- Household income
- $153,568
- Rent vs Own
- Severe rent burden
- 497.0
Population outlook (Hennepin County) Hauer SSP2
- Today (2025)
- 1,405,227 people
- By 2030
- 1,492,650 · +6.2%
- By 2040
- 1,660,157 · +18.1%
- By 2050
- 1,823,498 · +29.8%
- By 2075
- 2,221,283 · +58.1%
- By 2100
- 2,509,976 · +78.6%
Race, ethnicity, and origin ACS 2023
- Neighborhood character
- Predominantly White (80%)
- Race & ethnicity
- White 80% Asian 8% Black 7% Two or more races 3% Hispanic / Latino 1%
- Common ancestry
- Portuguese 12% Lithuanian 4% Romanian 4%
- Foreign-born
- 12% · Canada, Vietnam, South Korea
- Languages at home
- 87% English-only · Other Indo-European 3% Vietnamese 1% Chinese 1%
Political lean MEDSL · Hennepin
- 2024 margin
- Solid D (+42.6) · D 70.2% · R 27.5% · Other 2.3%
- 2008→2024 swing
- +14.0pp toward D · 2008: 28.6pp · 2024: 42.6pp
- All cycles
- 2024: D+42.6 2020: D+43.2 2016: D+35.3 2012: D+27.1 2008: D+28.6
Not yet ingested
- Civics
- —
Market trends
- HPI YoY
- ▼ -181.69%
- Current HPI
- 213.3896
- Rent YoY
- ▲ 5.86%
- Metro
- Minneapolis-St. Paul-Bloomington, MN-WI
- State GDP YoY
- ▲ 2.41%
- F500 in state
- 34
Industry mix (Fortune 500 HQ in MN)
| Industry | F500 HQs | Revenue |
|---|---|---|
| Healthcare | 2 | $407B |
|
||
| Retail | 2 | $150B |
|
||
| Consumer Goods | 2 | $32B |
|
||
| Industrial Machinery | 2 | $6B |
|
||
| Agriculture | 1 | $40B |
|
||
| Healthcare / Medical Devices | 1 | $32B |
|
||
Price history
+60.8% since first listed4 events — show timeline
- 2026-06-05 Listing Removed — NORTHSTARMLS as Distributed by MLS Grid
- 2026-05-07 Listed $319,900 NORTHSTARMLS as Distributed by MLS Grid
- 2026-05-01 Coming Soon — NORTHSTARMLS as Distributed by MLS Grid
- 2016-06-17 Sold (Public Records) $198,888 Public Records
Property tax history
+11.6%/yrLatest (2025): $3,369 · -1.2% YoY. Source: county tax records.
Cash-flow waterfall
monthlySold comps — $/sqft
last 12 mo · ≤1 miLoading sold comps…