 Duplex
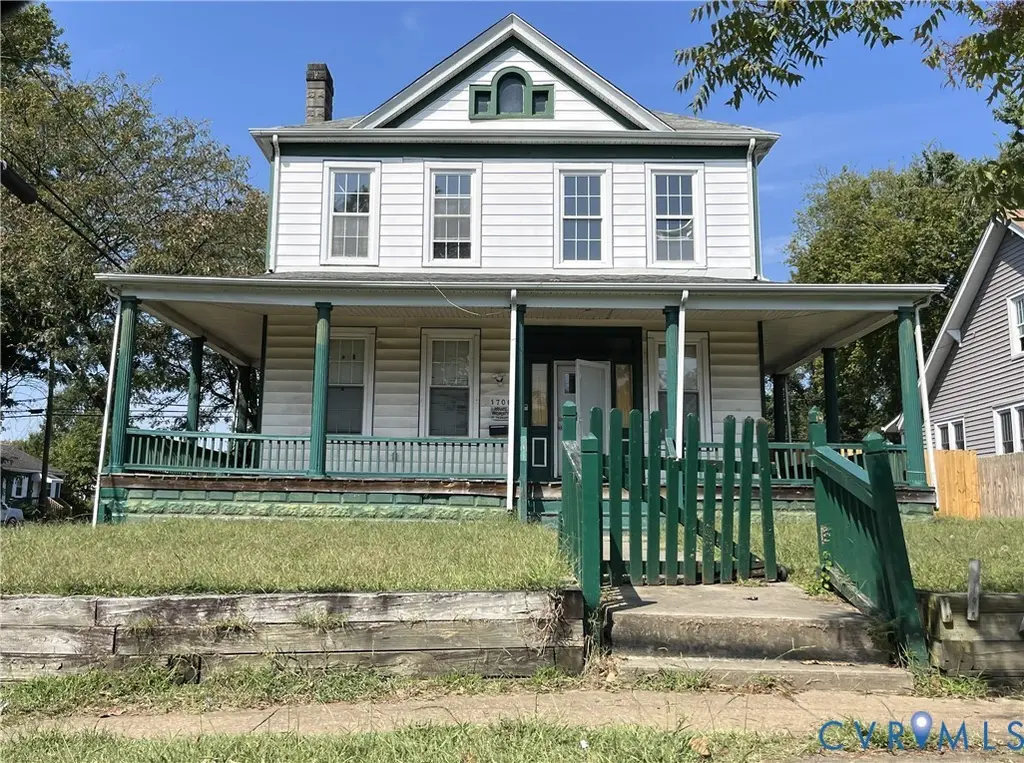
1708 Mechanicsville Tpke · Richmond, VA
Flood risk 1/10 · Minimal
- FEMA flood zone
- X (unshaded)
- Chance of flooding over 30 yrs
- 0.0%
- Est. flood insurance / yr
- $473 – $860
Fire risk 1/10 · Minimal
- Est. fire insurance / yr
- $666 – $1,236
Heat risk 7/10 · Major
- Hot days now (above 105°F)
- 7 days/yr
- Hot days in 30 yrs
- 16 days/yr
Wind risk 6/10 · Moderate
- Chance of severe wind over 30 yrs
- 27.0%
Air-quality risk 2/10 · Minimal
- Unhealthy air days now
- 1 days/yr
- Unhealthy air days in 30 yrs
- 3 days/yr
Risk factors via First Street. Map © Google.
Why this score? — see what drove the C- grade
The composite is a weighted blend of 9 inputs, each scored 0–100. Each bar is that input's sub-score; the figure is the points it added to the 100-point composite (weight × sub-score).
- Cash flow +20.8/30.0
- ARV discount +7.5/15.0
- DSCR +6.6/10.0
- 1% rule +4.6/10.0
- Livability +4.2/5.0
- Rent growth +4.1/5.0
- Schools +3.3/10.0
- Condition / age +2.5/5.0
- Appreciation +0.0/10.0
$299,000
🖨 Deal sheet 📄 Offer letter ✓ Due diligence
Multi-family units
County records classify this as Multi-Family (2-4 Unit). Listing-text estimate: 2 units. confirmed
Listing remarks MLS
Great business opportunity! This home has a full kitchen and full bathroom on the first floor and a full kitchen and full bathroom on the second floor. Each tenant has a bedroom and shares the kitchen/bath on their floor. There is potential to house 6 tenants. The current tenants have lived there for 4 years and would like to stay. They pay $500 per month. A new furnace was installed in 2014. The hot water heaters are 4 and 5 years old. New porch flooring was installed in 2016. New gutters in 2016. New shower/tub in 2015.
Key facts
- Previously renovated
- Up-and-coming area
- Fenced in back yard
Tags
Property features AI
Finance
- Financial info: Property configured as a single unit; Actual rent reported: $3,000
Exterior
- Parking: Detached garage; Off-street parking; On-street parking; Approximately 1.5 garage spaces
- Utilities: Public water; Public sewer; Electric water heater; Electric power
- Home design: 2-story residence; Frame construction with vinyl siding; Shingle roof; R-5 zoning
- Construction: Built (year recorded as actual); Frame with vinyl siding; Shingle roof; Partial unfinished below-grade area
- Exterior features: Front porch; Fenced backyard; Corner lot
Interior
- Kitchen: Electric water heater
- Bedrooms: 4 bedrooms
- Bathrooms: 2 full bathrooms
- Heating & cooling: Heat pump
- Interior features: Partial unfinished basement; Basement present
- Laundry & utility: Heat pump
Neighborhood map
What this means for you Summary
Snapshot
- This is a 2 × 2-bed/1.0-bath units multifamily listed at $299k.
Deal economics
- At list price, monthly cash flow is $412 ($5k/yr) — positive. Per door: $206/mo.
- The deal already cash-flows at list — no discount required.
- To meet the 1% rule (rent ≥ 1% of price), the offer needs to be $287k (3.9% below list).
- Recommended offer: $287k (3.9% below list) — sets the bar for 1% rule.
- Cap rate 7.9% vs local median 3.3% in Richmond — top-decile yield for the area; either an underpriced asset or a hidden risk that comps aren't pricing in. Stress-test before assuming the spread holds.
Location & tenants
- Location reads 84/100 on livability (#33 in VA, #793 nationally) — a professional / high-income tenant draw. Strengths: amenities A+, commute A+, health & safety A+; Watch: crime D-.
- Richmond City Public School District (urban): math 32% / reading 47% proficiency, ranked #123 of 131 in VA (top 94%) — families likely to look elsewhere, expect single-tenant / working-renter base with shorter leases; 74% free/reduced lunch — lower-income household profile, screen leases tightly.
- Market conditions: Rents rising fast (+6.4%/yr); 337 active listings in the ZIP; 20 comparable units currently listed for rent nearby; rentals at typical pace (median 17d on market — plan ~3-4 weeks tenant-placement turnaround); 2,540 units permitted in Richmond city in 2024 (2,077 in 5+ unit buildings).
- At $2,873/mo this rent would consume 62% of the median local household income ($56k/yr) (locally 3530% of renters already pay >50% of income on rent) — very limited rent-growth headroom before tenants either downsize or default.
Forward outlook
- Local home prices are declining (-3.0%/yr); year-one equity from $2k of loan paydown is wiped out by about $9k of value loss. Plan a longer hold.
- Richmond County population projected at +40% by 2050 — long-run rental-demand tailwind backs the buy-and-hold thesis.
- At projected returns (-3.0% appreciation + 6.4% rent growth), your $84k cash investment doubles in ~10 years — after that, you're playing with house money.
Negotiation context
- Only 11 days on market — expect competitive offers; lowballing is unlikely to land.
- 3 sale attempts since 25y ago with the ask held roughly flat each time — persistent listings suggest the price (not the market) is what's stuck; bring a comps-based counter.
- Current owner paid $190k; list at $299k implies a 57% gain — meaningful room to come down on a strong offer.
Risks & watch-outs
- Watch-outs: built in 1900 — expect roof / HVAC / electrical / plumbing capex.
- Climate carrying-cost: major wind risk, 27% chance of damaging wind over 30y; extreme-heat days projected 7→16/yr by 2055 (HVAC capex compounding) — expect insurance premiums to compound above CPI over the hold.
Questions for the listing agent
- Can we see the unit-by-unit rent roll, current vacancy, and any below-market leases? What's the average tenancy length?
- What capital expenditures (roof, boiler, parking lot, exteriors) have been made in the last 5 years, and what's planned in the next 2?
- Built in 1900 — when were the roof, HVAC, electrical panel, plumbing, and water heater last replaced?
- Is there a deadline driving the sale (1031 exchange, divorce, estate, relocation)? That informs how much negotiation room exists.
- Schools are A-rated — typically a magnet for longer-tenancy family renters. What's the average tenant stay here, and is there a school-zone premium baked into asking?
- Crime grade is D in this area — have there been break-ins, vandalism, or insurance claims at this property in the last 3 years? What carrier currently insures it and at what premium?
- What's the average days-on-market for RENTAL listings here right now (not sales)? A rising rental-DOM trend means longer vacancies and softer asking-rent achievability than the comps imply.
- What's the recent tenant-quality profile in this submarket — average credit score on applications, eviction rate, late-payment / NSF rate, and stable-employment percentage? A property-management company in the area should have these aggregated.
- How much new apartment / multifamily construction is in the pipeline within 1–3 miles? Heavy new supply (>2% of stock underway) typically softens rents 12–24 months out; light construction supports rent growth.
Investment metrics
- 1% rule
- 0.96% ✗
- Cap rate
- 7.95%
- Cash-on-cash
- 5.91%
- DSCR
- 1.26
- GRM
- 8.7
CMA / ARV
No comps found within radius.
Projected returns pro-forma
-3.0% appreciation · 6.38% rent growth · sell at horizon
- IRR
- -3.8%
- Equity multiple
- 0.85×
- Total profit
- $-12,188
- Equity at exit
- $44,582
- IRR
- 9.2%
- Equity multiple
- 1.80×
- Total profit
- $67,276
- Equity at exit
- $25,852
Cash invested: $83,720 (down + closing). Projections, not guarantees.
Landlord ↔ Tenant lean methodology
- Overall (STATE)
- 55 Moderately Landlord-Leaning
- State Virginia
- 55 Moderately Landlord-Leaning · D+2
- County
- — inherits STATE
- City
- — inherits STATE
ZIP-level market 23223
- Rents YoY
- 6.4%
- Active inventory
- 337
- Price-to-rent
- 17.3×
Monthly cashflow live
- Estimated rent
- $2,873 high interval (Pro) →
- Mortgage (P&I)
- −$1,568
- Tax from tax record
- −$165 /mo · $1,980/yr
- Insurance
- −$125
- HOA
- −$0
- Vacancy / Maint / Mgmt
- −$603
- Net cashflow
- $412
Break-even live
2-unit breakdown (identical units grouped — click to expand)
| Units | Beds | Baths | Est. rent |
|---|---|---|---|
| 2× units | 2 | 1 | $2,874 |
| #1 | 2 | 1 | $1,437 |
| #2 | 2 | 1 | $1,437 |
| Total (2 units) | $2,873 | ||
UW: 25.0% down · 7.5% · 30yr · 1.5% tax · 5.0% vac · 8.0% maint · 8.0% mgmt
Financing live
Cash to close
- Down payment
- $74,750
- Closing costs
- $8,970
- Reserves months
- —
- Total cash needed
- —
Loan-product check · same deal, 3 products live
Conventional
25% down · 7.5% · 30yr
- Down + closing
- —
- Monthly P&I
- —
- Monthly cashflow
- —
- DSCR
- —
- Eligible?
- —
Personal DTI + credit; lowest rate.
DSCR
20% down · 8.5% · 30yr
- Down + closing
- —
- Monthly P&I
- —
- Monthly cashflow
- —
- DSCR
- —
- Eligible?
- —
No personal income docs; deal must DSCR.
Hard money
10% down · 12.0% · 12mo
- Down + closing
- —
- Monthly P&I
- —
- Monthly cashflow
- —
- DSCR
- —
- Eligible?
- —
Short-term bridge; refi at stabilization.
Rent comps 20 comps
| Address | Beds | Baths | Sqft | Rent | $/sqft | DOM | Units | Dist |
|---|---|---|---|---|---|---|---|---|
| 1614 N 19th St Richmond, VA | 4.0 | 2.0 | 1584 | $2,395 | $1.51 | 4d | 1 | 0.15mi |
| 1313 N 20th St Richmond, VA | 3.0 | 2.0 | 2000 | $2,045 | $1.02 | 11d | 1 | 0.52mi |
| 1427 N 22nd St Richmond, VA | 3.0 | 2.5 | 1764 | $2,700 | $1.53 | 43d | 1 | 0.54mi |
| 1308 N 23rd St Richmond, VA | 3.0 | 2.5 | 2052 | $2,900 | $1.41 | 17d | 1 | 0.63mi |
| 2209 Fairmount Ave Richmond, VA | 3.0 | 2.0 | 1652 | $2,500 | $1.51 | 43d | 1 | 0.65mi |
| 1221 N 26th St Richmond, VA | 3.0 | 2.5 | 1900 | $2,700 | $1.42 | 23d | 1 | 0.85mi |
| 2235 Venable St Richmond, VA | 3.0 | 2.5 | 2881 | $3,100 | $1.08 | 43d | 1 | 0.89mi |
| 1107 N 27th St Richmond, VA | 3.0 | 3.5 | 1792 | $2,600 | $1.45 | 4d | 1 | 0.95mi |
| 1404 N 30th St Richmond, VA | 3.0 | 2.5 | 1700 | $2,195 | $1.29 | 4d | 1 | 0.98mi |
| 2003 Cedar St Richmond, VA | 3.0 | 2.0 | 1420 | $2,200 | $1.55 | 43d | 1 | 1.02mi |
| 2820 Q St Richmond, VA | 3.0 | 2.0 | 1523 | $2,195 | $1.44 | 4d | 1 | 1.04mi |
| 3018 S St Richmond, VA | 3.0 | 2.5 | 1786 | $2,645 | $1.48 | 43d | 1 | 1.07mi |
| 1920 Princess Anne Ave Richmond, VA | 3.0 | 2.0 | 2000 | $2,595 | $1.30 | 4d | 1 | 1.09mi |
| 724 N 1st St Richmond, VA | 3.0 | 2.5 | 1704 | $3,000 | $1.76 | 43d | 1 | 1.27mi |
| 3017 Dill Ave Richmond, VA | 4.0 | 2.0 | 1578 | $1,895 | $1.20 | 3d | 1 | 1.30mi |
| 3007 3rd Ave Richmond, VA | 3.0 | 3.0 | 2036 | $2,295 | $1.13 | 43d | 1 | 1.32mi |
| 2213 Capp Rd Richmond, VA | 3.0 | 2.0 | 1572 | $2,200 | $1.40 | 17d | 1 | 1.37mi |
| 3101 Divine Dr Richmond, VA | 3.0 | 2.5 | 1525 | $2,700 | $1.77 | 2d | 1 | 1.38mi |
| 1901 E Franklin St Apt 5 Richmond, VA | 3.0 | 3.0 | 1530 | $1,850 | $1.21 | 23d | 1 | 1.41mi |
| 307 N 29th St Richmond, VA | 3.0 | 3.0 | 1992 | $2,900 | $1.46 | 4d | 1 | 1.48mi |
Listing history 9 events
-
2026-06-18days on market $299,000 Active 11 DOM
-
2026-06-17days on market $299,000 Active 10 DOM
-
2026-06-16days on market $299,000 Active 9 DOM
-
2026-06-15days on market $299,000 Active 8 DOM
-
2026-06-13days on market $299,000 Active 6 DOM
-
2026-06-10days on market $299,000 Active 3 DOM
-
2026-06-09days on market $299,000 Active 2 DOM
-
2026-06-08remarks 571-char remark
-
2026-06-08$299,000 Active 1 DOM
ⓘ Source: listings_history table (triggers on properties + properties_extension) + one-shot
backfill from property_details.listing_events for pre-trigger history.
Tax reassessment forecast VA · Resets to sale price
- Current annual tax
- $1,980 · $165/mo
- Projected year-2 tax
- $2,452 · $204/mo
- Expected delta
- +$472/yr (+$39/mo · 23.8%)
ⓘ Screening estimate from a state-policy table — verify with the county assessor before closing.
Climate risk First Street
- Flood 1/10 Low FEMA zone X (unshaded) · 0% chance over 30 yrs
- Wildfire 1/10 Low
- Heat 7/10 Severe 7 d/yr ≥105°F today · 16 d/yr by 30 yrs out
- Wind 6/10 Major 27% chance of damaging wind over 30 yrs
- Air quality 2/10 Low 1 unhealthy d/yr today · 3 by 30 yrs out
Nearby sold comps map
Loading sold comps map…
Walkable amenities ~0.75 mi
Loading nearby amenities…
Taxation est. · year 1
- Rental income
- $34,476
- − Mortgage interest
- −$16,749
- − Property taxes
- −$1,980
- − Insurance
- −$1,495
- − Repairs & maintenance
- −$2,758
- − Management
- −$2,758
- − Depreciation
- −$8,698
- Taxable income
- $38
- Est. tax owed @ 24.0%
- −$9
- After-tax cash flow
- $4,936/yr
For passive investors: Depreciation is non-cash, so a rental often shows a tax loss while cash-flowing — sheltering income. Rental losses are passive: they offset passive income freely, and up to $25,000/yr can offset ordinary (W-2) income if you actively participate and your MAGI is under $100k (phasing out to $0 by $150k); unused losses carry forward. On sale, claimed depreciation is recaptured at up to 25%, and gains may owe capital-gains tax (a 1031 exchange can defer both). Figures are a year-1 estimate at your 24.0% rate — not tax advice; consult a CPA.
Schools (NCES district)
- District
- Richmond City Public School District
- NCES district ID
- 5103240
- Math proficiency
- 32% ▼ -24.00%
- Reading proficiency
- 47% ▼ -9.00%
- Median HH income
- $40,276
- Composite
- 33.09/100
- National rank
- #5564
- State rank
- #123 of 131 in VA
Livability — Richmond
- Score
- 84/100
- State rank
- #33
- US rank
- #793
Category grades
Schools grade is shown separately in the Schools card above.
Census & demographics
- Census place
- Richmond, VA
- County
- Henrico County · 334,490 people
- City population
- 8,347
- Metro
- Richmond, VA
- Population (ZIP)
- 54,659
- Household income
- $55,731
- Rent vs Own
- Severe rent burden
- 3530.0
Population outlook (Richmond County) Hauer SSP2
- Today (2025)
- 262,263 people
- By 2030
- 284,503 · +8.5%
- By 2040
- 327,353 · +24.8%
- By 2050
- 367,946 · +40.3%
- By 2075
- 449,560 · +71.4%
- By 2100
- 500,301 · +90.8%
Race, ethnicity, and origin ACS 2023
- Neighborhood character
- Predominantly Black (71%)
- Race & ethnicity
- Black 71% White 19% Two or more races 5% Hispanic / Latino 5%
- Common ancestry
- Romanian 1% Lithuanian 1% Slovak 1%
- Foreign-born
- 4% · Canada
- Languages at home
- 93% English-only · Spanish 4% French/Haitian/Cajun 1% Other Indo-European 1%
Political lean MEDSL · Richmond
- 2024 margin
- Solid D (+66.3) · D 82.0% · R 15.8% · Other 2.2%
- 2008→2024 swing
- +7.2pp toward D · 2008: 59.1pp · 2024: 66.3pp
- All cycles
- 2024: D+66.3 2020: D+68.0 2016: D+63.8 2012: D+55.7 2008: D+59.1
Not yet ingested
- Civics
- —
Market trends
- HPI YoY
- ▼ -257.81%
- Current HPI
- 324.0589
- Rent YoY
- ▲ 6.38%
- Metro
- Richmond, VA
- State GDP YoY
- ▲ 2.40%
- F500 in state
- 50
Industry mix (Fortune 500 HQ in VA)
| Industry | F500 HQs | Revenue |
|---|---|---|
| Aerospace / Defense | 4 | $236B |
|
||
| Technology / Defense | 3 | $32B |
|
||
| Financial Services | 2 | $176B |
|
||
| Utilities | 2 | $27B |
|
||
| Insurance | 2 | $25B |
|
||
| Technology | 2 | $15B |
|
||
Price history
+1096.0% since first listed9 events — show timeline
- 2026-06-05 Listed $299,000 CVRMLS
- 2021-09-10 Sold (MLS) $190,000 CVRMLS
- 2021-08-10 Pending — CVRMLS
- 2021-08-09 Price Changed $210,000 CVRMLS
- 2021-08-02 Listed $225,000 CVRMLS
- 2021-08-02 Price Changed $225,000 CVRMLS
- 2002-05-23 Sold (MLS) $190,000 CVRMLS
- 2001-09-04 Listed $266,075 CVRMLS
- 1989-06-28 Sold (Public Records) $25,000 Public Records
Property tax history
+2.6%/yrLatest (2022): $1,980 · +14.6% YoY. Source: county tax records.
Cash-flow waterfall
monthlySold comps — $/sqft
last 12 mo · ≤1 miLoading sold comps…