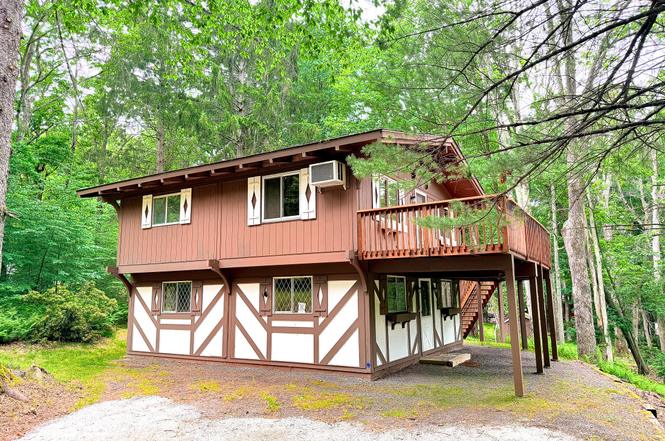
116 Heron Bay Rd · Hemlock Farms, PA
Flood risk 1/10 · Minimal
- FEMA flood zone
- X (unshaded)
- Chance of flooding over 30 yrs
- 0.0%
- Est. flood insurance / yr
- $473 – $860
Fire risk 4/10 · Minor
- Est. fire insurance / yr
- $511 – $949
Heat risk 2/10 · Minimal
- Hot days now (above 91°F)
- 7 days/yr
- Hot days in 30 yrs
- 15 days/yr
Wind risk 3/10 · Minor
- Chance of severe wind over 30 yrs
- 6.0%
Air-quality risk 2/10 · Minimal
- Unhealthy air days now
- 1 days/yr
- Unhealthy air days in 30 yrs
- 2 days/yr
Risk factors via First Street. Map © Google.
Why this score? — see what drove the A grade
The composite is a weighted blend of 9 inputs, each scored 0–100. Each bar is that input's sub-score; the figure is the points it added to the 100-point composite (weight × sub-score).
- Cash flow +30.0/30.0
- ARV discount +15.0/15.0
- 1% rule +10.0/10.0
- DSCR +10.0/10.0
- Appreciation +10.0/10.0
- Schools +4.2/10.0
- Livability +3.4/5.0
- Rent growth +2.5/5.0
- Condition / age +2.5/5.0
$249,999
🖨 Deal sheet 📄 Offer letter ✓ Due diligence
Listing remarks MLS
Move Right in!! This fine home is waiting for the next LUCKY BUYER! 3 bedrooms, Lower Level Family Room with brick fireplace, Large deck, Skylights, beautiful hardwood floors throughout the main level. Perfect Full time home or vacation Getaway. .. Call today for your private tour!, Baths: Y, Baths: Y, Eating Area: Dining Area
Key facts
- Access to lakes
- Access to beaches
- Cozy fireplace
Tags
Property features AI
Finance
- Other: Located in Hemlock Farms subdivision on a private maintained road with road maintenance agreement
- HOA & community: Part of a homeowners association; Annual association fee (listed) with options noted; Association amenities include pool (indoor and outdoor), clubhouse, fitness center, tennis and basketball courts, racquetball, recreation facilities, playground, park, picnic area, beach access/rights, lake, golf, fishing, restaurant, party room, and trash and water services
Exterior
- Parking: 6 parking spaces total; Open on-site/off-street driveway parking
- Security: Located in gated community with security guard, security service and key card entry
- Utilities: Electricity connected; Water connected; Septic tank
- Home design: Single-family house; Two levels; Entry level 12; Updated/remodeled condition
- Construction: Wood siding and concrete construction; Asphalt roof; Built with full finished basement
- Exterior features: Private entrance; Private yard; Deck; Shed(s) and storage; Wooded lot with many trees and front yard; Rectangular lot; Has view (overlooks Hemlock Lake area)
Interior
- Kitchen: Electric range and oven; Dishwasher; Microwave; Electric water heater
- Bedrooms: 7 total rooms (includes bedrooms and living spaces)
- Flooring: Hardwood; Tile; Laminate
- Bathrooms: 1 full bathroom; 1 half bathroom
- Heating & cooling: Electric heating; Wood heating and wood-burning fireplace; Ceiling fans for cooling
- Interior features: Beamed ceilings; Vaulted ceilings; Open floorplan; Natural woodwork; High ceilings; Ceiling fans; Finished daylight basement with walk-out and exterior entry; Basement has interior entry
- Laundry & utility: Stacked washer/dryer; Additional dryer; Laundry in basement/lower level (laundry closet)
Neighborhood map
What this means for you Summary
Snapshot
- This is a 3-bed/1.5-bath single-family listed at $250k.
Deal economics
- At list price, monthly cash flow is $1k ($16k/yr) — positive.
- The deal already cash-flows at list — no discount required.
- Meets the 1% rule at list price ($4k rent vs $250k).
- Cap rate 12.6% vs local median 7.1% in Hemlock Farms — top-decile yield for the area; either an underpriced asset or a hidden risk that comps aren't pricing in. Stress-test before assuming the spread holds.
Location & tenants
- Location reads 68/100 on livability (#884 in PA) — a middle-class / working-renter tenant base. Strengths: crime A+, housing A+, health & safety A+; Watch: schools C-, amenities F, commute F.
- Wallenpaupack Area SD (rural): math 39% / reading 59% proficiency, ranked #192 of 539 in PA (top 36%) — families likely to look elsewhere, expect single-tenant / working-renter base with shorter leases.
- Market conditions: 371 active listings in the ZIP; 4 comparable units currently listed for rent nearby; rentals leasing fast (median 1d on market — plan ~1-2 weeks tenant-placement turnaround); 213 units permitted in Pike County in 2024 (0 in 5+ unit buildings).
Forward outlook
- In year one you build about $27k of equity ($2k loan paydown + $25k appreciation (10.0% local appreciation)).
- Pike County population projected at -25% by 2050 — secular population decline; favor cash flow + early exit over multi-decade hold.
- At projected returns (10.0% appreciation + 3.0% rent growth), your $70k cash investment doubles in ~2 years — after that, you're playing with house money.
- By year 2, paydown + projected appreciation supports a ~$43k cash-out refi (75% LTV) — recoverable capital for the next deal without selling this one.
Negotiation context
- Only 3 days on market — expect competitive offers; lowballing is unlikely to land.
- 5 sale attempts since 7y ago with the ask held roughly flat each time — persistent listings suggest the price (not the market) is what's stuck; bring a comps-based counter.
- Current owner paid $66k; list at $250k implies a 276% gain — meaningful room to come down on a strong offer.
Questions for the listing agent
- Built in 1969 — when were the roof, HVAC, electrical panel, plumbing, and water heater last replaced?
- What does the HOA fee cover, when was the last increase, and are there any pending special assessments or reserve-fund shortfalls?
- Is there a deadline driving the sale (1031 exchange, divorce, estate, relocation)? That informs how much negotiation room exists.
- What's the average days-on-market for RENTAL listings here right now (not sales)? A rising rental-DOM trend means longer vacancies and softer asking-rent achievability than the comps imply.
- What's the recent tenant-quality profile in this submarket — average credit score on applications, eviction rate, late-payment / NSF rate, and stable-employment percentage? A property-management company in the area should have these aggregated.
- How much new for-sale + rental construction is in the pipeline within 1–3 miles? Heavy new supply typically softens prices + rents 12–24 months out; constrained supply supports both.
Investment metrics
- 1% rule
- 1.67% ✓
- Cap rate
- 12.63%
- Cash-on-cash
- 22.62%
- DSCR
- 2.01
- GRM
- 5.0
CMA / ARV
- ARV (on-the-fly)
- $299,936
- Comps found
- 12
Show comp detail 12 sales within ~0.75 mi
| Address | Dist | Beds/Ba | Sqft | Sold | Price | $/sf | Match |
|---|---|---|---|---|---|---|---|
| 800 Osprey Ct | 0.12mi | 3/2.0 | 1,568 (+8%) | 9mo | $310,000 | $198 | 73 |
| 603 Forest Dr | 0.09mi | 3/1.5 | 1,276 (-12%) | 12mo | $269,000 | $211 | 66 |
| 101 Ridgeway Dr | 0.66mi | 3/2.0 | 1,420 (-2%) | 6mo | $292,500 | $206 | 58 |
| 804 Rowel Ct | 0.46mi | 3/2.0 | 1,536 (+6%) | 18mo | $189,900 | $124 | 52 |
| 128 Saddlebrook Ln | 0.70mi | 3/2.0 | 1,539 (+6%) | 5mo | $385,000 | $250 | 52 |
| 119 Ridgeway Dr | 0.48mi | 3/2.5 | 1,662 (+14%) | 1mo | $549,000 | $330 | 49 |
| 120 Ridgeway Dr | 0.46mi | 3/2.0 | 1,641 (+13%) | 10mo | $280,000 | $171 | 47 |
| 803 Lariat Ct | 0.52mi | 4/2.0 (+1) | 1,588 (+9%) | 8mo | $190,000 | $120 | 47 |
| 109 Curlew Dr | 0.43mi | 2/2.0 (-1) | 1,332 (-8%) | 15mo | $311,000 | $233 | 46 |
| 121 Saddlebrook Ln | 0.71mi | 3/2.0 | 1,648 (+13%) | 8mo | $315,000 | $191 | 36 |
| 144 Pommel Dr | 0.71mi | 3/2.0 | 1,282 (-12%) | 14mo | $265,000 | $207 | 33 |
| 211 Stirrup Ln | 0.66mi | 3/2.0 | 1,638 (+12%) | 22mo | $283,500 | $173 | 28 |
Match score weights: distance 35% · size 25% · config 20% · recency 20%. Top-matched comps best support the ARV.
Projected returns pro-forma
10.0% appreciation · 3.0% rent growth · sell at horizon
- IRR
- 41.3%
- Equity multiple
- 4.15×
- Total profit
- $220,414
- Equity at exit
- $225,219
- IRR
- 35.6%
- Equity multiple
- 9.33×
- Total profit
- $583,424
- Equity at exit
- $485,693
Cash invested: $70,000 (down + closing). Projections, not guarantees.
Landlord ↔ Tenant lean methodology
- Overall (STATE)
- 62 Landlord-Friendly
- State Pennsylvania
- 62 Landlord-Friendly · EVEN
- County
- — inherits STATE
- City
- — inherits STATE
ZIP-level market 18428
- Home prices YoY
- 9.2%
- Active inventory
- 371
- Price-to-rent
- 5.0×
Monthly cashflow live
- Estimated rent
- $4,174 medium interval (Pro) →
- Mortgage (P&I)
- −$1,311
- Tax est. 1.5%
- −$312 /mo · $3,750/yr
- Insurance
- −$104
- HOA
- −$250
- Vacancy / Maint / Mgmt
- −$876
- Net cashflow
- $1,320
Break-even live
UW: 25.0% down · 7.5% · 30yr · 1.5% tax · 5.0% vac · 8.0% maint · 8.0% mgmt
Financing live
Cash to close
- Down payment
- $62,500
- Closing costs
- $7,500
- Reserves months
- —
- Total cash needed
- —
Loan-product check · same deal, 3 products live
Conventional
25% down · 7.5% · 30yr
- Down + closing
- —
- Monthly P&I
- —
- Monthly cashflow
- —
- DSCR
- —
- Eligible?
- —
Personal DTI + credit; lowest rate.
DSCR
20% down · 8.5% · 30yr
- Down + closing
- —
- Monthly P&I
- —
- Monthly cashflow
- —
- DSCR
- —
- Eligible?
- —
No personal income docs; deal must DSCR.
Hard money
10% down · 12.0% · 12mo
- Down + closing
- —
- Monthly P&I
- —
- Monthly cashflow
- —
- DSCR
- —
- Eligible?
- —
Short-term bridge; refi at stabilization.
Rent comps 4 comps
| Address | Beds | Baths | Sqft | Rent | $/sqft | DOM | Units | Dist |
|---|---|---|---|---|---|---|---|---|
| 101 Pommel Dr Hawley, PA | 3.0 | 2.0 | 1691 | $4,400 | $2.60 | 1d | 1 | 0.37mi |
| 313 Forest Dr Blooming Grove, PA | 3.0 | 2.0 | 1200 | $5,000 | $4.17 | 1d | 1 | 1.28mi |
| 811 Hickory Ct Hawley, PA | 3.0 | 2.0 | 1100 | $2,500 | $2.27 | 1d | 1 | 1.34mi |
| 113 Portage Ln Milford, PA | 3.0 | 2.0 | 1400 | $4,000 | $2.86 | 1d | 1 | 1.42mi |
HOA detail
- Monthly dues
- $250 · $3,000/yr
Listing history 4 events
-
2026-06-18days on market $249,999 Active 3 DOM
-
2026-06-17days on market $249,999 Active 2 DOM
-
2026-06-15remarks 699-char remark
-
2026-06-15$249,999 Active 1 DOM
ⓘ Source: listings_history table (triggers on properties + properties_extension) + one-shot
backfill from property_details.listing_events for pre-trigger history.
Climate risk First Street
- Flood 1/10 Low FEMA zone X (unshaded) · 0% chance over 30 yrs
- Wildfire 4/10 Moderate
- Heat 2/10 Low 7 d/yr ≥91°F today · 15 d/yr by 30 yrs out
- Wind 3/10 Moderate 6% chance of damaging wind over 30 yrs
- Air quality 2/10 Low 1 unhealthy d/yr today · 2 by 30 yrs out
Nearby sold comps map
Loading sold comps map…
Walkable amenities ~0.75 mi
Loading nearby amenities…
Taxation est. · year 1
- Rental income
- $50,084
- − Mortgage interest
- −$14,004
- − Property taxes
- −$3,750
- − Insurance
- −$1,250
- − Repairs & maintenance
- −$4,007
- − Management
- −$4,007
- − HOA
- −$3,000
- − Depreciation
- −$7,273
- Taxable income
- $12,794
- Est. tax owed @ 24.0%
- −$3,071
- After-tax cash flow
- $12,764/yr
For passive investors: Depreciation is non-cash, so a rental often shows a tax loss while cash-flowing — sheltering income. Rental losses are passive: they offset passive income freely, and up to $25,000/yr can offset ordinary (W-2) income if you actively participate and your MAGI is under $100k (phasing out to $0 by $150k); unused losses carry forward. On sale, claimed depreciation is recaptured at up to 25%, and gains may owe capital-gains tax (a 1031 exchange can defer both). Figures are a year-1 estimate at your 24.0% rate — not tax advice; consult a CPA.
Schools (NCES district)
- District
- Wallenpaupack Area SD
- NCES district ID
- 4224750
- Math proficiency
- 39% ▼ -10.00%
- Reading proficiency
- 59% ▼ -5.00%
- Median HH income
- $51,027
- Composite
- 41.97/100
- National rank
- #3345
- State rank
- #192 of 539 in PA
Livability — Hemlock Farms
- Score
- 68/100
- State rank
- #884
- US rank
- #9421
Category grades
Schools grade is shown separately in the Schools card above.
Census & demographics
- Census place
- Hemlock Farms, PA
- Population (ZIP)
- 12,446
Population outlook (Pike County) Hauer SSP2
- Today (2025)
- 53,548 people
- By 2030
- 51,622 · -3.6%
- By 2040
- 46,490 · -13.2%
- By 2050
- 40,372 · -24.6%
- By 2075
- 31,951 · -40.3%
- By 2100
- 26,821 · -49.9%
Race, ethnicity, and origin ACS 2023
- Neighborhood character
- Predominantly White (85%)
- Race & ethnicity
- White 85% Hispanic / Latino 8% Two or more races 6% Black 1% Asian 1%
- Hispanic origin (detail)
- Puerto Rican 5%
- Common ancestry
- Romanian 5% Portuguese 3% Italian 2%
- Foreign-born
- 5% · Canada
- Languages at home
- 91% English-only · Spanish 5% Russian/Polish/Slavic 1% Other Asian/Pacific 1%
Political lean MEDSL · Pike
- 2024 margin
- Strong R (+24.1) · D 37.6% · R 61.6%
- 2008→2024 swing
- -19.8pp toward R · 2008: -4.2pp · 2024: -24.1pp
- All cycles
- 2024: R+24.1 2020: R+19.0 2016: R+26.0 2012: R+11.0 2008: R+4.2
Not yet ingested
- Civics
- —
Market trends
- HPI YoY
- ▲ 28.60%
- Current HPI
- 340.8254
- Rent YoY
- —
- Metro
- —
- State GDP YoY
- ▲ 1.68%
- F500 in state
- 34
Industry mix (Fortune 500 HQ in PA)
| Industry | F500 HQs | Revenue |
|---|---|---|
| Healthcare | 2 | $309B |
|
||
| Insurance | 2 | $27B |
|
||
| Telecommunications / Media | 1 | $124B |
|
||
| Industrial Distribution | 1 | $22B |
|
||
| Financial Services | 1 | $20B |
|
||
| Chemicals / Materials | 1 | $18B |
|
||
Price history
+275.9% since first listed8 events — show timeline
- 2026-06-15 Listed $249,999 PWMLS
- 2019-10-25 Sold (MLS) $66,500 PWMLS
- 2019-10-25 Sold (MLS) — PWMLS
- 2019-10-25 Sold (MLS) $66,500 PWMLS
- 2019-05-21 Listed $85,000 PMAR
- 2019-05-17 Listed $66,500 PWMLS
- 2019-05-17 Listed $66,500 PWMLS
- 2019-05-17 Listed $66,500 PWMLS
Cash-flow waterfall
monthlySold comps — $/sqft
last 12 mo · ≤1 miLoading sold comps…