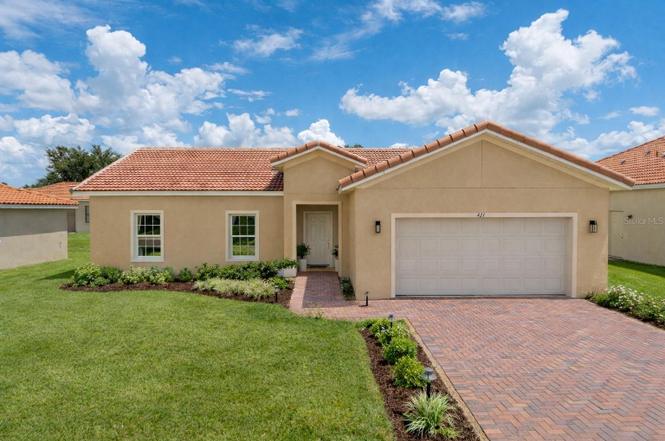
436 Caraway Dr · Poinciana, FL
Flood risk 1/10 · Minimal
- FEMA flood zone
- X (unshaded)
- Chance of flooding over 30 yrs
- 0.0%
- Est. flood insurance / yr
- $507 – $1,088
Fire risk 5/10 · Moderate
- Est. fire insurance / yr
- $947 – $1,759
Heat risk 8/10 · Major
- Hot days now (above 108°F)
- 7 days/yr
- Hot days in 30 yrs
- 24 days/yr
Wind risk 9/10 · Severe
- Chance of severe wind over 30 yrs
- 99.0%
Air-quality risk 1/10 · Minimal
- Unhealthy air days now
- 0 days/yr
- Unhealthy air days in 30 yrs
- 0 days/yr
Risk factors via First Street. Map © Google.
Why this score? — see what drove the F grade
The composite is a weighted blend of 9 inputs, each scored 0–100. Each bar is that input's sub-score; the figure is the points it added to the 100-point composite (weight × sub-score).
- ARV discount +7.5/15.0
- Cash flow +5.0/30.0
- Appreciation +4.3/10.0
- Schools +3.5/10.0
- Livability +2.9/5.0
- Rent growth +2.8/5.0
- Condition / age +2.5/5.0
- 1% rule +1.9/10.0
- DSCR +0.0/10.0
$299,999
🖨 Deal sheet (PDF) 📄 Offer letter ✓ Due diligence
Listing remarks
Under contract-accepting backup offers. Step into the feeling of finally being home. This brand-new, move-in ready 4-bedroom, 3-bath home in the gated community of Tuscany Preserve was designed for the way people actually live today — open, bright, and effortlessly comfortable. With nearly 1,900 sq. ft. of living space, the soaring cathedral ceilings and open-concept layout immediately make the home feel expansive yet welcoming, perfect for quiet mornings or hosting family and friends. At the heart of the home, the kitchen shines with modern white cabinetry, premium appliances, and generous counter space that makes everything from weeknight dinners to holiday gatherings feel special.
Key facts
- Gated community
- Tranquil lake
- Splash pool
Tags
Neighborhood map
What this means for you Summary
Snapshot
- This is a 4-bed/3.0-bath land listed at $300k.
Deal economics
- At list price, monthly cash flow is $-701 ($-8k/yr) — negative.
- To cash-flow at today's rent, offer at most $199k (33.8% below list).
- To meet the 1% rule (rent ≥ 1% of price), the offer needs to be $208k (30.6% below list).
- Recommended offer: $199k (33.8% below list) — sets the bar for cash-flow.
Location & tenants
- Location reads 57/100 on livability (#859 in FL) — a working-class tenant base; expect higher turnover. Strengths: cost of living A+, housing A+; Watch: employment D+, amenities F, commute F.
- Polk (suburban): math 39% / reading 43% proficiency, ranked #62 of 73 in FL (top 85%) — families likely to look elsewhere, expect single-tenant / working-renter base with shorter leases.
- Zoned schools: Laurel Elementary School (math 26% / reading 34%, grade F, #1,882 of 2,144 statewide, top 88%, 1,058 students, 50% FRL); Lake Marion Creek Middle School (math 22% / reading 27%, grade F, #522 of 571 statewide, top 93%, 1,044 students, 58% FRL); New Beginnings High School (math 5% / reading 8%, grade F, #655 of 667 statewide, top 98%, 753 students, 66% FRL, charter) — zoned schools at 58% FRL track the district average.
- Zoned-school proficiency averages 20% at this address vs 41% district-wide (-21 pts) — the specific schools serving this property underperform the Polk average; the district grade overstates school quality for this exact location.
- Market conditions: Rents rising (+1.1%/yr); 1155 active listings in the ZIP; 40 comparable units currently listed for rent nearby; rentals leasing fast (median 14d on market — plan ~1-2 weeks tenant-placement turnaround); 10,384 units permitted in Polk County in 2024 (1,716 in 5+ unit buildings).
- This rent runs 36% of the median local income ($69k/yr) — at the standard rent-burdened threshold; future hikes will face affordability resistance.
Forward outlook
- Local home prices are declining (-1.5%/yr); year-one equity from $2k of loan paydown is wiped out by about $4k of value loss. Plan a longer hold.
- Polk County population projected at +33% by 2050 — long-run rental-demand tailwind backs the buy-and-hold thesis.
Negotiation context
- It's been on market 216 days — a 12% lower offer ($264k) is reasonable based on typical stale-listing flexibility.
- 5 sale attempts since 4y ago; this cycle's ask has dropped $39k (12%) from the opening price — seller is motivated, your offer sets the floor, not the list.
- Current owner paid $62k; list at $300k implies a 380% gain — meaningful room to come down on a strong offer.
Risks & watch-outs
- Climate carrying-cost: severe wind risk, 99% chance of damaging wind over 30y; moderate wildfire risk; extreme-heat days projected 7→24/yr by 2055 (HVAC capex compounding) — expect insurance premiums to compound above CPI over the hold.
Questions for the listing agent
- What do current leases actually rent for vs. the listed asking? Can we see a recent rent roll and the last 12 months of T-12 income?
- It's been on market 216 days. Have you received any prior offers? Is the seller open to a 34% concession, seller financing, or rate buy-down credit?
- What does the HOA fee cover, when was the last increase, and are there any pending special assessments or reserve-fund shortfalls?
- Why hasn't it sold? Are there any deal-killer items the seller is aware of (foundation, flood, title, zoning, code violations)?
- Is there a deadline driving the sale (1031 exchange, divorce, estate, relocation)? That informs how much negotiation room exists.
- Schools are F-rated, which usually means shorter tenancies and higher turnover. Who's the typical renter profile here, and what's been the actual vacancy rate?
- The area grade is low — what's the realistic commute time and amenity access for the typical tenant pool here? Any planned neighborhood developments (good or bad) we should know about?
- What's the average days-on-market for RENTAL listings here right now (not sales)? A rising rental-DOM trend means longer vacancies and softer asking-rent achievability than the comps imply.
- What's the recent tenant-quality profile in this submarket — average credit score on applications, eviction rate, late-payment / NSF rate, and stable-employment percentage? A property-management company in the area should have these aggregated.
- How much new for-sale + rental construction is in the pipeline within 1–3 miles? Heavy new supply typically softens prices + rents 12–24 months out; constrained supply supports both.
Investment metrics
- 1% rule
- 0.69% ✗
- Cap rate
- 3.49%
- Cash-on-cash
- -10.01%
- DSCR
- 0.55
- GRM
- 12.0
CMA / ARV
No comps found within radius.
Projected returns pro-forma
-1.48% appreciation · 1.14% rent growth · sell at horizon
- IRR
- -23.3%
- Equity multiple
- 0.08×
- Total profit
- $-77,271
- Equity at exit
- $65,586
- IRR
- -19.7%
- Equity multiple
- -0.44×
- Total profit
- $-121,113
- Equity at exit
- $63,207
Cash invested: $84,000 (down + closing). Projections, not guarantees.
Landlord ↔ Tenant lean methodology
- Overall (STATE)
- 87 Strongly Landlord-Friendly
- State Florida
- 87 Strongly Landlord-Friendly · R+3
- County
- — inherits STATE
- City
- — inherits STATE
ZIP-level market 34759
- Home prices YoY
- -0.5%
- Rents YoY
- 1.1%
- Active inventory
- 1155
- Price-to-rent
- 12.0×
Monthly cashflow live
- Estimated rent
- $2,082 high interval (Pro) →
- Mortgage (P&I)
- −$1,573
- Tax est. 1.5%
- −$375 /mo · $4,500/yr
- Insurance
- −$125
- HOA
- −$272
- Vacancy / Maint / Mgmt
- −$437
- Net cashflow
- $-701
Break-even live
Sensitivity live
| Price | -10% $-494 | -5% $-597 | +0% $-701 | +5% $-804 | +10% $-908 |
|---|---|---|---|---|---|
| Rent | -10% $-865 | -5% $-783 | +0% $-701 | +5% $-619 | +10% $-536 |
| Rate | -1.0pp $-550 | -0.5pp $-625 | base $-701 | +0.5pp $-779 | +1.0pp $-858 |
UW: 25.0% down · 7.5% · 30yr · 1.5% tax · 5.0% vac · 8.0% maint · 8.0% mgmt
Financing live
Cash to close
- Down payment
- $75,000
- Closing costs
- $9,000
- Reserves months
- —
- Total cash needed
- —
Loan-product check · same deal, 3 products live
Conventional
25% down · 7.5% · 30yr
- Down + closing
- —
- Monthly P&I
- —
- Monthly cashflow
- —
- DSCR
- —
- Eligible?
- —
Personal DTI + credit; lowest rate.
DSCR
20% down · 8.5% · 30yr
- Down + closing
- —
- Monthly P&I
- —
- Monthly cashflow
- —
- DSCR
- —
- Eligible?
- —
No personal income docs; deal must DSCR.
Hard money
10% down · 12.0% · 12mo
- Down + closing
- —
- Monthly P&I
- —
- Monthly cashflow
- —
- DSCR
- —
- Eligible?
- —
Short-term bridge; refi at stabilization.
Rent comps 40 comps
| Address | Beds | Baths | Sqft | Rent | $/sqft | DOM | Units | Dist |
|---|---|---|---|---|---|---|---|---|
| 446 Caraway Dr Kissimmee, FL | 3.0 | 2.0 | 1334 | $1,675 | $1.26 | 25d | 1 | 0.05mi |
| 439 Caraway Dr Kissimmee, FL | 4.0 | 2.0 | 1791 | $1,800 | $1.01 | 5d | 1 | 0.06mi |
| 922 Centaury Dr Unit 1 Poinciana, FL | 3.0 | 3.0 | 2166 | $1,900 | $0.88 | 16d | 1 | 0.10mi |
| 404 Cinnamon Dr Kissimmee, FL | 3.0 | 2.0 | 1321 | $1,775 | $1.34 | 16d | 1 | 0.12mi |
| 452 Cinnamon Dr Kissimmee, FL | 4.0 | 2.0 | 1793 | $2,000 | $1.12 | 25d | 1 | 0.12mi |
| 333 Daffodil Ln Kissimmee, FL | 4.0 | 2.0 | 1851 | $2,040 | $1.10 | 16d | 1 | 0.28mi |
| 339 W Aster Ct Kissimmee, FL | 3.0–4.0 | 2.0–3.0 | 1504 | $2,345 | $1.56 | 4d | 1 | 0.37mi |
| 305 Elderberry Ct Kissimmee, FL | 4.0 | 2.0 | 1560 | $2,000 | $1.28 | 5d | 1 | 0.37mi |
| 2150 Mystic Ring Loop Kissimmee, FL | 3.0 | 2.0 | 1245 | $1,700 | $1.37 | 13d | 1 | 0.38mi |
| 1282 Clove Dr Kissimmee, FL | 4.0 | 2.5 | 1906 | $1,600 | $0.84 | 5d | 1 | 0.39mi |
| 2140 Mystic Ring Loop Kissimmee, FL | 3.0 | 2.0 | 1245 | $1,495 | $1.20 | 16d | 1 | 0.39mi |
| 207 Begonia Ln Kissimmee, FL | 4.0 | 2.0 | 1623 | $1,925 | $1.19 | 25d | 1 | 0.40mi |
| 302 Elderberry Ct Kissimmee, FL | 4.0 | 2.0 | 1670 | $2,200 | $1.32 | 25d | 1 | 0.41mi |
| 302 W Aster Ct Kissimmee, FL | 4.0 | 2.0 | 1670 | $2,240 | $1.34 | 5d | 1 | 0.42mi |
| 309 Fern Ct Kissimmee, FL | 4.0 | 2.5 | 1767 | $2,150 | $1.22 | 5d | 1 | 0.44mi |
| 1130 Chervil Dr Kissimmee, FL | 3.0 | 2.5 | 1495 | $1,575 | $1.05 | 25d | 1 | 0.44mi |
| 1110 Chervil Dr Kissimmee, FL | 3.0 | 2.5 | 2110 | $1,575 | $0.75 | 25d | 1 | 0.44mi |
| 316 Fern Ct Kissimmee, FL | 4.0 | 2.0 | 1605 | $1,775 | $1.11 | 5d | 1 | 0.44mi |
| 431 Arkansas Ct Kissimmee, FL | 4.0 | 2.5 | 1764 | $1,895 | $1.07 | 5d | 1 | 0.48mi |
| 204 Fig Ct Kissimmee, FL | 4.0 | 2.5 | 1823 | $2,080 | $1.14 | 25d | 1 | 0.54mi |
| 407 Arkansas Ct Kissimmee, FL | 3.0 | 2.0 | 1858 | $1,600 | $0.86 | 13d | 1 | 0.56mi |
| 319 Erie Dr Kissimmee, FL | 3.0 | 2.0 | 1310 | $1,765 | $1.35 | 16d | 1 | 0.57mi |
| 325 Hibiscus Dr Kissimmee, FL | 4.0 | 2.0 | 1605 | $1,995 | $1.24 | 5d | 1 | 0.57mi |
| 337 Hibiscus Dr Kissimmee, FL | 4.0 | 2.0 | 1670 | $1,980 | $1.19 | 16d | 1 | 0.58mi |
| 216 Fig Ct Kissimmee, FL | 3.0 | 2.0 | 1852 | $2,005 | $1.08 | 5d | 1 | 0.59mi |
| 216 Fig Ct Kissimmee, FL | 4.0 | 2.5 | 1823 | $2,080 | $1.14 | 16d | 1 | 0.59mi |
| 319 Erie Ct Kissimmee, FL | 3.0 | 2.0 | 1310 | $1,815 | $1.39 | 25d | 1 | 0.61mi |
| 222 Fig Ct Kissimmee, FL | 4.0 | 2.5 | 1823 | $1,970 | $1.08 | 5d | 1 | 0.61mi |
| 222 Fig Ct Kissimmee, FL | 3.0 | 2.0 | 1852 | $1,970 | $1.06 | 5d | 1 | 0.61mi |
| 145 Ocean Bluff Dr Kissimmee, FL | 3.0 | 2.0 | 1249 | $1,500 | $1.20 | 25d | 1 | 0.62mi |
| 344 Hibiscus Dr Kissimmee, FL | 4.0 | 2.0 | 1670 | $1,825 | $1.09 | 5d | 1 | 0.63mi |
| 210 Goldenrod Ln Kissimmee, FL | 4.0 | 2.0 | 1626 | $1,875 | $1.15 | 25d | 1 | 0.65mi |
| 207 Gladiola Ct Kissimmee, FL | 4.0 | 2.0 | 1605 | $1,855 | $1.16 | 5d | 1 | 0.66mi |
| 105 Zinnia Ln W Kissimmee, FL | 4.0 | 2.0 | 1600 | $2,100 | $1.31 | 5d | 1 | 0.68mi |
| 260 Gladiola Ct Kissimmee, FL | 4.0 | 2.0 | 1670 | $2,065 | $1.24 | 5d | 1 | 0.70mi |
| 263 Gladiola Ct Kissimmee, FL | 4.0 | 2.0 | 1605 | $1,750 | $1.09 | 16d | 1 | 0.73mi |
| 2129 Hibiscus Pl Kissimmee, FL | 4.0 | 2.0 | 1765 | $2,100 | $1.19 | 5d | 1 | 0.75mi |
| 2005 Maple Ln Kissimmee, FL | 4.0 | 2.0 | 1669 | $1,719 | $1.03 | 5d | 1 | 0.76mi |
| 1951 Michigan Dr Kissimmee, FL | 4.0 | 2.0 | 1562 | $2,060 | $1.32 | 16d | 1 | 0.76mi |
| 2006 Maple Ln Kissimmee, FL | 4.0 | 2.0 | 1886 | $2,040 | $1.08 | 5d | 1 | 0.78mi |
HOA detail
- Monthly dues
- $272 · $3,264/yr
- Likely covers
- security
Listing history 15 events
-
2026-04-27status Pending
-
2026-02-17price $299,999
-
2026-01-16price $309,000
-
2025-11-07price $320,000
-
2025-09-23$339,000 Active
-
2025-08-12historical
-
2025-06-16$315,000 Active
-
2024-12-31historical
-
2024-05-27$349,999 Active
-
2023-01-20historical
-
2022-08-05status Active
-
2022-08-01$384,999 Active
-
2021-07-29soldstatus $62,500
-
2014-03-05soldstatus $29,800
-
1995-03-23soldstatus $9,494
ⓘ Source: listings_history table (triggers on properties + properties_extension) + one-shot
backfill from property_details.listing_events for pre-trigger history.
Climate risk First Street
- Flood 1/10 Low FEMA zone X (unshaded) · 0% chance over 30 yrs
- Wildfire 5/10 Major
- Heat 8/10 Severe 7 d/yr ≥108°F today · 24 d/yr by 30 yrs out
- Wind 9/10 Extreme 99% chance of damaging wind over 30 yrs
- Air quality 1/10 Low 0 unhealthy d/yr today · 0 by 30 yrs out
Nearby sold comps map
Loading sold comps map…
Walkable amenities ~0.75 mi
Loading nearby amenities…
Taxation est. · year 1
- Rental income
- $24,978
- − Mortgage interest
- −$16,805
- − Property taxes
- −$4,500
- − Insurance
- −$1,500
- − Repairs & maintenance
- −$1,998
- − Management
- −$1,998
- − HOA
- −$3,264
- − Depreciation
- −$8,727
- Taxable loss
- −$13,814
- Est. tax savings @ 24.0%
- +$3,315
- After-tax cash flow
- $-5,095/yr
For passive investors: Depreciation is non-cash, so a rental often shows a tax loss while cash-flowing — sheltering income. Rental losses are passive: they offset passive income freely, and up to $25,000/yr can offset ordinary (W-2) income if you actively participate and your MAGI is under $100k (phasing out to $0 by $150k); unused losses carry forward. On sale, claimed depreciation is recaptured at up to 25%, and gains may owe capital-gains tax (a 1031 exchange can defer both). Figures are a year-1 estimate at your 24.0% rate — not tax advice; consult a CPA.
Schools (NCES district)
- District
- Polk
- NCES district ID
- 1201590
- Math proficiency
- 39% ▼ -11.00%
- Reading proficiency
- 43% ▼ -4.00%
- Median HH income
- $43,979
- Composite
- 34.74/100
- National rank
- #5132
- State rank
- #62 of 73 in FL
Livability — Poinciana
- Score
- 57/100
- State rank
- #859
- US rank
- #21760
Category grades
Schools grade is shown separately in the Schools card above.
Census & demographics
- Census place
- Poinciana, FL
- County
- Polk County · 740,051 people
- City population
- 91,336
- Metro
- Lakeland-Winter Haven, FL
- Population (ZIP)
- 44,568
- Household income
- $69,373
- Rent vs Own
- Severe rent burden
- 1186.0
Population outlook (Polk County) Hauer SSP2
- Today (2025)
- 752,975 people
- By 2030
- 804,621 · +6.9%
- By 2040
- 906,117 · +20.3%
- By 2050
- 1,000,476 · +32.9%
- By 2075
- 1,197,520 · +59.0%
- By 2100
- 1,271,518 · +68.9%
Race, ethnicity, and origin ACS 2023
- Neighborhood character
- Diverse neighborhood (Simpson 0.62)
- Race & ethnicity
- Hispanic / Latino 55% White 21% Two or more races 20% Black 19%
- Hispanic origin (detail)
- Mexican 2% Puerto Rican 38% Cuban 6% Dominican 3%
- Common ancestry
- Hispanic 3% Romanian 2% Scotch-Irish 1%
- Foreign-born
- 17% · Canada, Jamaica
- Languages at home
- 49% English-only · Spanish 48% French/Haitian/Cajun 2%
Political lean MEDSL · Polk
- 2024 margin
- Strong R (+20.7) · D 39.2% · R 59.9%
- 2008→2024 swing
- -14.6pp toward R · 2008: -6.1pp · 2024: -20.7pp
- All cycles
- 2024: R+20.7 2020: R+14.4 2016: R+14.1 2012: R+6.8 2008: R+6.1
Not yet ingested
- Civics
- —
Market trends
- HPI YoY
- ▼ -1.48%
- Current HPI
- 276.6861
- Rent YoY
- ▲ 1.14%
- Metro
- Lakeland-Winter Haven, FL
- State GDP YoY
- ▲ 3.28%
- F500 in state
- 36
Industry mix (Fortune 500 HQ in FL)
| Industry | F500 HQs | Revenue |
|---|---|---|
| Industrial Technology | 2 | $29B |
|
||
| Insurance | 2 | $17B |
|
||
| Retail | 1 | $60B |
|
||
| Technology Distribution | 1 | $58B |
|
||
| Homebuilding | 1 | $35B |
|
||
| Technology Manufacturing | 1 | $35B |
|
||
Price history
+3059.9% since first listed15 events — show timeline
- 2026-04-27 Pending — Stellar MLS as Distributed by MLS Grid
- 2026-02-17 Price Changed $299,999 Stellar MLS as Distributed by MLS Grid
- 2026-01-16 Price Changed $309,000 Stellar MLS as Distributed by MLS Grid
- 2025-11-07 Price Changed $320,000 Stellar MLS as Distributed by MLS Grid
- 2025-09-23 Listed $339,000 Stellar MLS as Distributed by MLS Grid
- 2025-08-12 Listing Removed — Stellar MLS as Distributed by MLS Grid
- 2025-06-16 Listed $315,000 Stellar MLS as Distributed by MLS Grid
- 2024-12-31 Listing Removed — Stellar MLS as Distributed by MLS Grid
- 2024-05-27 Listed $349,999 Stellar MLS as Distributed by MLS Grid
- 2023-01-20 Listing Removed — Stellar MLS as Distributed by MLS Grid
- 2022-08-05 Relisted — Stellar MLS as Distributed by MLS Grid
- 2022-08-01 Listed $384,999 Stellar MLS as Distributed by MLS Grid
- 2021-07-29 Sold (Public Records) $62,500 Public Records
- 2014-03-05 Sold (Public Records) $29,800 Public Records
- 1995-03-23 Sold (Public Records) $9,494 Public Records
Property tax history
+14.0%/yrLatest (2025): $439 · +4.0% YoY. Source: county tax records.
Cash-flow waterfall
monthlySold comps — $/sqft
last 12 mo · ≤1 miLoading sold comps…