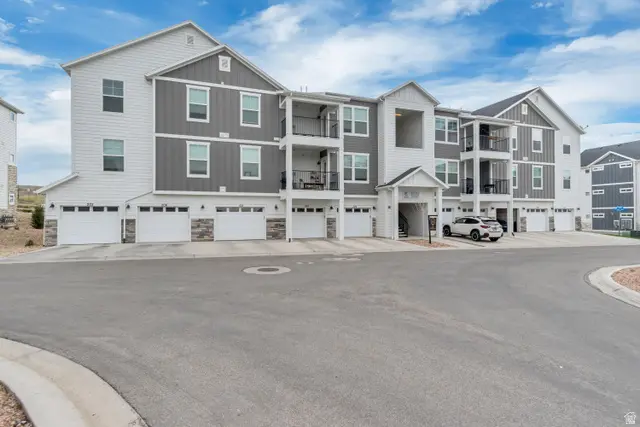
972 W Spider Green Way N #303 · Saratoga Springs, UT
Flood risk No data
- FEMA flood zone
- —
- Chance of flooding over 30 yrs
- —
- Est. flood insurance / yr
- —
Fire risk No data
- Est. fire insurance / yr
- —
Heat risk No data
- Hot days now (above threshold)
- —
- Hot days in 30 yrs
- —
Wind risk No data
- Chance of severe wind over 30 yrs
- —
Air-quality risk No data
- Unhealthy air days now
- —
- Unhealthy air days in 30 yrs
- —
Risk factors via First Street. Map © Google.
Why this score? — see what drove the D grade
The composite is a weighted blend of 9 inputs, each scored 0–100. Each bar is that input's sub-score; the figure is the points it added to the 100-point composite (weight × sub-score).
- Appreciation +10.0/10.0
- ARV discount +7.5/15.0
- Cash flow +6.7/30.0
- Schools +4.2/10.0
- Livability +3.5/5.0
- Rent growth +2.7/5.0
- Condition / age +2.5/5.0
- 1% rule +2.3/10.0
- DSCR +0.9/10.0
$299,900
🖨 Deal sheet (PDF) 📄 Offer letter ✓ Due diligence
Listing remarks
* * Ask about our 5.25% fixed interest rate plus seller paid first year of HOA Master Fee * * All condos are not created equally. This unit number is 303 so you get top floor, Vaulted Ceilings, a balcony that overlooks your driveway and a garage with an access door from the breezeway. This community sits close enough to Costco, shopping, medical and restaurants. Tucked away in the back corner of the Wildflower subdivision so you are not affected by the pesky traffic Saratoga has become notorious for. Ask to see it today!
Key facts
- Garage access door
- Close to medical
- Vaulted ceilings
Tags
Property features AI
Finance
- HOA & community: Homeowners association with monthly fee; HOA fee $395 per month; Community clubhouse; Community amenities include biking and hiking trails, playground, pool, picnic area, and pet-friendly rules; Subdivision: Wildflower
Exterior
- Parking: One covered garage space; One open parking space (total 2 parking spaces); Has garage
- Utilities: Natural gas connected; Electricity connected; Sewer connected; Culinary (domestic) water
- Home design: Condo, top-level unit; Faces south; Residential use; Built/standing condition
- Construction: Asphalt construction materials; Asphalt roof; No basement; Home warranty included
- Exterior features: Balcony; Double-pane windows; Curb and gutter; Paved roads and sidewalks; Automatic full sprinkler system; Mountain view; Full landscaping
Interior
- Kitchen: Free-standing range/oven; Refrigerator; Disposal
- Bedrooms: Three bedrooms (all on the main/first level); Primary bedroom on the 1st floor
- Flooring: Carpet
- Bathrooms: Two full bathrooms
- Heating & cooling: Gas central heating (≥95% efficiency); Central air conditioning
- Interior features: Primary bathroom; Walk-in closet; Food disposal; Free-standing range/oven; Blinds on windows
- Laundry & utility: Washer; Dryer; Electric dryer hookup
Neighborhood map
What this means for you Summary
Snapshot
- This is a 3-bed/2.0-bath condo listed at $300k.
Deal economics
- At list price, monthly cash flow is $-481 ($-6k/yr) — negative.
- To cash-flow at today's rent, offer at most $215k (28.3% below list).
- To meet the 1% rule (rent ≥ 1% of price), the offer needs to be $219k (27.0% below list).
- Recommended offer: $215k (28.3% below list) — sets the bar for cash-flow.
Location & tenants
- Location reads 70/100 on livability (#93 in UT) — a middle-class / working-renter tenant base. Strengths: crime A+, employment A+, housing A+; Watch: amenities F, commute F, cost of living F.
- Alpine District (suburban): math 45% / reading 50% proficiency, ranked #25 of 80 in UT (top 31%) — families likely to look elsewhere, expect single-tenant / working-renter base with shorter leases; only 18% free/reduced lunch — higher-income household profile.
- Zoned schools: Harvest School (math 56% / reading 51%, grade C, #122 of 585 statewide, top 21%, 1,046 students, 15% FRL); Vista Heights Middle (math 50% / reading 51%, grade D+, #25 of 171 statewide, top 15%, 1,519 students, 16% FRL); Westlake High (math 39% / reading 48%, grade F, #50 of 171 statewide, top 29%, 2,659 students, 12% FRL) — zoned schools at 14% FRL track the district average.
- Market conditions: Rents flat; 1187 active listings in the ZIP; 12 comparable units currently listed for rent nearby; rentals at typical pace (median 16d on market — plan ~3-4 weeks tenant-placement turnaround); high-income renter base; 6,326 units permitted in Utah County in 2024 (1,053 in 5+ unit buildings).
Forward outlook
- In year one you build about $32k of equity ($2k loan paydown + $30k appreciation (10.0% local appreciation)).
- Utah County population projected at +49% by 2050 — long-run rental-demand tailwind backs the buy-and-hold thesis.
- By year 2, paydown + projected appreciation supports a ~$52k cash-out refi (75% LTV) — recoverable capital for the next deal without selling this one.
Negotiation context
- It's been on market 29 days — a 2% lower offer ($295k) is reasonable based on typical stale-listing flexibility.
- 2 sale attempts with the ask held roughly flat each time — persistent listings suggest the price (not the market) is what's stuck; bring a comps-based counter.
Questions for the listing agent
- What do current leases actually rent for vs. the listed asking? Can we see a recent rent roll and the last 12 months of T-12 income?
- What does the HOA fee cover, when was the last increase, and are there any pending special assessments or reserve-fund shortfalls?
- Any open or pending special assessments — roof, HVAC, plumbing, elevator, façade? What's the per-unit balance and payoff schedule, and is the seller paying it off at close or rolling it to the buyer?
- Is there a deadline driving the sale (1031 exchange, divorce, estate, relocation)? That informs how much negotiation room exists.
- Schools are B-rated — typically a magnet for longer-tenancy family renters. What's the average tenant stay here, and is there a school-zone premium baked into asking?
- The area grade is low — what's the realistic commute time and amenity access for the typical tenant pool here? Any planned neighborhood developments (good or bad) we should know about?
- What's the average days-on-market for RENTAL listings here right now (not sales)? A rising rental-DOM trend means longer vacancies and softer asking-rent achievability than the comps imply.
- What's the recent tenant-quality profile in this submarket — average credit score on applications, eviction rate, late-payment / NSF rate, and stable-employment percentage? A property-management company in the area should have these aggregated.
- How much new apartment / multifamily construction is in the pipeline within 1–3 miles? Heavy new supply (>2% of stock underway) typically softens rents 12–24 months out; light construction supports rent growth.
Investment metrics
- 1% rule
- 0.73% ✗
- Cap rate
- 4.37%
- Cash-on-cash
- -6.87%
- DSCR
- 0.69
- GRM
- 11.4
CMA / ARV
No comps found within radius.
Projected returns pro-forma
10.0% appreciation · 0.68% rent growth · sell at horizon
- IRR
- 18.8%
- Equity multiple
- 2.52×
- Total profit
- $127,830
- Equity at exit
- $270,174
- IRR
- 17.0%
- Equity multiple
- 5.66×
- Total profit
- $391,557
- Equity at exit
- $582,640
Cash invested: $83,972 (down + closing). Projections, not guarantees.
Landlord ↔ Tenant lean methodology
- Overall (STATE)
- 86 Strongly Landlord-Friendly
- State Utah
- 86 Strongly Landlord-Friendly · R+15
- County
- — inherits STATE
- City
- — inherits STATE
ZIP-level market 84045
- Home prices YoY
- 3.9%
- Rents YoY
- 0.7%
- Active inventory
- 1187
- Price-to-rent
- 11.4×
Monthly cashflow live
- Estimated rent
- $2,188 high interval (Pro) →
- Mortgage (P&I)
- −$1,573
- Tax from tax record
- −$117 /mo · $1,403/yr
- Insurance
- −$125
- HOA
- −$395
- Vacancy / Maint / Mgmt
- −$460
- Net cashflow
- $-481
Break-even live
Sensitivity live
| Price | -10% $-311 | -5% $-396 | +0% $-481 | +5% $-566 | +10% $-651 |
|---|---|---|---|---|---|
| Rent | -10% $-654 | -5% $-567 | +0% $-481 | +5% $-394 | +10% $-308 |
| Rate | -1.0pp $-330 | -0.5pp $-405 | base $-481 | +0.5pp $-559 | +1.0pp $-638 |
UW: 25.0% down · 7.5% · 30yr · 1.5% tax · 5.0% vac · 8.0% maint · 8.0% mgmt
Financing live
Cash to close
- Down payment
- $74,975
- Closing costs
- $8,997
- Reserves months
- —
- Total cash needed
- —
Loan-product check · same deal, 3 products live
Conventional
25% down · 7.5% · 30yr
- Down + closing
- —
- Monthly P&I
- —
- Monthly cashflow
- —
- DSCR
- —
- Eligible?
- —
Personal DTI + credit; lowest rate.
DSCR
20% down · 8.5% · 30yr
- Down + closing
- —
- Monthly P&I
- —
- Monthly cashflow
- —
- DSCR
- —
- Eligible?
- —
No personal income docs; deal must DSCR.
Hard money
10% down · 12.0% · 12mo
- Down + closing
- —
- Monthly P&I
- —
- Monthly cashflow
- —
- DSCR
- —
- Eligible?
- —
Short-term bridge; refi at stabilization.
Rent comps 12 comps
| Address | Beds | Baths | Sqft | Rent | $/sqft | DOM | Units | Dist |
|---|---|---|---|---|---|---|---|---|
| 2273 N Elderberry Dr Unit 1387177P Saratoga Springs, UT | 2.0 | 1.0 | 990 | $1,951 | $1.97 | 25d | 1 | 0.65mi |
| 1514 W Bright Eyes Ln Saratoga Springs, UT | 3.0 | 2.5 | 1714 | $2,300 | $1.34 | 25d | 1 | 0.70mi |
| 1508 Charmer Ln Eagle Mountain, UT | 4.0 | 2.5 | 1831 | $2,550 | $1.39 | 16d | 1 | 0.70mi |
| 1545 Bravo Dr Eagle Mountain, UT | 4.0 | 2.5 | 1831 | $2,500 | $1.37 | 16d | 1 | 0.73mi |
| 1642 W Blue Flax Dr Saratoga Springs, UT | 4.0 | 2.5 | 1831 | $3,000 | $1.64 | 25d | 1 | 0.85mi |
| 241 W Ridge Rd Saratoga Springs, UT | 3.0 | 2.0 | 1196 | $1,650 | $1.38 | 4d | 1 | 1.05mi |
| 1823 N Crest Rd Saratoga Springs, UT | 3.0 | 2.0 | 1264 | $1,650 | $1.31 | 25d | 1 | 1.07mi |
| 157 W Springview Dr Unit 1 Saratoga Springs, UT | 3.0 | 2.0 | 1250 | $1,625 | $1.30 | 25d | 1 | 1.08mi |
| 2153 Springtime Dr Unit Bedroom 1 Master Saratoga Springs, UT | 3.0 | 2.0 | 1375 | $900 | $0.65 | 16d | 1 | 1.17mi |
| 414 W Peppergrass Way Saratoga Springs, UT | 2.0 | 1.0 | 980 | $1,700 | $1.73 | 16d | 1 | 1.18mi |
| 79 W Ridge Rd Saratoga Springs, UT | 3.0 | 2.0 | 1200 | $1,550 | $1.29 | 4d | 1 | 1.18mi |
| 753 Favreau Ln Unit U-301 Saratoga Springs, UT | 3.0 | 2.0 | 1389 | $1,895 | $1.36 | 4d | 1 | 1.49mi |
HOA detail condo
- Monthly dues
- $395 · $4,740/yr
- Assessments
- None detected in remarks — confirm with the listing agent.
Listing history 22 events
-
2026-06-17status $299,900 Under Contract 29 DOM
-
2026-06-16days on market $299,900 Active 29 DOM
-
2026-06-16price $299,900 Active 28 DOM
-
2026-06-15days on market $309,000 Active 28 DOM
-
2026-06-14days on market $309,000 Active 26 DOM
-
2026-06-13days on market $309,000 Active 25 DOM
-
2026-06-10days on market $309,000 Active 23 DOM
-
2026-06-09days on market $309,000 Active 22 DOM
-
2026-06-08days on market $309,000 Active 21 DOM
-
2026-06-07days on market $309,000 Active 20 DOM
-
2026-06-03days on market $309,000 Active 16 DOM
-
2026-06-03days on market $309,000 Active 15 DOM
-
2026-06-01days on market $309,000 Active 14 DOM
-
2026-05-31days on market $309,000 Active 13 DOM
-
2026-05-31days on market $309,000 Active 12 DOM
-
2026-05-19$309,000 Active
-
2026-05-18historical
-
2026-05-06price $310,000
-
2026-04-27price $320,000
-
2026-04-21price $325,000
-
2026-01-19$330,000 Active
-
2024-01-05soldstatus
ⓘ Source: listings_history table (triggers on properties + properties_extension) + one-shot
backfill from property_details.listing_events for pre-trigger history.
Tax reassessment forecast UT · Resets to sale price
- Current annual tax
- $1,403 · $117/mo
- Projected year-2 tax
- $1,979 · $165/mo
- Expected delta
- +$577/yr (+$48/mo · 41.1%)
ⓘ Screening estimate from a state-policy table — verify with the county assessor before closing.
Nearby sold comps map
Loading sold comps map…
Walkable amenities ~0.75 mi
Loading nearby amenities…
Taxation est. · year 1
- Rental income
- $26,258
- − Mortgage interest
- −$16,799
- − Property taxes
- −$1,403
- − Insurance
- −$1,500
- − Repairs & maintenance
- −$2,101
- − Management
- −$2,101
- − HOA
- −$4,740
- − Depreciation
- −$8,724
- Taxable loss
- −$11,109
- Est. tax savings @ 24.0%
- +$2,666
- After-tax cash flow
- $-3,105/yr
For passive investors: Depreciation is non-cash, so a rental often shows a tax loss while cash-flowing — sheltering income. Rental losses are passive: they offset passive income freely, and up to $25,000/yr can offset ordinary (W-2) income if you actively participate and your MAGI is under $100k (phasing out to $0 by $150k); unused losses carry forward. On sale, claimed depreciation is recaptured at up to 25%, and gains may owe capital-gains tax (a 1031 exchange can defer both). Figures are a year-1 estimate at your 24.0% rate — not tax advice; consult a CPA.
Schools (NCES district)
- District
- Alpine District
- NCES district ID
- 4900030
- Math proficiency
- 45% ▼ -4.00%
- Reading proficiency
- 50% ▼ -2.00%
- Median HH income
- $68,595
- Composite
- 42.48/100
- National rank
- #3213
- State rank
- #25 of 80 in UT
Livability — Saratoga Springs
- Score
- 70/100
- State rank
- #93
- US rank
- #7648
Category grades
Schools grade is shown separately in the Schools card above.
Census & demographics
- Census place
- Saratoga Springs, UT
- County
- Utah County · 661,754 people
- City population
- 45,429
- Metro
- Provo-Orem, UT
- Population (ZIP)
- 45,429
- Household income
- $130,331
- Rent vs Own
- Severe rent burden
- 476.0
Population outlook (Utah County) Hauer SSP2
- Today (2025)
- 693,420 people
- By 2030
- 757,324 · +9.2%
- By 2040
- 893,178 · +28.8%
- By 2050
- 1,035,842 · +49.4%
- By 2075
- 1,376,733 · +98.5%
- By 2100
- 1,609,388 · +132.1%
Race, ethnicity, and origin ACS 2023
- Neighborhood character
- Predominantly White (83%)
- Race & ethnicity
- White 83% Hispanic / Latino 12% Two or more races 9% Asian 1%
- Hispanic origin (detail)
- Mexican 6%
- Common ancestry
- Italian 7% Scottish 4% Slovak 4%
- Foreign-born
- 6% · Canada, Jamaica
- Languages at home
- 88% English-only · Spanish 9% Other Indo-European 1% Chinese 1%
Political lean MEDSL · Utah
- 2024 margin
- Solid R (+39.8) · D 28.5% · R 68.3% · Other 3.2%
- 2008→2024 swing
- +19.1pp toward D · 2008: -58.9pp · 2024: -39.8pp
- All cycles
- 2024: R+39.8 2020: R+41.0 2016: R+37.3 2012: R+78.5 2008: R+58.9
Not yet ingested
- Civics
- —
Market trends
- HPI YoY
- ▲ 11.09%
- Current HPI
- 298.0545
- Rent YoY
- ▲ 0.68%
- Metro
- Provo-Orem, UT
- State GDP YoY
- ▲ 3.54%
- F500 in state
- 2
Industry mix (Fortune 500 HQ in UT)
| Industry | F500 HQs | Revenue |
|---|---|---|
| Financial Services | 1 | $3B |
|
||
Price history
-6.4% since first listed7 events — show timeline
- 2026-05-19 Listed $309,000 WFRMLS
- 2026-05-18 Listing Removed — WFRMLS
- 2026-05-06 Price Changed $310,000 WFRMLS
- 2026-04-27 Price Changed $320,000 WFRMLS
- 2026-04-21 Price Changed $325,000 WFRMLS
- 2026-01-19 Listed $330,000 WFRMLS
- 2024-01-05 Sold (Public Records) — Public Records
Property tax history
+66.1%/yrLatest (2025): $1,403 · -0.6% YoY. Source: county tax records.
Cash-flow waterfall
monthlySold comps — $/sqft
last 12 mo · ≤1 miLoading sold comps…