 Duplex
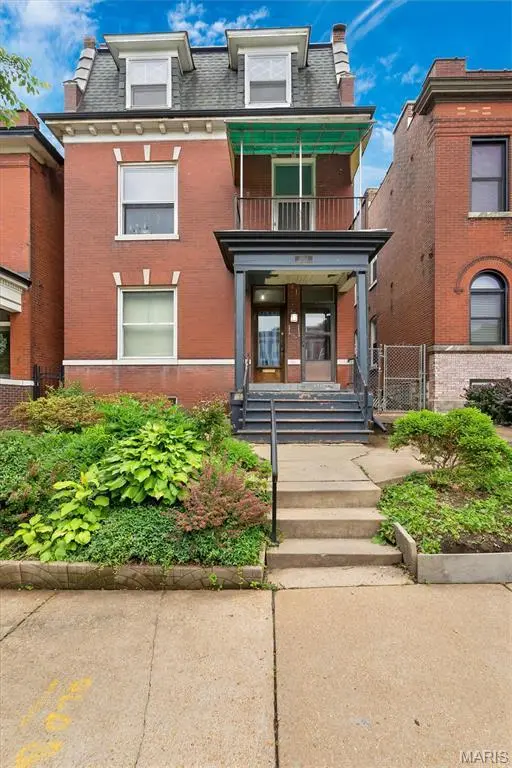
3512 Mckean Ave · St. Louis, MO
Flood risk 1/10 · Minimal
- FEMA flood zone
- X (unshaded)
- Chance of flooding over 30 yrs
- 0.0%
- Est. flood insurance / yr
- $473 – $860
Fire risk 1/10 · Minimal
- Est. fire insurance / yr
- $1,054 – $1,958
Heat risk 5/10 · Moderate
- Hot days now (above 108°F)
- 7 days/yr
- Hot days in 30 yrs
- 21 days/yr
Wind risk 2/10 · Minimal
- Chance of severe wind over 30 yrs
- 1.0%
Air-quality risk 3/10 · Minor
- Unhealthy air days now
- 3 days/yr
- Unhealthy air days in 30 yrs
- 4 days/yr
Risk factors via First Street. Map © Google.
Why this score? — see what drove the C grade
The composite is a weighted blend of 9 inputs, each scored 0–100. Each bar is that input's sub-score; the figure is the points it added to the 100-point composite (weight × sub-score).
- Cash flow +24.4/30.0
- ARV discount +12.1/15.0
- DSCR +7.9/10.0
- 1% rule +5.1/10.0
- Rent growth +3.7/5.0
- Livability +2.5/5.0
- Condition / age +2.5/5.0
- Schools +1.2/10.0
- Appreciation +0.0/10.0
$240,000
🖨 Deal sheet (PDF) 📄 Offer letter ✓ Due diligence
Multi-family units
County records classify this as Multi-Family (2-4 Unit). Listing-text estimate: 2 units. confirmed
Listing remarks
Charming Tower Grove Heights two-family, being sold AS-IS. Special Sale Contract. 2 Nice big apartments with hardwood floors, lots of beautiful woodwork. The 2nd floor has a 3br townhouse, with the third bedroom on the 3rd floor. Fireplaces, built-in cabinets, ornate woodwork all intact and owner-occupied. It's a lovely building, forced air furnace with c/a, off-street parking, balcony, fenced yard. Across from Carpenter Library and walkable Utah Place
Key facts
- Fenced yard
- Ornate woodwork
- Built-in cabinets
Tags
Property features AI
Finance
- Other: Lot frontage approximately 30 feet
- Financial info: Above-grade finished area reported as 2,624 (public records); Seller may consider concessions; No current lease/sublease
Exterior
- Parking: Concrete parking; Detached parking; Off-street parking
- Security: Smoke detectors
- Utilities: Public water; Sewer connected; Electricity connected (Ameren); Natural gas connected
- Home design: Residential income property (2-4 units); Duplex; Private ownership; City lot, level; Faces city street
- Construction: Brick and stone construction; Stone foundation
- Exterior features: Covered porch; Porch; Chain-link fencing; Storm door(s)
Interior
- Kitchen: Eat-in kitchen; Pantry
- Bedrooms: Two 2-bedroom units
- Bathrooms: Each unit has 1 bathroom
- Heating & cooling: Forced air heating; Central air conditioning
- Interior features: Eat-in kitchen; High ceilings; Open floor plan; Pantry; Special millwork; Wood window frames; Decorative fireplaces (2)
- Laundry & utility: Laundry in basement
Neighborhood map
What this means for you Summary
Snapshot
- This is a 2 × 2-bed/1.0-bath units multifamily listed at $240k.
Deal economics
- At list price, monthly cash flow is $488 ($6k/yr) — positive. Per door: $244/mo.
- The deal already cash-flows at list — no discount required.
- Meets the 1% rule at list price ($2k rent vs $240k).
- Recommended offer: $236k (1.5% below list) — sets the bar for market timing.
- Cap rate 8.7% vs local median 5.0% in St. Louis — top-decile yield for the area; either an underpriced asset or a hidden risk that comps aren't pricing in. Stress-test before assuming the spread holds.
Location & tenants
- Location reads: area grade C — affects rentability + tenant quality, not the cash-flow math above.
- St. Louis City (urban): math 10% / reading 18% proficiency, ranked #312 of 324 in MO (top 96%) — low school quality limits family demand, transient renter base, plan for 1-2y turnover; 80% free/reduced lunch — lower-income household profile, screen leases tightly.
- Zoned schools: Froebel Elem. (math 8% / reading 8%, grade F, #1,052 of 1,115 statewide, top 95%, 176 students, 98% FRL); Gateway Middle (math 0% / reading 8%, grade F, #389 of 391 statewide, top 100%, 506 students, 99% FRL); Roosevelt High (math 2% / reading 8%, grade F, #517 of 521 statewide, top 100%, 460 students, 99% FRL) — zoned schools average 99% FRL vs 80% district-wide (18 pts higher); higher-poverty schools than district average — tighter screening recommended.
- Market conditions: Rents rising fast (+4.9%/yr); 242 active listings in the ZIP; 19 comparable units currently listed for rent nearby; rentals leasing fast (median 14d on market — plan ~1-2 weeks tenant-placement turnaround); 294 units permitted in St. Louis city in 2024 (227 in 5+ unit buildings).
- At $2,432/mo this rent would consume 51% of the median local household income ($58k/yr) (locally 1495% of renters already pay >50% of income on rent) — very limited rent-growth headroom before tenants either downsize or default.
Forward outlook
- Local home prices are declining (-3.0%/yr); year-one equity from $2k of loan paydown is wiped out by about $7k of value loss. Plan a longer hold.
- St. Louis County population projected to shrink 6% by 2050 — rents likely to lag national; underwrite the cash flow, not the appreciation.
- At projected returns (-3.0% appreciation + 4.9% rent growth), your $67k cash investment doubles in ~10 years — after that, you're playing with house money.
Negotiation context
- It's been on market 16 days — a 2% lower offer ($236k) is reasonable based on typical stale-listing flexibility.
- Current owner paid $94k; list at $240k implies a 155% gain — meaningful room to come down on a strong offer.
Risks & watch-outs
- Watch-outs: built in 1906 — expect roof / HVAC / electrical / plumbing capex.
- Climate carrying-cost: extreme-heat days projected 7→21/yr by 2055 (HVAC capex compounding) — expect insurance premiums to compound above CPI over the hold.
Questions for the listing agent
- Can we see the unit-by-unit rent roll, current vacancy, and any below-market leases? What's the average tenancy length?
- What capital expenditures (roof, boiler, parking lot, exteriors) have been made in the last 5 years, and what's planned in the next 2?
- Built in 1906 — when were the roof, HVAC, electrical panel, plumbing, and water heater last replaced?
- Is there a deadline driving the sale (1031 exchange, divorce, estate, relocation)? That informs how much negotiation room exists.
- What's the average days-on-market for RENTAL listings here right now (not sales)? A rising rental-DOM trend means longer vacancies and softer asking-rent achievability than the comps imply.
- What's the recent tenant-quality profile in this submarket — average credit score on applications, eviction rate, late-payment / NSF rate, and stable-employment percentage? A property-management company in the area should have these aggregated.
- How much new apartment / multifamily construction is in the pipeline within 1–3 miles? Heavy new supply (>2% of stock underway) typically softens rents 12–24 months out; light construction supports rent growth.
Investment metrics
- 1% rule
- 1.01% ✓
- Cap rate
- 8.73%
- Cash-on-cash
- 8.71%
- DSCR
- 1.39
- GRM
- 8.2
CMA / ARV
- ARV (on-the-fly)
- $267,648
- Comps found
- 12
Show comp detail 12 sales within ~0.75 mi
| Address | Dist | Beds/Ba | Sqft | Sold | Price | $/sf | Match |
|---|---|---|---|---|---|---|---|
| 3416 Utah St | 0.13mi | 4/2.0 | 2,700 (+3%) | 1mo | $150,000 | $56 | 88 |
| 3439 Utah St | 0.12mi | 5/2.0 (+1) | 2,642 (+1%) | 2mo | $359,000 | $136 | 87 |
| 3418 Hartford St | 0.39mi | 5/2.0 (+1) | 2,528 (-4%) | 6mo | $319,999 | $127 | 66 |
| 3161 Oregon Ave | 0.64mi | 4/— | 2,706 (+3%) | 2mo | $275,000 | $102 | 63 |
| 3521 Hartford St | 0.40mi | 3/2.0 (-1) | 2,448 (-7%) | 3mo | $264,900 | $108 | 62 |
| 3106 Chippewa St | 0.68mi | 4/2.0 | 2,490 (-5%) | 2mo | $109,900 | $44 | 58 |
| 3643 Winnebago St | 0.44mi | 4/2.0 | 2,250 (-14%) | 3mo | $120,000 | $53 | 54 |
| 3829 Minnesota Ave | 0.72mi | 4/2.0 | 2,798 (+7%) | 2mo | $65,000 | $23 | 53 |
| 3651 Winnebago St | 0.44mi | 4/2.0 | 2,250 (-14%) | 4mo | $200,000 | $89 | 52 |
| 3445 Iowa Ave | 0.72mi | 3/2.0 (-1) | 2,724 (+4%) | 4mo | $309,000 | $113 | 52 |
| 3921 Miami St | 0.61mi | 4/2.0 | 2,304 (-12%) | 0mo | $350,000 | $152 | 51 |
| 3142 S Compton Ave | 0.46mi | 3/2.0 (-1) | 2,244 (-14%) | 6mo | $157,500 | $70 | 44 |
Match score weights: distance 35% · size 25% · config 20% · recency 20%. Top-matched comps best support the ARV.
Projected returns pro-forma
-3.0% appreciation · 4.89% rent growth · sell at horizon
- IRR
- -1.2%
- Equity multiple
- 0.95×
- Total profit
- $-3,211
- Equity at exit
- $35,785
- IRR
- 10.1%
- Equity multiple
- 1.85×
- Total profit
- $56,894
- Equity at exit
- $20,751
Cash invested: $67,200 (down + closing). Projections, not guarantees.
Landlord ↔ Tenant lean methodology
- Overall (STATE)
- 81 Strongly Landlord-Friendly
- State Missouri
- 81 Strongly Landlord-Friendly · R+10
- County
- — inherits STATE
- City
- — inherits STATE
ZIP-level market 63118
- Rents YoY
- 4.9%
- Active inventory
- 242
- Price-to-rent
- 16.4×
Monthly cashflow live
- Estimated rent
- $2,432 high interval (Pro) →
- Mortgage (P&I)
- −$1,259
- Tax from tax record
- −$75 /mo · $899/yr
- Insurance
- −$100
- HOA
- −$0
- Vacancy / Maint / Mgmt
- −$511
- Net cashflow
- $488
Break-even live
Sensitivity live
| Price | -10% $624 | -5% $556 | +0% $488 | +5% $420 | +10% $352 |
|---|---|---|---|---|---|
| Rent | -10% $296 | -5% $392 | +0% $488 | +5% $584 | +10% $680 |
| Rate | -1.0pp $609 | -0.5pp $549 | base $488 | +0.5pp $426 | +1.0pp $362 |
2-unit breakdown (identical units grouped — click to expand)
| Units | Beds | Baths | Est. rent |
|---|---|---|---|
| 2× units | 2 | 1 | $2,432 |
| #1 | 2 | 1 | $1,216 |
| #2 | 2 | 1 | $1,216 |
| Total (2 units) | $2,432 | ||
UW: 25.0% down · 7.5% · 30yr · 1.5% tax · 5.0% vac · 8.0% maint · 8.0% mgmt
Financing live
Cash to close
- Down payment
- $60,000
- Closing costs
- $7,200
- Reserves months
- —
- Total cash needed
- —
Loan-product check · same deal, 3 products live
Conventional
25% down · 7.5% · 30yr
- Down + closing
- —
- Monthly P&I
- —
- Monthly cashflow
- —
- DSCR
- —
- Eligible?
- —
Personal DTI + credit; lowest rate.
DSCR
20% down · 8.5% · 30yr
- Down + closing
- —
- Monthly P&I
- —
- Monthly cashflow
- —
- DSCR
- —
- Eligible?
- —
No personal income docs; deal must DSCR.
Hard money
10% down · 12.0% · 12mo
- Down + closing
- —
- Monthly P&I
- —
- Monthly cashflow
- —
- DSCR
- —
- Eligible?
- —
Short-term bridge; refi at stabilization.
Rent comps 19 comps
| Address | Beds | Baths | Sqft | Rent | $/sqft | DOM | Units | Dist |
|---|---|---|---|---|---|---|---|---|
| 3458 Giles Ave Saint Louis, MO | 3.0 | 2.5 | 2204 | $2,400 | $1.09 | 9d | 1 | 0.22mi |
| 3526 S Spring Ave Saint Louis, MO | 4.0 | 2.0 | 2244 | $2,877 | $1.28 | 45d | 1 | 0.34mi |
| 3807 Potomac St Saint Louis, MO | 3.0 | 1.0 | 2588 | $1,100 | $0.43 | 45d | 1 | 0.39mi |
| 3807 Potomac St Saint Louis, MO | 3.0 | 1.0 | 2588 | $1,300 | $0.50 | 9d | 1 | 0.39mi |
| 3540 Michigan Ave Saint Louis, MO | 4.0 | 2.0 | 1758 | $1,800 | $1.02 | 3d | 1 | 0.44mi |
| 3908 McDonald Ave Saint Louis, MO | 3.0 | 2.0 | 1927 | $2,500 | $1.30 | 6d | 1 | 0.49mi |
| 3510 California Ave Saint Louis, MO | 3.0 | 2.0 | 1800 | $1,200 | $0.67 | 45d | 1 | 0.70mi |
| 3429 Ohio Ave Saint Louis, MO | 3.0 | 3.0 | 1938 | $2,250 | $1.16 | 17d | 1 | 0.78mi |
| 2643 Wyoming St Saint Louis, MO | 3.0 | 2.5 | 2592 | $2,600 | $1.00 | 45d | 1 | 0.84mi |
| 4145-4147 Hartford St St. Louis, MO | 4.0 | 3.5 | 2400 | $3,800 | $1.58 | 13d | 1 | 0.96mi |
| 2648 California Ave Saint Louis, MO | 4.0 | 2.0 | 2458 | $2,000 | $0.81 | 25d | 1 | 1.00mi |
| 4222 S 38th St St. Louis, MO | 3.0 | 2.0 | 1836 | $1,400 | $0.76 | 0d | 1 | 1.02mi |
| 4222 S 38th St Unit 4222 St. Louis, MO | 3.0 | 2.0 | 1836 | $1,400 | $0.76 | 21d | 1 | 1.02mi |
| 4135 S Compton Ave Saint Louis, MO | 3.0 | 2.0 | 2104 | $1,600 | $0.76 | 45d | 1 | 1.03mi |
| 2811 Missouri Ave Saint Louis, MO | 4.0 | 2.5 | 2673 | $3,622 | $1.36 | 45d | 1 | 1.19mi |
| 3450 Wisconsin Ave Saint Louis, MO | 1.0–3.0 | 1.0–2.0 | 1219 | $2,300 | $1.89 | 0d | 15 | 1.19mi |
| 4211 Cleveland Ave Saint Louis, MO | 3.0 | 2.5 | 2056 | $2,475 | $1.20 | 0d | 1 | 1.30mi |
| 4312 Oregon Ave Saint Louis, MO | 4.0 | 2.0 | 2032 | $2,000 | $0.98 | 0d | 1 | 1.35mi |
| 2253 Indiana Ave Saint Louis, MO | 4.0 | 3.5 | 1760 | $2,600 | $1.48 | 9d | 1 | 1.40mi |
Listing history 9 events
-
2026-06-07statusdays on market $240,000 Pending 16 DOM
-
2026-06-05days on market $240,000 Active 15 DOM
-
2026-06-03days on market $240,000 Active 14 DOM
-
2026-06-02days on market $240,000 Active 13 DOM
-
2026-06-01days on market $240,000 Active 12 DOM
-
2026-05-31days on market $240,000 Active 11 DOM
-
2026-05-20$257,000 Active
-
2002-10-09soldstatus $94,000
-
1994-03-10soldstatus
ⓘ Source: listings_history table (triggers on properties + properties_extension) + one-shot
backfill from property_details.listing_events for pre-trigger history.
Tax reassessment forecast MO · Resets to sale price
- Current annual tax
- $899 · $75/mo
- Projected year-2 tax
- $2,328 · $194/mo
- Expected delta
- +$1,429/yr (+$119/mo · 159.1%)
ⓘ Screening estimate from a state-policy table — verify with the county assessor before closing.
Climate risk First Street
- Flood 1/10 Low FEMA zone X (unshaded) · 0% chance over 30 yrs
- Wildfire 1/10 Low
- Heat 5/10 Major 7 d/yr ≥108°F today · 21 d/yr by 30 yrs out
- Wind 2/10 Low 100% chance of damaging wind over 30 yrs
- Air quality 3/10 Moderate 3 unhealthy d/yr today · 4 by 30 yrs out
Nearby sold comps map
Loading sold comps map…
Walkable amenities ~0.75 mi
Loading nearby amenities…
Taxation est. · year 1
- Rental income
- $29,184
- − Mortgage interest
- −$13,444
- − Property taxes
- −$899
- − Insurance
- −$1,200
- − Repairs & maintenance
- −$2,335
- − Management
- −$2,335
- − Depreciation
- −$6,982
- Taxable income
- $1,990
- Est. tax owed @ 24.0%
- −$478
- After-tax cash flow
- $5,376/yr
For passive investors: Depreciation is non-cash, so a rental often shows a tax loss while cash-flowing — sheltering income. Rental losses are passive: they offset passive income freely, and up to $25,000/yr can offset ordinary (W-2) income if you actively participate and your MAGI is under $100k (phasing out to $0 by $150k); unused losses carry forward. On sale, claimed depreciation is recaptured at up to 25%, and gains may owe capital-gains tax (a 1031 exchange can defer both). Figures are a year-1 estimate at your 24.0% rate — not tax advice; consult a CPA.
Schools (NCES district)
- District
- St. Louis City
- NCES district ID
- 2929280
- Math proficiency
- 10% ▼ -6.00%
- Reading proficiency
- 18% ▼ -3.00%
- Median HH income
- $35,685
- Composite
- 11.54/100
- National rank
- #9699
- State rank
- #312 of 324 in MO
Livability — St. Louis
No livability data for this city. (Only ~50 U.S. cities are tracked.)
Census & demographics
- Census place
- St. Louis, MO
- County
- Saint Louis City · 254,015 people
- City population
- 283,259
- Metro
- St. Louis, MO-IL
- Population (ZIP)
- 25,913
- Household income
- $57,762
- Rent vs Own
- Severe rent burden
- 1495.0
Population outlook (St. Louis County) Hauer SSP2
- Today (2025)
- 315,737 people
- By 2030
- 313,865 · -0.6%
- By 2040
- 305,439 · -3.3%
- By 2050
- 296,529 · -6.1%
- By 2075
- 271,028 · -14.2%
- By 2100
- 255,359 · -19.1%
Race, ethnicity, and origin ACS 2023
- Neighborhood character
- Diverse neighborhood (Simpson 0.63)
- Race & ethnicity
- White 44% Black 41% Two or more races 8% Hispanic / Latino 8% Asian 2%
- Hispanic origin (detail)
- Mexican 6%
- Common ancestry
- Slovak 2% Lithuanian 2% Romanian 2%
- Foreign-born
- 6% · Canada, Vietnam
- Languages at home
- 90% English-only · Spanish 5% Vietnamese 1% French/Haitian/Cajun 1%
Political lean MEDSL · St. Louis
- 2024 margin
- Solid D (+64.7) · D 81.4% · R 16.7% · Other 2.0%
- 2008→2024 swing
- -3.5pp toward R · 2008: 68.2pp · 2024: 64.7pp
- All cycles
- 2024: D+64.7 2020: D+66.2 2016: D+63.7 2012: D+66.6 2008: D+68.2
Not yet ingested
- Civics
- —
Market trends
- HPI YoY
- ▼ -347.51%
- Current HPI
- 171.5963
- Rent YoY
- ▲ 4.89%
- Metro
- St. Louis, MO-IL
- State GDP YoY
- ▲ 1.84%
- F500 in state
- 20
Industry mix (Fortune 500 HQ in MO)
| Industry | F500 HQs | Revenue |
|---|---|---|
| Healthcare | 1 | $163B |
|
||
| Insurance | 1 | $21B |
|
||
| Industrial Technology | 1 | $17B |
|
||
| Retail | 1 | $16B |
|
||
| Industrial Distribution | 1 | $10B |
|
||
| Utilities | 1 | $9B |
|
||
Price history
+173.4% since first listed3 events — show timeline
- 2026-05-20 Listed $257,000 MARIS as Distributed by MLS Grid
- 2002-10-09 Sold (Public Records) $94,000 Public Records
- 1994-03-10 Sold (Public Records) — Public Records
Property tax history
+5.0%/yrLatest (2024): $899 · +5.0% YoY. Source: county tax records.
Cash-flow waterfall
monthlySold comps — $/sqft
last 12 mo · ≤1 miLoading sold comps…