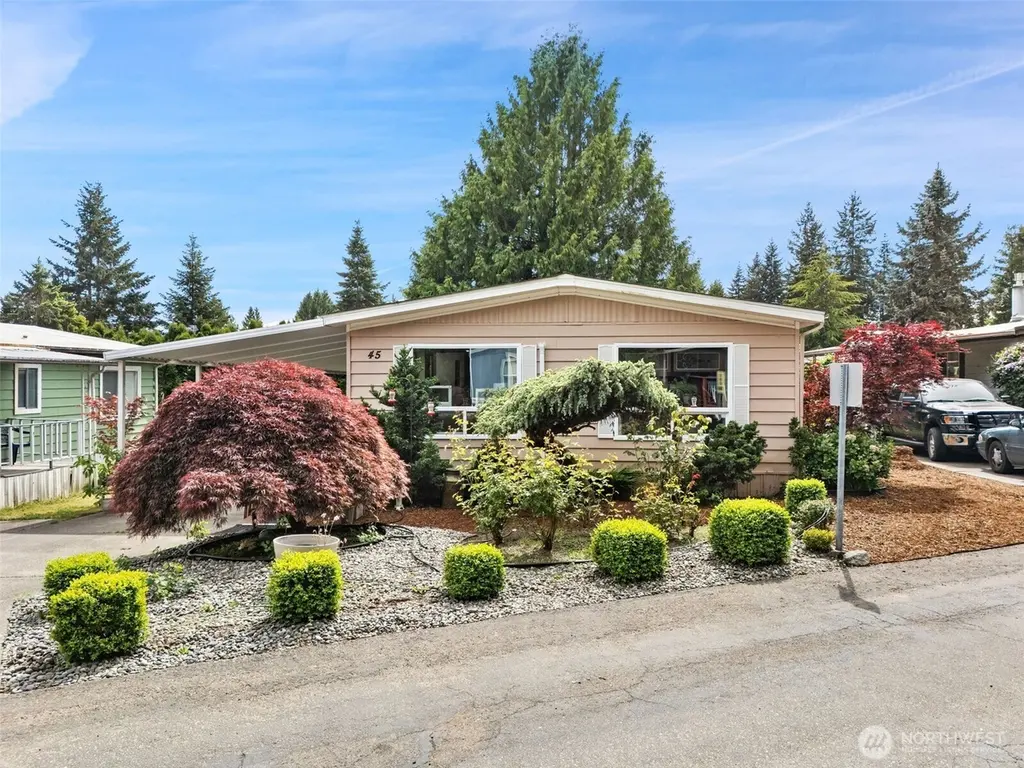
16300 State Highway 305 NE #45 · Suquamish, WA
Flood risk 1/10 · Minimal
- FEMA flood zone
- X (unshaded)
- Chance of flooding over 30 yrs
- 0.0%
- Est. flood insurance / yr
- $507 – $1,088
Fire risk 3/10 · Minor
- Est. fire insurance / yr
- $604 – $1,122
Heat risk 3/10 · Minor
- Hot days now (above 86°F)
- 7 days/yr
- Hot days in 30 yrs
- 15 days/yr
Wind risk 1/10 · Minimal
- Chance of severe wind over 30 yrs
- —
Air-quality risk 6/10 · Moderate
- Unhealthy air days now
- 9 days/yr
- Unhealthy air days in 30 yrs
- 9 days/yr
Risk factors via First Street. Map © Google.
Why this score? — see what drove the B- grade
The composite is a weighted blend of 9 inputs, each scored 0–100. Each bar is that input's sub-score; the figure is the points it added to the 100-point composite (weight × sub-score).
- Cash flow +30.0/30.0
- 1% rule +10.0/10.0
- DSCR +10.0/10.0
- Schools +5.4/10.0
- Condition / age +3.8/5.0
- Livability +3.5/5.0
- Rent growth +2.7/5.0
- ARV discount +2.3/15.0
- Appreciation +0.0/10.0
$139,400
🖨 Deal sheet (PDF) 📄 Offer letter ✓ Due diligence
Listing remarks
Welcome to easy living in the beautifully maintained 55+ Cedar Glen Manufactured Home Park! This spacious & well-cared-for 2-bedroom, 2-bath home offers 1,260 square feet of comfortable living space with a functional, light-filled layout. Inside, you’ll find generous living areas including a living room, family room, dining area, & additional eating space off the kitchen. The private primary suite features its own ensuite bath and large walk in closet. Thoughtful updates throughout include double-pane windows, new plumbing and a ductless mini-split system providing efficient heating and cooling year-round. Outside, enjoy beautifully manicured grounds with just the right amo
Key facts
- New plumbing
- Ensuite bath
- Large walk in closet
Tags
Property features AI
Finance
- Other: Storage: 1
- Financial info: Land lease: $1,029; Listing terms: Cash or Conventional
- HOA & community: Located in Cedar Glen mobile home park (97 homes); Park amenities: Clubhouse, common area, laundry, RV parking; Park approved for sale; Senior community
Exterior
- Parking: Carport
- Utilities: Electric energy; Public water (park provided); Park-provided sewer; Puget Sound Energy service; Electric water heater located in master closet; Cable: Xfinity; Internet: Xfinity
- Home design: Manufactured home (double wide); One level; Entry level: One; Good condition; Make: Kentwood; Mobile home remains in place
- Construction: Metal/vinyl construction materials; Composition roof; Metal skirt; Tie down foundation; Manufactured after 6/15/1976
- Exterior features: Metal/vinyl exterior; Paved lot; Landscaped; Patio/porch/deck
Interior
- Kitchen: Dishwasher; Refrigerator; Stove/Range
- Bedrooms: 2 bedrooms
- Flooring: Laminate; Carpet
- Bathrooms: 2 full bathrooms; 2 bathtubs; 2 showers
- Heating & cooling: Ductless heating; Forced air heating; Cooling present
- Interior features: Water heater; Ceiling fan(s); Double pane windows; Walk-in closet; Bath off primary; Patio/porch/deck
- Laundry & utility: Washer; Dryer; Utility room
Neighborhood map
What this means for you Summary
Snapshot
- This is a 2-bed/2.0-bath manufactured listed at $139k. Condition is rated good.
Deal economics
- At list price, monthly cash flow is $1k ($12k/yr) — positive.
- The deal already cash-flows at list — no discount required.
- Meets the 1% rule at list price ($2k rent vs $139k).
- Recommended offer: $135k (3.0% below list) — sets the bar for market timing.
Location & tenants
- Location reads 69/100 on livability (#262 in WA) — a middle-class / working-renter tenant base. Strengths: housing A+, employment A-, crime B+; Watch: cost of living C-, amenities F, commute F.
- North Kitsap School District (suburban): math 53% / reading 65% proficiency, ranked #54 of 291 in WA (top 19%) — acceptable for families but not a draw, mixed tenant base, ~2y average lease.
- Zoned schools: Suquamish Elementary School (328 students, 52% FRL); Kingston Middle School (491 students, 49% FRL); Kingston High School (610 students, 42% FRL) — zoned schools average 48% FRL vs 26% district-wide (22 pts higher); higher-poverty schools than district average — tighter screening recommended.
- Market conditions: Rents flat; 265 active listings in the ZIP; 1 comparable units currently listed for rent nearby; high-income renter base; 1,294 units permitted in Kitsap County in 2024 (302 in 5+ unit buildings).
Forward outlook
- Local home prices are declining (-3.0%/yr); year-one equity from $964 of loan paydown is wiped out by about $4k of value loss. Plan a longer hold.
- Kitsap County population projected at +8% by 2050 — modest demand growth; plan on rents tracking national, not racing it.
- At projected returns (-3.0% appreciation + 0.7% rent growth), your $39k cash investment doubles in ~5 years — after that, you're playing with house money.
Negotiation context
- It's been on market 38 days — a 3% lower offer ($135k) is reasonable based on typical stale-listing flexibility.
Questions for the listing agent
- It's been on market 38 days. Have you received any prior offers? Is the seller open to a 3% concession, seller financing, or rate buy-down credit?
- Is there a deadline driving the sale (1031 exchange, divorce, estate, relocation)? That informs how much negotiation room exists.
- Schools are B-rated — typically a magnet for longer-tenancy family renters. What's the average tenant stay here, and is there a school-zone premium baked into asking?
- What's the average days-on-market for RENTAL listings here right now (not sales)? A rising rental-DOM trend means longer vacancies and softer asking-rent achievability than the comps imply.
- What's the recent tenant-quality profile in this submarket — average credit score on applications, eviction rate, late-payment / NSF rate, and stable-employment percentage? A property-management company in the area should have these aggregated.
- How much new for-sale + rental construction is in the pipeline within 1–3 miles? Heavy new supply typically softens prices + rents 12–24 months out; constrained supply supports both.
Investment metrics
- 1% rule
- 1.78% ✓
- Cap rate
- 14.90%
- Cash-on-cash
- 30.75%
- DSCR
- 2.37
- GRM
- 4.7
CMA / ARV
- ARV (median comp)
- $124,967
- List price
- $139,400
- Delta
- 11.55%
- Verdict
- OVERPRICED
- Comps
- 7 within 1.0 mi
Show comp detail 11 sales within ~0.75 mi
| Address | Dist | Beds/Ba | Sqft | Sold | Price | $/sf | Match |
|---|---|---|---|---|---|---|---|
| 16300 NE State Hwy 305 #18 | 0.00mi | 2/2.0 | 1,260 (0%) | 10mo | $185,000 | $147 | 91 |
| 16300 NE State Highway 305 #71 | 0.00mi | 2/2.0 | 1,276 (+1%) | 12mo | $142,500 | $112 | 88 |
| 16300 State Hwy 305 NE #75 | 0.00mi | 2/2.0 | 1,344 (+7%) | 5mo | $40,000 | $30 | 84 |
| 16300 NE State Highway 305 #10 | 0.00mi | 2/2.0 | 1,368 (+9%) | 2mo | $170,000 | $124 | 84 |
| 16300 State Route 305 NE #78 | 0.08mi | 2/2.0 | 1,240 (-2%) | 12mo | $79,900 | $64 | 84 |
| 16300 State Hwy 305 NE #80 | 0.00mi | 2/2.0 | 1,344 (+7%) | 11mo | $125,000 | $93 | 79 |
| 16300 State Highway 305 #82 | 0.00mi | 2/2.0 | 1,288 (+2%) | 20mo | $95,000 | $74 | 79 |
| 16300 State Highway 305 NE #22 | 0.07mi | 3/2.0 (+1) | 1,344 (+7%) | 3mo | $75,000 | $56 | 78 |
| 16300 NE State Highway 305 #92 | 0.00mi | 2/2.0 | 1,086 (-14%) | 2mo | $127,000 | $117 | 75 |
| 16300 State Highway 305 NE #11 | 0.00mi | 2/1.0 | 1,234 (-2%) | 23mo | $42,000 | $34 | 73 |
| 16300 NE State Highway 305 #52 | 0.00mi | 2/2.0 | 1,400 (+11%) | 21mo | $189,000 | $135 | 63 |
Match score weights: distance 35% · size 25% · config 20% · recency 20%. Top-matched comps best support the ARV.
Projected returns pro-forma
-3.0% appreciation · 0.71% rent growth · sell at horizon
- IRR
- 22.9%
- Equity multiple
- 1.91×
- Total profit
- $35,547
- Equity at exit
- $20,785
- IRR
- 29.3%
- Equity multiple
- 3.34×
- Total profit
- $91,183
- Equity at exit
- $12,053
Cash invested: $39,032 (down + closing). Projections, not guarantees.
Landlord ↔ Tenant lean methodology
- Overall (STATE)
- 28 Tenant-Leaning
- State Washington
- 28 Tenant-Leaning · D+8
- County
- — inherits STATE
- City
- — inherits STATE
ZIP-level market 98370
- Rents YoY
- 0.7%
- Active inventory
- 265
- Price-to-rent
- 4.7×
Monthly cashflow live
- Estimated rent
- $2,485 medium interval (Pro) →
- Mortgage (P&I)
- −$731
- Tax est. 1.5%
- −$174 /mo · $2,091/yr
- Insurance
- −$58
- HOA
- −$0
- Vacancy / Maint / Mgmt
- −$522
- Net cashflow
- $1,000
Break-even live
Sensitivity live
| Price | -10% $1,096 | -5% $1,048 | +0% $1,000 | +5% $952 | +10% $904 |
|---|---|---|---|---|---|
| Rent | -10% $804 | -5% $902 | +0% $1,000 | +5% $1,098 | +10% $1,196 |
| Rate | -1.0pp $1,070 | -0.5pp $1,036 | base $1,000 | +0.5pp $964 | +1.0pp $927 |
UW: 25.0% down · 7.5% · 30yr · 1.5% tax · 5.0% vac · 8.0% maint · 8.0% mgmt
Financing live
Cash to close
- Down payment
- $34,850
- Closing costs
- $4,182
- Reserves months
- —
- Total cash needed
- —
Loan-product check · same deal, 3 products live
Conventional
25% down · 7.5% · 30yr
- Down + closing
- —
- Monthly P&I
- —
- Monthly cashflow
- —
- DSCR
- —
- Eligible?
- —
Personal DTI + credit; lowest rate.
DSCR
20% down · 8.5% · 30yr
- Down + closing
- —
- Monthly P&I
- —
- Monthly cashflow
- —
- DSCR
- —
- Eligible?
- —
No personal income docs; deal must DSCR.
Hard money
10% down · 12.0% · 12mo
- Down + closing
- —
- Monthly P&I
- —
- Monthly cashflow
- —
- DSCR
- —
- Eligible?
- —
Short-term bridge; refi at stabilization.
Rent comps 1 comps
| Address | Beds | Baths | Sqft | Rent | $/sqft | DOM | Units | Dist |
|---|---|---|---|---|---|---|---|---|
| 4005 NE Kedros Dr Poulsbo, WA | 3.0 | 2.0 | 1200 | $2,850 | $2.38 | 15d | 1 | 1.40mi |
Listing history 15 events
-
2026-06-18days on market $139,400 Active 38 DOM
-
2026-06-17days on market $139,400 Active 37 DOM
-
2026-06-16days on market $139,400 Active 36 DOM
-
2026-06-15days on market $139,400 Active 35 DOM
-
2026-06-14days on market $139,400 Active 33 DOM
-
2026-06-13days on market $139,400 Active 32 DOM
-
2026-06-10days on market $139,400 Active 30 DOM
-
2026-06-09days on market $139,400 Active 29 DOM
-
2026-06-08days on market $139,400 Active 28 DOM
-
2026-06-07days on market $139,400 Active 27 DOM
-
2026-06-02days on market $139,400 Active 22 DOM
-
2026-06-01days on market $139,400 Active 21 DOM
-
2026-05-31days on market $139,400 Active 20 DOM
-
2026-05-30days on market $139,400 Active 19 DOM
-
2026-05-11$139,400 Active
ⓘ Source: listings_history table (triggers on properties + properties_extension) + one-shot
backfill from property_details.listing_events for pre-trigger history.
Climate risk First Street
- Flood 1/10 Low FEMA zone X (unshaded) · 0% chance over 30 yrs
- Wildfire 3/10 Moderate
- Heat 3/10 Moderate 7 d/yr ≥86°F today · 15 d/yr by 30 yrs out
- Wind 1/10 Low
- Air quality 6/10 Major 9 unhealthy d/yr today · 9 by 30 yrs out
Nearby sold comps map
Loading sold comps map…
Walkable amenities ~0.75 mi
Loading nearby amenities…
Taxation est. · year 1
- Rental income
- $29,825
- − Mortgage interest
- −$7,809
- − Property taxes
- −$2,091
- − Insurance
- −$697
- − Repairs & maintenance
- −$2,386
- − Management
- −$2,386
- − Depreciation
- −$4,055
- Taxable income
- $10,401
- Est. tax owed @ 24.0%
- −$2,496
- After-tax cash flow
- $9,505/yr
For passive investors: Depreciation is non-cash, so a rental often shows a tax loss while cash-flowing — sheltering income. Rental losses are passive: they offset passive income freely, and up to $25,000/yr can offset ordinary (W-2) income if you actively participate and your MAGI is under $100k (phasing out to $0 by $150k); unused losses carry forward. On sale, claimed depreciation is recaptured at up to 25%, and gains may owe capital-gains tax (a 1031 exchange can defer both). Figures are a year-1 estimate at your 24.0% rate — not tax advice; consult a CPA.
Condition & rehab AI · 21 photos
This well-maintained 2-bedroom, 2-bath manufactured home in a 55+ community offers a good condition with minor repairs needed. Upgrades to paint, cabinets, and landscaping would significantly enhance its value.
Repairs flagged
- Minor kitchen cabinets — Worn appearance
- Minor bathroom fixtures — Need cleaning
Value-add opportunities
- Both Paint interior walls — Fresh paint enhances curb appeal and interior aesthetics
- Both Replace kitchen cabinets — New cabinets improve functionality and aesthetics
- Both Replace bathroom fixtures — New fixtures improve functionality and aesthetics
- Both Landscaping refresh — Fresh landscaping enhances curb appeal and property value
Renovation cost estimate screening
| Repair item | Severity | Est. cost |
|---|---|---|
| kitchen cabinets · Worn appearance | Minor | $500–3,000 |
| bathroom fixtures · Need cleaning | Minor | $500–3,000 |
| Total estimated repair cost · 2 items | $1,000–6,000 |
Value-add ROI direction
- Both Paint interior walls — Fresh paint enhances curb appeal and interior aesthetics ↑
- Both Replace kitchen cabinets — New cabinets improve functionality and aesthetics ↑
- Both Replace bathroom fixtures — New fixtures improve functionality and aesthetics ↑
- Both Landscaping refresh — Fresh landscaping enhances curb appeal and property value ↑
ⓘ Cost ranges are severity-bucket heuristics (US national rule-of-thumb). Get contractor quotes + a written scope before underwriting a rehab budget.
Schools (NCES district)
- District
- North Kitsap School District
- NCES district ID
- 5305760
- Math proficiency
- 53% ▼ -1.00%
- Reading proficiency
- 65% ▲ 1.00%
- Median HH income
- $68,919
- Composite
- 53.68/100
- National rank
- #3092
- State rank
- #54 of 291 in WA
Livability — Suquamish
- Score
- 69/100
- State rank
- #262
- US rank
- #9023
Category grades
Schools grade is shown separately in the Schools card above.
Census & demographics
- Census place
- Suquamish, WA
- County
- Kitsap County · 243,099 people
- City population
- 3,412
- Metro
- Bremerton-Silverdale-Port Orchard, WA
- Population (ZIP)
- 33,655
- Household income
- $116,756
- Rent vs Own
- Severe rent burden
- 904.0
Population outlook (Kitsap County) Hauer SSP2
- Today (2025)
- 277,525 people
- By 2030
- 285,040 · +2.7%
- By 2040
- 294,957 · +6.3%
- By 2050
- 300,622 · +8.3%
- By 2075
- 315,580 · +13.7%
- By 2100
- 304,340 · +9.7%
Race, ethnicity, and origin ACS 2023
- Neighborhood character
- Predominantly White (79%)
- Race & ethnicity
- White 79% Two or more races 11% Hispanic / Latino 9% Asian 3% Black 1%
- Hispanic origin (detail)
- Mexican 5%
- Common ancestry
- Portuguese 7% Italian 4% Slovak 3%
- Foreign-born
- 6% · Canada, South Korea
- Languages at home
- 93% English-only · Spanish 4% Other Indo-European 1% Other Asian/Pacific 1%
Political lean MEDSL · Kitsap
- 2024 margin
- Strong D (+20.9) · D 58.8% · R 37.9% · Other 3.3%
- 2008→2024 swing
- +8.6pp toward D · 2008: 12.3pp · 2024: 20.9pp
- All cycles
- 2024: D+20.9 2020: D+18.1 2016: D+11.6 2012: D+11.1 2008: D+12.3
Not yet ingested
- Civics
- —
Market trends
- HPI YoY
- ▼ -342.47%
- Current HPI
- 347.3427
- Rent YoY
- ▲ 0.71%
- Metro
- Bremerton-Silverdale-Port Orchard, WA
- State GDP YoY
- ▲ 4.65%
- F500 in state
- 22
Industry mix (Fortune 500 HQ in WA)
| Industry | F500 HQs | Revenue |
|---|---|---|
| Retail | 2 | $269B |
|
||
| Technology / Retail | 1 | $638B |
|
||
| Technology | 1 | $245B |
|
||
| Telecommunications | 1 | $38B |
|
||
| Food / Beverage | 1 | $36B |
|
||
| Automotive / Trucks | 1 | $34B |
|
||
Price history
1 event — show timeline
- 2026-05-11 Listed $139,400 NWMLS as Distributed by MLS Grid
Cash-flow waterfall
monthlySold comps — $/sqft
last 12 mo · ≤1 miLoading sold comps…