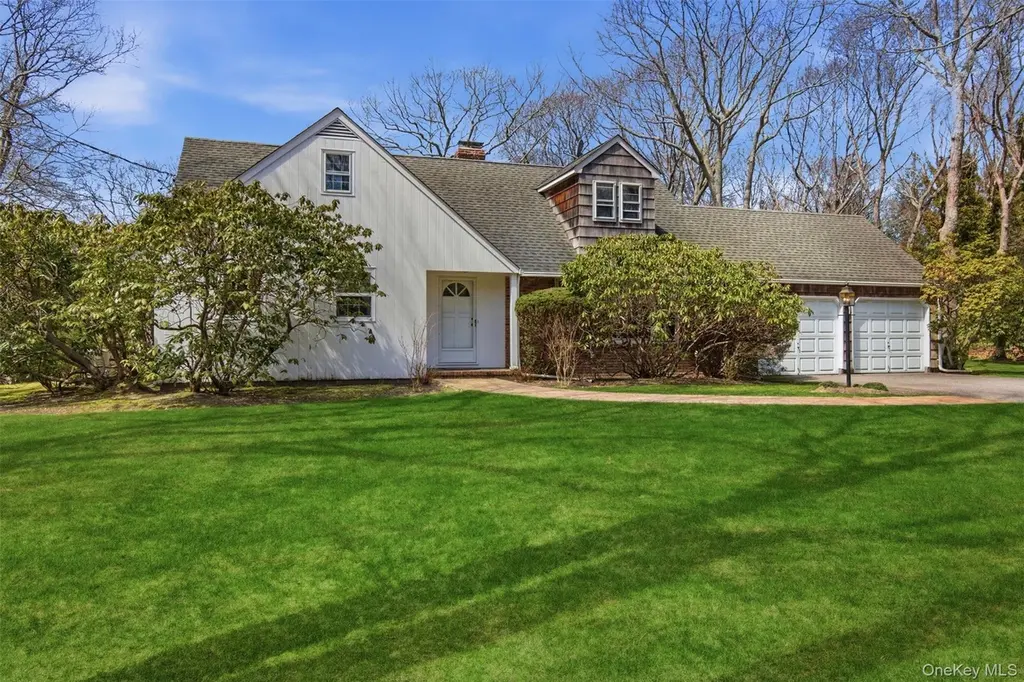
6 Oakland Ln · East Quogue, NY
Flood risk 1/10 · Minimal
- FEMA flood zone
- X (unshaded)
- Chance of flooding over 30 yrs
- 0.0%
- Est. flood insurance / yr
- $473 – $860
Fire risk 1/10 · Minimal
- Est. fire insurance / yr
- $691 – $1,283
Heat risk 4/10 · Minor
- Hot days now (above 90°F)
- 7 days/yr
- Hot days in 30 yrs
- 19 days/yr
Wind risk 8/10 · Major
- Chance of severe wind over 30 yrs
- 80.0%
Air-quality risk 2/10 · Minimal
- Unhealthy air days now
- 2 days/yr
- Unhealthy air days in 30 yrs
- 2 days/yr
Risk factors via First Street. Map © Google.
Why this score? — see what drove the C grade
The composite is a weighted blend of 9 inputs, each scored 0–100. Each bar is that input's sub-score; the figure is the points it added to the 100-point composite (weight × sub-score).
- Cash flow +27.0/30.0
- DSCR +9.4/10.0
- 1% rule +6.5/10.0
- Schools +5.0/10.0
- Livability +3.1/5.0
- Rent growth +2.5/5.0
- Condition / age +2.5/5.0
- ARV discount +0.0/15.0
- Appreciation +0.0/10.0
$1,399,000
🖨 Deal sheet 📄 Offer letter ✓ Due diligence
Listing remarks MLS
Expanded Cape set on 1.16 private acres in the Pinesfield community of East Quogue. This 5-bedroom, 2-bath home offers 1,682 sq ft of livable space across two floors. The main level features an open kitchen with a breakfast nook, formal dining area, living room, two bedrooms, and a full bath. The second floor offers three bedrooms including a generous primary suite. Outside, enjoy an in-ground pool, tennis court and beautifully landscaped grounds. Attached 2-car garage. East Quogue School District.
Key facts
- 1.13 acre lot
- 2 garage spots
- Pool
Neighborhood map
What this means for you Summary
Snapshot
- This is a 5-bed/2.0-bath single-family listed at $1.40M.
Deal economics
- At list price, monthly cash flow is $4k ($47k/yr) — positive.
- The deal already cash-flows at list — no discount required.
- Meets the 1% rule at list price ($16k rent vs $1.40M).
- Recommended offer: $1.36M (3.0% below list) — sets the bar for market timing.
Location & tenants
- Location reads 61/100 on livability (#943 in NY) — a middle-class / working-renter tenant base. Strengths: crime A+, employment A+; Watch: amenities F, commute F, cost of living F.
- East Quogue Union Free School District (suburban): math 55% / reading 50% proficiency, ranked #342 of 755 in NY (top 45%) — acceptable for families but not a draw, mixed tenant base, ~2y average lease; only 15% free/reduced lunch — higher-income household profile.
- Market conditions: 75 active listings in the ZIP; 20 comparable units currently listed for rent nearby; rentals at typical pace (median 24d on market — plan ~3-4 weeks tenant-placement turnaround); 45% of comp listings sitting > 30 days — soft ceiling on asking rent; 1,366 units permitted in Suffolk County in 2024 (216 in 5+ unit buildings).
Forward outlook
- Local home prices are declining (-3.0%/yr); year-one equity from $10k of loan paydown is wiped out by about $42k of value loss. Plan a longer hold.
- Suffolk County population projected to shrink 5% by 2050 — rents likely to lag national; underwrite the cash flow, not the appreciation.
- At projected returns (-3.0% appreciation + 3.0% rent growth), your $392k cash investment doubles in ~10 years — after that, you're playing with house money.
Negotiation context
- It's been on market 59 days — a 3% lower offer ($1.36M) is reasonable based on typical stale-listing flexibility.
- Current owner paid $295k; list at $1.40M implies a 374% gain — meaningful room to come down on a strong offer.
Risks & watch-outs
- Climate carrying-cost: severe wind risk, 80% chance of damaging wind over 30y — expect insurance premiums to compound above CPI over the hold.
Questions for the listing agent
- It's been on market 59 days. Have you received any prior offers? Is the seller open to a 3% concession, seller financing, or rate buy-down credit?
- Built in 1962 — when were the roof, HVAC, electrical panel, plumbing, and water heater last replaced?
- What does the HOA fee cover, when was the last increase, and are there any pending special assessments or reserve-fund shortfalls?
- Is there a deadline driving the sale (1031 exchange, divorce, estate, relocation)? That informs how much negotiation room exists.
- Schools are B-rated — typically a magnet for longer-tenancy family renters. What's the average tenant stay here, and is there a school-zone premium baked into asking?
- What's the average days-on-market for RENTAL listings here right now (not sales)? A rising rental-DOM trend means longer vacancies and softer asking-rent achievability than the comps imply.
- What's the recent tenant-quality profile in this submarket — average credit score on applications, eviction rate, late-payment / NSF rate, and stable-employment percentage? A property-management company in the area should have these aggregated.
- How much new for-sale + rental construction is in the pipeline within 1–3 miles? Heavy new supply typically softens prices + rents 12–24 months out; constrained supply supports both.
Investment metrics
- 1% rule
- 1.15% ✓
- Cap rate
- 9.67%
- Cash-on-cash
- 12.07%
- DSCR
- 1.54
- GRM
- 7.2
CMA / ARV
- ARV (median comp)
- $1,063,256
- List price
- $1,399,000
- Delta
- 31.58%
- Verdict
- OVERPRICED
- Comps
- 13 within 1.0 mi
Show comp detail 4 sales within ~0.75 mi
| Address | Dist | Beds/Ba | Sqft | Sold | Price | $/sf | Match |
|---|---|---|---|---|---|---|---|
| 15 Osprey Ave | 0.12mi | 4/3.0 (-1) | 2,200 (-11%) | 2mo | $1,700,000 | $773 | 66 |
| 2 Canvasback Ln | 0.23mi | 4/4.5 (-1) | 2,276 (-8%) | 16mo | $1,200,000 | $527 | 48 |
| 34 Shinnecock Rd | 0.60mi | 5/3.0 | 2,575 (+4%) | 18mo | $1,550,000 | $602 | 47 |
| 15 Wild Cherry Ln | 0.58mi | 4/3.0 (-1) | 2,800 (+13%) | 14mo | $1,800,000 | $643 | 30 |
Match score weights: distance 35% · size 25% · config 20% · recency 20%. Top-matched comps best support the ARV.
Projected returns pro-forma
-3.0% appreciation · 3.0% rent growth · sell at horizon
- IRR
- 1.6%
- Equity multiple
- 1.06×
- Total profit
- $23,853
- Equity at exit
- $208,595
- IRR
- 11.2%
- Equity multiple
- 1.87×
- Total profit
- $342,534
- Equity at exit
- $120,960
Cash invested: $391,720 (down + closing). Projections, not guarantees.
Landlord ↔ Tenant lean methodology
- Overall (STATE)
- 15 Strongly Tenant-Friendly
- State New York
- 15 Strongly Tenant-Friendly · D+10
- County
- — inherits STATE
- City
- — inherits STATE
ZIP-level market 11942
- Home prices YoY
- -25.0%
- Active inventory
- 75
- Price-to-rent
- 7.2×
Monthly cashflow live
- Estimated rent
- $16,085 high interval (Pro) →
- Mortgage (P&I)
- −$7,337
- Tax from tax record
- −$807 /mo · $9,684/yr
- Insurance
- −$583
- HOA
- −$42
- Vacancy / Maint / Mgmt
- −$3,378
- Net cashflow
- $3,939
Break-even live
UW: 25.0% down · 7.5% · 30yr · 1.5% tax · 5.0% vac · 8.0% maint · 8.0% mgmt
Financing live
Cash to close
- Down payment
- $349,750
- Closing costs
- $41,970
- Reserves months
- —
- Total cash needed
- —
Loan-product check · same deal, 3 products live
Conventional
25% down · 7.5% · 30yr
- Down + closing
- —
- Monthly P&I
- —
- Monthly cashflow
- —
- DSCR
- —
- Eligible?
- —
Personal DTI + credit; lowest rate.
DSCR
20% down · 8.5% · 30yr
- Down + closing
- —
- Monthly P&I
- —
- Monthly cashflow
- —
- DSCR
- —
- Eligible?
- —
No personal income docs; deal must DSCR.
Hard money
10% down · 12.0% · 12mo
- Down + closing
- —
- Monthly P&I
- —
- Monthly cashflow
- —
- DSCR
- —
- Eligible?
- —
Short-term bridge; refi at stabilization.
Rent comps 20 comps
| Address | Beds | Baths | Sqft | Rent | $/sqft | DOM | Units | Dist |
|---|---|---|---|---|---|---|---|---|
| 4 Landing Ln East Quogue, NY | 6.0 | 4.5 | 3000 | $50,000 | $16.67 | 21d | 1 | 0.10mi |
| 13 Beachland Ave East Quogue, NY | 4.0 | 4.0 | 2028 | $38,000 | $18.74 | 21d | 1 | 0.20mi |
| 23 Whiting Rd East Quogue, NY | 4.0 | 3.5 | 2296 | $60,000 | $26.13 | 21d | 1 | 0.40mi |
| 26 Squires Ave East Quogue, NY | 4.0 | 2.5 | 2950 | $7,000 | $2.37 | 43d | 1 | 0.48mi |
| 10 Skyes Neck Ct East Quogue, NY | 4.0 | 3.0 | 2249 | $80,000 | $35.57 | 24d | 1 | 0.53mi |
| 10 Foxboro Rd Hampton Bays, NY | 4.0 | 2.5 | 2308 | $17,000 | $7.37 | 43d | 1 | 0.62mi |
| 58 Homewood Dr Hampton Bays, NY | 4.0 | 3.0 | 2700 | $17,000 | $6.30 | 24d | 1 | 0.72mi |
| 4 Bennett Dr East Quogue, NY | 4.0 | 3.0 | 2400 | $11,000 | $4.58 | 17d | 1 | 0.83mi |
| 4 Bennett Dr East Quogue, NY | 4.0 | 3.0 | 2144 | $11,000 | $5.13 | 5d | 1 | 0.83mi |
| 3 Bennett Dr East Quogue, NY | 4.0 | 4.0 | 2673 | $5,000 | $1.87 | 43d | 1 | 0.84mi |
| 19 Pine Tree Ln East Quogue, NY | 6.0 | 5.0 | 2872 | $23,000 | $8.01 | 1d | 1 | 0.85mi |
| 4 Aerie Way East Quogue, NY | 4.0 | 3.0 | 2400 | $11,000 | $4.58 | 15d | 1 | 0.89mi |
| 36 Walker Ave East Quogue, NY | 5.0 | 3.0 | 2500 | $23,000 | $9.20 | 7d | 1 | 0.98mi |
| 2 Bayside Ave East Quogue, NY | 4.0 | 3.0 | 2280 | $80,000 | $35.09 | 21d | 1 | 1.09mi |
| 45 Bellows Ter Unit B Hampton Bays, NY | 4.0 | 2.0 | 1722 | $7,000 | $4.07 | 43d | 1 | 1.18mi |
| 1 Candace Dr East Quogue, NY | 4.0 | 4.0 | 3000 | $25,000 | $8.33 | 43d | 1 | 1.19mi |
| 21 Bayside Ave East Quogue, NY | 4.0 | 3.0 | 2900 | $14,000 | $4.83 | 43d | 1 | 1.20mi |
| 16 Vail Ave East Quogue, NY | 5.0 | 2.0 | 1796 | $4,500 | $2.51 | 43d | 1 | 1.23mi |
| 156 Maggie Dr East Quogue, NY | 4.0 | 4.0 | 2700 | $95,000 | $35.19 | 43d | 1 | 1.35mi |
| 8 Paynes Ln East Quogue, NY | 4.0 | 2.0 | 1776 | $18,000 | $10.14 | 43d | 1 | 1.47mi |
HOA detail
- Monthly dues
- $42 · $504/yr
- Likely covers
- landscapingpool
Listing history 17 events
-
2026-06-18days on market $1,399,000 Active 59 DOM
-
2026-06-17days on market $1,399,000 Active 58 DOM
-
2026-06-16days on market $1,399,000 Active 57 DOM
-
2026-06-15days on market $1,399,000 Active 56 DOM
-
2026-06-13days on market $1,399,000 Active 54 DOM
-
2026-06-13days on market $1,399,000 Active 53 DOM
-
2026-06-09days on market $1,399,000 Active 50 DOM
-
2026-06-08days on market $1,399,000 Active 49 DOM
-
2026-06-07days on market $1,399,000 Active 48 DOM
-
2026-06-04days on market $1,399,000 Active 45 DOM
-
2026-06-03days on market $1,399,000 Active 44 DOM
-
2026-06-02days on market $1,399,000 Active 43 DOM
-
2026-06-01days on market $1,399,000 Active 42 DOM
-
2026-05-31days on market $1,399,000 Active 41 DOM
-
2026-05-18price $1,399,000 503-char remark
Show marketing remark (503 chars)
Expanded Cape set on 1.16 private acres in the Pinesfield community of East Quogue. This 5-bedroom, 2-bath home offers 1,682 sq ft of livable space across two floors. The main level features an open kitchen with a breakfast nook, formal dining area, living room, two bedrooms, and a full bath. The second floor offers three bedrooms including a generous primary suite. Outside, enjoy an in-ground pool, tennis court and beautifully landscaped grounds. Attached 2-car garage. East Quogue School District.
-
2026-04-20$1,500,000 Active 503-char remark
Show marketing remark (503 chars)
Expanded Cape set on 1.16 private acres in the Pinesfield community of East Quogue. This 5-bedroom, 2-bath home offers 1,682 sq ft of livable space across two floors. The main level features an open kitchen with a breakfast nook, formal dining area, living room, two bedrooms, and a full bath. The second floor offers three bedrooms including a generous primary suite. Outside, enjoy an in-ground pool, tennis court and beautifully landscaped grounds. Attached 2-car garage. East Quogue School District.
-
1986-09-23soldstatus $295,000
ⓘ Source: listings_history table (triggers on properties + properties_extension) + one-shot
backfill from property_details.listing_events for pre-trigger history.
Tax reassessment forecast NY · Partial reset (capped growth)
- Current annual tax
- $9,684 · $807/mo
- Projected year-2 tax
- $16,664 · $1,389/mo
- Expected delta
- +$6,980/yr (+$582/mo · 72.1%)
ⓘ Screening estimate from a state-policy table — verify with the county assessor before closing.
Climate risk First Street
- Flood 1/10 Low FEMA zone X (unshaded) · 0% chance over 30 yrs
- Wildfire 1/10 Low
- Heat 4/10 Moderate 7 d/yr ≥90°F today · 19 d/yr by 30 yrs out
- Wind 8/10 Severe 80% chance of damaging wind over 30 yrs
- Air quality 2/10 Low 2 unhealthy d/yr today · 2 by 30 yrs out
Nearby sold comps map
Loading sold comps map…
Walkable amenities ~0.75 mi
Loading nearby amenities…
Taxation est. · year 1
- Rental income
- $193,020
- − Mortgage interest
- −$78,366
- − Property taxes
- −$9,684
- − Insurance
- −$6,995
- − Repairs & maintenance
- −$15,442
- − Management
- −$15,442
- − HOA
- −$504
- − Depreciation
- −$40,698
- Taxable income
- $25,890
- Est. tax owed @ 24.0%
- −$6,214
- After-tax cash flow
- $41,051/yr
For passive investors: Depreciation is non-cash, so a rental often shows a tax loss while cash-flowing — sheltering income. Rental losses are passive: they offset passive income freely, and up to $25,000/yr can offset ordinary (W-2) income if you actively participate and your MAGI is under $100k (phasing out to $0 by $150k); unused losses carry forward. On sale, claimed depreciation is recaptured at up to 25%, and gains may owe capital-gains tax (a 1031 exchange can defer both). Figures are a year-1 estimate at your 24.0% rate — not tax advice; consult a CPA.
Schools (NCES district)
- District
- East Quogue Union Free School District
- NCES district ID
- 3609900
- Math proficiency
- 55% ▬ 0.00%
- Reading proficiency
- 50% ▲ 5.00%
- Median HH income
- $81,457
- Composite
- 49.79/100
- National rank
- #4207
- State rank
- #342 of 755 in NY
Livability — East Quogue
- Score
- 61/100
- State rank
- #943
- US rank
- #18348
Category grades
Schools grade is shown separately in the Schools card above.
Census & demographics
- Census place
- East Quogue, NY
- City population
- 5,871
- Population (ZIP)
- 5,871
Population outlook (Suffolk County) Hauer SSP2
- Today (2025)
- 1,505,262 people
- By 2030
- 1,498,318 · -0.5%
- By 2040
- 1,471,101 · -2.3%
- By 2050
- 1,424,848 · -5.3%
- By 2075
- 1,337,157 · -11.2%
- By 2100
- 1,217,720 · -19.1%
Race, ethnicity, and origin ACS 2023
- Neighborhood character
- Predominantly White (80%)
- Race & ethnicity
- White 80% Hispanic / Latino 16% Asian 2% Two or more races 2%
- Hispanic origin (detail)
- Mexican 3%
- Common ancestry
- Romanian 6% Scotch-Irish 3% Lithuanian 3%
- Foreign-born
- 13% · Canada, Jamaica, Guatemala
- Languages at home
- 80% English-only · Spanish 12% Other Indo-European 2% Russian/Polish/Slavic 2%
Political lean MEDSL · Suffolk
- 2024 margin
- Lean R (+10.0) · D 45.0% · R 55.0%
- 2008→2024 swing
- -16.0pp toward R · 2008: 6.0pp · 2024: -10.0pp
- All cycles
- 2024: R+10.0 2020: R+0.0 2016: R+8.2 2012: D+2.9 2008: D+6.0
Not yet ingested
- Civics
- —
Market trends
- HPI YoY
- ▼ -145.33%
- Current HPI
- 435.8017
- Rent YoY
- —
- Metro
- —
- State GDP YoY
- ▲ 2.60%
- F500 in state
- 92
Industry mix (Fortune 500 HQ in NY)
| Industry | F500 HQs | Revenue |
|---|---|---|
| Financial Services | 10 | $950B |
|
||
| Consumer Goods | 9 | $162B |
|
||
| Insurance | 4 | $225B |
|
||
| Telecommunications | 2 | $144B |
|
||
| Pharmaceuticals | 2 | $112B |
|
||
| Media / Entertainment | 2 | $69B |
|
||
Price history
+374.2% since first listed3 events — show timeline
- 2026-05-18 Price Changed $1,399,000 OneKey® MLS as Distributed by MLS Grid
- 2026-04-20 Listed $1,500,000 OneKey® MLS as Distributed by MLS Grid
- 1986-09-23 Sold (Public Records) $295,000 Public Records
Property tax history
+0.7%/yrLatest (2022): $9,684 · +0.0% YoY. Source: county tax records.
Cash-flow waterfall
monthlySold comps — $/sqft
last 12 mo · ≤1 miLoading sold comps…