4232 Notting Hill Dr SW · Atlanta, GA
Flood risk 1/10 · Minimal
- FEMA flood zone
- X (unshaded)
- Chance of flooding over 30 yrs
- 0.0%
- Est. flood insurance / yr
- $473 – $860
Fire risk 2/10 · Minimal
- Est. fire insurance / yr
- $963 – $1,789
Heat risk 5/10 · Moderate
- Hot days now (above 103°F)
- 7 days/yr
- Hot days in 30 yrs
- 17 days/yr
Wind risk 5/10 · Moderate
- Chance of severe wind over 30 yrs
- 25.0%
Air-quality risk 3/10 · Minor
- Unhealthy air days now
- 3 days/yr
- Unhealthy air days in 30 yrs
- 3 days/yr
Risk factors via First Street. Map © Google.
Why this score? — see what drove the D+ grade
The composite is a weighted blend of 9 inputs, each scored 0–100. Each bar is that input's sub-score; the figure is the points it added to the 100-point composite (weight × sub-score).
- ARV discount +15.0/15.0
- Cash flow +13.6/30.0
- Livability +4.2/5.0
- 1% rule +4.1/10.0
- DSCR +4.1/10.0
- Rent growth +3.2/5.0
- Schools +2.7/10.0
- Condition / age +2.2/5.0
- Appreciation +0.0/10.0
$207,000
🖨 Deal sheet (PDF) 📄 Offer letter ✓ Due diligence
Listing remarks MLS
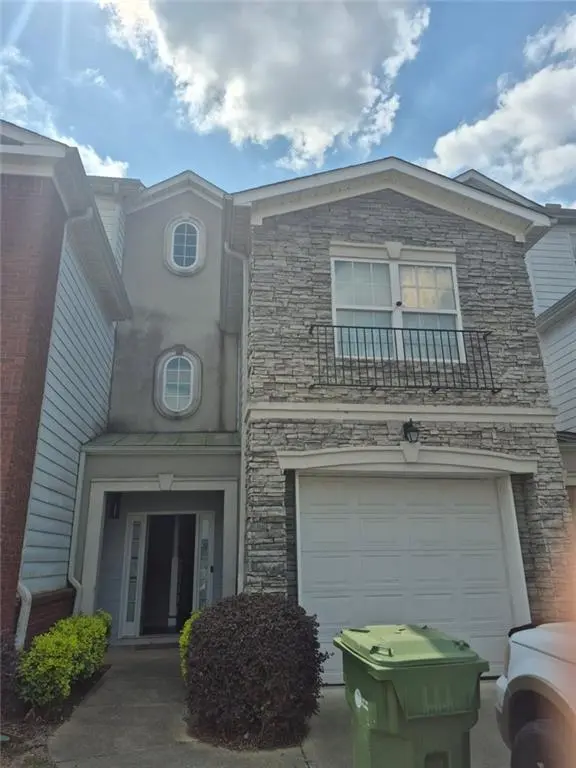
This Atlanta two-story home offers a one-car garage.
Key facts
- $40 HOA
- Garage
- Built 2006
Property features AI
Finance
- Other: Paved road frontage on a city street
- HOA & community: Monthly association fee of $40; Community has 50 units
Exterior
- Parking: Garage (1 garage space); Two total parking spaces
- Utilities: Public water; Public sewer; Electric service with 220 volts; Electricity available; Natural gas available
- Home design: Three or more levels; Fee simple ownership; Resale condition
- Construction: Frame construction; Shingle roof; Slab foundation
- Exterior features: Exterior lighting; Private entrance; Deck
Interior
- Kitchen: Refrigerator included; No specific kitchen features listed
- Bedrooms: One main-level bedroom; Two upper-level bedrooms
- Flooring: Laminate flooring
- Bathrooms: Two full bathrooms; One half bathroom (main level)
- Heating & cooling: Central heating; Central air conditioning
- Interior features: One fireplace located in the living room; Other interior features; 2+ shared/common walls; Full finished basement
- Laundry & utility: Laundry located in hall
Neighborhood map
What this means for you Summary
Snapshot
- This is a 3-bed/2.5-bath townhouse listed at $207k. Condition is rated fair.
Deal economics
- At list price, monthly cash flow is $10 ($118/yr) — positive.
- The deal already cash-flows at list — no discount required.
- To meet the 1% rule (rent ≥ 1% of price), the offer needs to be $187k (9.5% below list).
- Recommended offer: $187k (9.5% below list) — sets the bar for 1% rule.
- Cap rate 6.4% vs local median 3.1% in Atlanta — top-decile yield for the area; either an underpriced asset or a hidden risk that comps aren't pricing in. Stress-test before assuming the spread holds.
Location & tenants
- Location reads 83/100 on livability (#6 in GA, #919 nationally) — a professional / high-income tenant draw. Strengths: amenities A+, commute A+, housing A+; Watch: cost of living C-.
- Atlanta Public Schools (urban): math 28% / reading 35% proficiency, ranked #80 of 174 in GA (top 46%) — families likely to look elsewhere, expect single-tenant / working-renter base with shorter leases; 71% free/reduced lunch — lower-income household profile, screen leases tightly.
- Zoned schools: Deerwood Academy (math 8% / reading 17%, grade F, #1,032 of 1,228 statewide, top 85%, 512 students, 100% FRL); Ralph Bunche Middle School (math 2% / reading 12%, grade F, #449 of 470 statewide, top 97%, 824 students, 100% FRL); D. M. Therrell High School (math 5% / reading 10%, grade F, #378 of 424 statewide, top 91%, 973 students, 100% FRL) — zoned schools average 100% FRL vs 71% district-wide (29 pts higher); higher-poverty schools than district average — tighter screening recommended.
- Zoned-school proficiency averages 9% at this address vs 32% district-wide (-22 pts) — the specific schools serving this property underperform the Atlanta Public Schools average; the district grade overstates school quality for this exact location.
- Market conditions: Rents rising (+2.6%/yr); 485 active listings in the ZIP; 24 comparable units currently listed for rent nearby; rentals at typical pace (median 26d on market — plan ~3-4 weeks tenant-placement turnaround); 11,565 units permitted in Fulton County in 2024 (8,159 in 5+ unit buildings).
- This rent runs 36% of the median local income ($63k/yr) — at the standard rent-burdened threshold; future hikes will face affordability resistance.
Forward outlook
- Local home prices are declining (-3.0%/yr); year-one equity from $1k of loan paydown is wiped out by about $6k of value loss. Plan a longer hold.
- Fulton County population projected at +38% by 2050 — long-run rental-demand tailwind backs the buy-and-hold thesis.
Negotiation context
- It's been on market 64 days — a 6% lower offer ($195k) is reasonable based on typical stale-listing flexibility.
- 5 sale attempts since 4y ago; this cycle's ask has dropped $68k (25%) from the opening price — seller is motivated, your offer sets the floor, not the list.
Risks & watch-outs
- Climate carrying-cost: moderate wind risk, 25% chance of damaging wind over 30y; extreme-heat days projected 7→17/yr by 2055 (HVAC capex compounding) — expect insurance premiums to compound above CPI over the hold.
Questions for the listing agent
- It's been on market 64 days. Have you received any prior offers? Is the seller open to a 9% concession, seller financing, or rate buy-down credit?
- Have any recent inspections been done? Can we get a copy of the seller's disclosures and any deferred-maintenance estimates?
- What does the HOA fee cover, when was the last increase, and are there any pending special assessments or reserve-fund shortfalls?
- Why hasn't it sold? Are there any deal-killer items the seller is aware of (foundation, flood, title, zoning, code violations)?
- Is there a deadline driving the sale (1031 exchange, divorce, estate, relocation)? That informs how much negotiation room exists.
- The area grade is low — what's the realistic commute time and amenity access for the typical tenant pool here? Any planned neighborhood developments (good or bad) we should know about?
- What's the average days-on-market for RENTAL listings here right now (not sales)? A rising rental-DOM trend means longer vacancies and softer asking-rent achievability than the comps imply.
- What's the recent tenant-quality profile in this submarket — average credit score on applications, eviction rate, late-payment / NSF rate, and stable-employment percentage? A property-management company in the area should have these aggregated.
- How much new for-sale + rental construction is in the pipeline within 1–3 miles? Heavy new supply typically softens prices + rents 12–24 months out; constrained supply supports both.
Investment metrics
- 1% rule
- 0.91% ✗
- Cap rate
- 6.35%
- Cash-on-cash
- 0.20%
- DSCR
- 1.01
- GRM
- 9.2
CMA / ARV
- ARV (on-the-fly)
- $304,202
- Comps found
- 12
Show comp detail 12 sales within ~0.75 mi
| Address | Dist | Beds/Ba | Sqft | Sold | Price | $/sf | Match |
|---|---|---|---|---|---|---|---|
| 4226 Notting Hill Dr SW | 0.01mi | 3/2.5 | 1,709 (0%) | 9mo | $150,000 | $88 | 92 |
| 4212 Nottinghill Dr | 0.05mi | 2/3.0 (-1) | 1,644 (-4%) | 3mo | $190,000 | $116 | 82 |
| 4316 SW Notting Hill Dr SW | 0.06mi | 3/2.5 | 1,644 (-4%) | 11mo | $221,000 | $134 | 82 |
| 4262 Notting Hill Dr SW #30 | 0.07mi | 3/2.5 | 1,467 (-14%) | 9mo | $289,990 | $198 | 66 |
| 4258 SW Notting Hill Dr #32 | 0.07mi | 3/2.5 | 1,476 (-14%) | 10mo | $264,990 | $180 | 65 |
| 4261 Notting Hill Dr SW | 0.06mi | 3/2.5 | 1,467 (-14%) | 10mo | $259,990 | $177 | 65 |
| 4260 SW Notting Hill Dr #31 | 0.07mi | 3/2.5 | 1,476 (-14%) | 11mo | $264,990 | $180 | 65 |
| 4270 Notting Hill Dr SW #26 | 0.09mi | 3/2.5 | 1,467 (-14%) | 10mo | $294,990 | $201 | 64 |
| 4285 Notting Hill Dr #65 | 0.06mi | 3/2.5 | 1,467 (-14%) | 12mo | $249,990 | $170 | 64 |
| 4283 Notting Hill Dr #66 | 0.06mi | 3/2.5 | 1,467 (-14%) | 12mo | $264,990 | $181 | 63 |
| 4276 Notting Hill Dr #23 | 0.09mi | 3/2.5 | 1,467 (-14%) | 12mo | $259,990 | $177 | 62 |
| 4272 Notting Hill Dr #25 | 0.09mi | 3/2.5 | 1,467 (-14%) | 12mo | $260,990 | $178 | 62 |
Match score weights: distance 35% · size 25% · config 20% · recency 20%. Top-matched comps best support the ARV.
Projected returns pro-forma
-3.0% appreciation · 2.63% rent growth · sell at horizon
- IRR
- -16.4%
- Equity multiple
- 0.42×
- Total profit
- $-33,558
- Equity at exit
- $30,864
- IRR
- -8.7%
- Equity multiple
- 0.46×
- Total profit
- $-31,030
- Equity at exit
- $17,898
Cash invested: $57,960 (down + closing). Projections, not guarantees.
Landlord ↔ Tenant lean methodology
- Overall (STATE)
- 90 Strongly Landlord-Friendly
- State Georgia
- 90 Strongly Landlord-Friendly · R+3
- County
- — inherits STATE
- City
- — inherits STATE
ZIP-level market 30331
- Home prices YoY
- -34.2%
- Rents YoY
- 2.6%
- Active inventory
- 485
- Price-to-rent
- 9.2×
Monthly cashflow live
- Estimated rent
- $1,874 high interval (Pro) →
- Mortgage (P&I)
- −$1,086
- Tax est. 1.5%
- −$259 /mo · $3,105/yr
- Insurance
- −$86
- HOA
- −$40
- Vacancy / Maint / Mgmt
- −$394
- Net cashflow
- $10
Break-even live
Sensitivity live
| Price | -10% $153 | -5% $81 | +0% $10 | +5% $-62 | +10% $-133 |
|---|---|---|---|---|---|
| Rent | -10% $-138 | -5% $-64 | +0% $10 | +5% $84 | +10% $158 |
| Rate | -1.0pp $114 | -0.5pp $62 | base $10 | +0.5pp $-44 | +1.0pp $-98 |
UW: 25.0% down · 7.5% · 30yr · 1.5% tax · 5.0% vac · 8.0% maint · 8.0% mgmt
Financing live
Cash to close
- Down payment
- $51,750
- Closing costs
- $6,210
- Reserves months
- —
- Total cash needed
- —
Loan-product check · same deal, 3 products live
Conventional
25% down · 7.5% · 30yr
- Down + closing
- —
- Monthly P&I
- —
- Monthly cashflow
- —
- DSCR
- —
- Eligible?
- —
Personal DTI + credit; lowest rate.
DSCR
20% down · 8.5% · 30yr
- Down + closing
- —
- Monthly P&I
- —
- Monthly cashflow
- —
- DSCR
- —
- Eligible?
- —
No personal income docs; deal must DSCR.
Hard money
10% down · 12.0% · 12mo
- Down + closing
- —
- Monthly P&I
- —
- Monthly cashflow
- —
- DSCR
- —
- Eligible?
- —
Short-term bridge; refi at stabilization.
Rent comps 24 comps
| Address | Beds | Baths | Sqft | Rent | $/sqft | DOM | Units | Dist |
|---|---|---|---|---|---|---|---|---|
| 2356 County Line Rd SW Atlanta, GA | 3.0 | 1.0 | 1360 | $1,695 | $1.25 | 26d | 1 | 0.20mi |
| 4407 Kimball Rd SW Atlanta, GA | 3.0 | 2.0 | 1976 | $1,855 | $0.94 | 0d | 1 | 0.37mi |
| 4515 Doral Dr SW Atlanta, GA | 3.0 | 1.5 | 1184 | $1,700 | $1.44 | 16d | 1 | 0.42mi |
| 4522 Doral Dr SW Atlanta, GA | 3.0 | 2.0 | 1980 | $1,990 | $1.01 | 4d | 1 | 0.44mi |
| 4211 Campbellton Rd SW Atlanta, GA | 3.0 | 2.0 | 1384 | $2,050 | $1.48 | 24d | 1 | 0.54mi |
| 4545 Sahara Dr SW Atlanta, GA | 3.0 | 2.0 | 1075 | $1,665 | $1.55 | 7d | 1 | 0.57mi |
| 4596 Sahara Dr SW Atlanta, GA | 4.0 | 1.5 | 1375 | $1,500 | $1.09 | 6d | 1 | 0.62mi |
| 4596 Sahara Dr SW Atlanta, GA | 4.0 | 1.5 | 1475 | $1,200 | $0.81 | 26d | 1 | 0.62mi |
| 4610 Greenbriar Trl SW Unit 204 Atlanta, GA | 3.0 | 2.0 | 1206 | $1,950 | $1.62 | 14d | 1 | 0.74mi |
| 4720 Edwina Ln SW Atlanta, GA | 4.0 | 2.0 | 1400 | $1,873 | $1.34 | 4d | 1 | 0.74mi |
| 2243 Butner Rd Unit NA Atlanta, GA | 4.0 | 2.5 | 1518 | $2,350 | $1.55 | 26d | 1 | 0.78mi |
| 2211 Butner Rd SW Atlanta, GA | 4.0 | 2.0 | 1336 | $1,875 | $1.40 | 26d | 1 | 0.81mi |
| 4058 Blanton Ave SW Atlanta, GA | 4.0 | 2.0 | 1476 | $1,750 | $1.19 | 18d | 1 | 0.82mi |
| 1960 W Kimberly Rd SW Atlanta, GA | 3.0 | 2.5 | 1852 | $2,105 | $1.14 | 26d | 1 | 0.83mi |
| 2111 Sandtree Ct SW Unit 2 Atlanta, GA | 2.0 | 1.0 | 1100 | $1,500 | $1.36 | 26d | 1 | 0.83mi |
| 4037 Braxton Pl SW Unit 4037 Atlanta, GA | 4.0 | 3.0 | 1397 | $2,100 | $1.50 | 26d | 1 | 0.85mi |
| 4043 Avalon Rd SW Atlanta, GA | 4.0 | 3.0 | 1434 | $2,300 | $1.60 | 26d | 1 | 0.85mi |
| 2100 Southwood Blvd SW Atlanta, GA | 1.0–2.0 | 1.0–2.0 | 942 | $1,537 | $1.63 | 0d | 16 | 0.92mi |
| 1928 Grant Rd SW Atlanta, GA | 3.0 | 2.0 | 1160 | $1,823 | $1.57 | 24d | 1 | 1.06mi |
| 3901 Campbellton Rd SW Unit 3909-M06 Atlanta, GA | 2.0 | 1.5 | 1093 | $1,150 | $1.05 | 26d | 1 | 1.13mi |
| 3901 Campbellton Rd SW Unit 3909-K01 Atlanta, GA | 2.0 | 1.5 | 1093 | $1,199 | $1.10 | 26d | 1 | 1.13mi |
| 3901 Campbellton Rd SW Unit 3901-L04 Atlanta, GA | 2.0 | 1.5 | 1093 | $1,140 | $1.04 | 26d | 1 | 1.13mi |
| 4970 Promenade Dr SW Atlanta, GA | 4.0 | 2.5 | 2250 | $2,580 | $1.15 | 0d | 1 | 1.19mi |
| 2164 Camp Ground Rd SW Atlanta, GA | 3.0 | 1.5 | 1128 | $1,595 | $1.41 | 26d | 1 | 1.28mi |
HOA detail
- Monthly dues
- $40 · $480/yr
Listing history 28 events
-
2026-06-21days on market $207,000 Active 64 DOM
-
2026-06-18days on market $207,000 Active 61 DOM
-
2026-06-17days on market $207,000 Active 60 DOM
-
2026-06-16days on market $207,000 Active 59 DOM
-
2026-06-15days on market $207,000 Active 58 DOM
-
2026-06-13days on market $207,000 Active 56 DOM
-
2026-06-13days on market $207,000 Active 55 DOM
-
2026-06-08days on market $207,000 Active 52 DOM
-
2026-06-07days on market $207,000 Active 51 DOM
-
2026-06-04days on market $207,000 Active 48 DOM
-
2026-06-03days on market $207,000 Active 47 DOM
-
2026-06-02days on market $207,000 Active 46 DOM
-
2026-06-01days on market $207,000 Active 45 DOM
-
2026-05-31days on market $207,000 Active 44 DOM
-
2026-05-23status Active
-
2026-05-23price $207,000
-
2026-05-15historical Active Under Contract
-
2026-05-04price $219,000
-
2026-05-04status Active
-
2026-04-30price $230,000
-
2026-04-30historical
-
2026-04-13status Active
-
2026-04-13price $240,000
-
2026-04-02status Pending
-
2026-04-01$275,000 Active
-
2022-03-14soldstatus $256,000 Sold 52-char remark
Show marketing remark (52 chars)
This Atlanta two-story home offers a one-car garage.
-
2022-02-26status Under Contract 52-char remark
Show marketing remark (52 chars)
This Atlanta two-story home offers a one-car garage.
-
2022-02-18$240,000 New 52-char remark
Show marketing remark (52 chars)
This Atlanta two-story home offers a one-car garage.
ⓘ Source: listings_history table (triggers on properties + properties_extension) + one-shot
backfill from property_details.listing_events for pre-trigger history.
Climate risk First Street
- Flood 1/10 Low FEMA zone X (unshaded) · 0% chance over 30 yrs
- Wildfire 2/10 Low
- Heat 5/10 Major 7 d/yr ≥103°F today · 17 d/yr by 30 yrs out
- Wind 5/10 Major 25% chance of damaging wind over 30 yrs
- Air quality 3/10 Moderate 3 unhealthy d/yr today · 3 by 30 yrs out
Nearby sold comps map
Loading sold comps map…
Walkable amenities ~0.75 mi
Loading nearby amenities…
Taxation est. · year 1
- Rental income
- $22,487
- − Mortgage interest
- −$11,595
- − Property taxes
- −$3,105
- − Insurance
- −$1,035
- − Repairs & maintenance
- −$1,799
- − Management
- −$1,799
- − HOA
- −$480
- − Depreciation
- −$6,022
- Taxable loss
- −$3,348
- Est. tax savings @ 24.0%
- +$804
- After-tax cash flow
- $922/yr
For passive investors: Depreciation is non-cash, so a rental often shows a tax loss while cash-flowing — sheltering income. Rental losses are passive: they offset passive income freely, and up to $25,000/yr can offset ordinary (W-2) income if you actively participate and your MAGI is under $100k (phasing out to $0 by $150k); unused losses carry forward. On sale, claimed depreciation is recaptured at up to 25%, and gains may owe capital-gains tax (a 1031 exchange can defer both). Figures are a year-1 estimate at your 24.0% rate — not tax advice; consult a CPA.
Condition & rehab AI · 12 photos
This townhouse presents as needing moderate renovations, with repairs and maintenance required in various areas. Upgrading the kitchen and painting the interior can significantly increase its resale and rental value.
Repairs flagged
- Minor Carpeted stairs and landing — Visible dirt and stains.
- Minor Windows — Dust and dirt on glass surfaces.
- Moderate Siding — Weathered and peeling in some areas.
- Minor Paint — Faded in some areas, especially on walls and trim.
Value-add opportunities
- Resale Replace dated kitchen cabinets and countertops — Modernizing the kitchen can significantly increase the home's appeal and value.
- Both Paint interior walls and trim — Fresh paint can improve the home's curb appeal and interior aesthetics.
- Resale Replace worn-out siding — New siding can enhance the home's curb appeal and increase its value.
- Both Clean and maintain windows — Clean windows can improve natural light and the home's overall appearance.
- Both Landscaping and curb appeal improvements — Well-maintained landscaping can increase the home's curb appeal and attract potential buyers/tenants.
Renovation cost estimate screening
| Repair item | Severity | Est. cost |
|---|---|---|
| Carpeted stairs and landing · Visible dirt and stains. | Minor | $500–3,000 |
| Windows · Dust and dirt on glass surfaces. | Minor | $500–3,000 |
| Siding · Weathered and peeling in some areas. | Moderate | $3,000–15,000 |
| Paint · Faded in some areas, especially on walls and trim. | Minor | $500–3,000 |
| Total estimated repair cost · 4 items | $4,500–24,000 |
Value-add ROI direction
- Resale Replace dated kitchen cabinets and countertops — Modernizing the kitchen can significantly increase the home's appeal and value. ↑
- Both Paint interior walls and trim — Fresh paint can improve the home's curb appeal and interior aesthetics. ↑
- Resale Replace worn-out siding — New siding can enhance the home's curb appeal and increase its value. ↑
- Both Clean and maintain windows — Clean windows can improve natural light and the home's overall appearance. ↑
- Both Landscaping and curb appeal improvements — Well-maintained landscaping can increase the home's curb appeal and attract potential buyers/tenants. ↑
ⓘ Cost ranges are severity-bucket heuristics (US national rule-of-thumb). Get contractor quotes + a written scope before underwriting a rehab budget.
Schools (NCES district)
- District
- Atlanta Public Schools
- NCES district ID
- 1300120
- Math proficiency
- 28% ▼ -6.00%
- Reading proficiency
- 35% ▼ -2.00%
- Median HH income
- $48,306
- Composite
- 27.27/100
- National rank
- #7006
- State rank
- #80 of 174 in GA
Livability — Atlanta
- Score
- 83/100
- State rank
- #6
- US rank
- #919
Category grades
Schools grade is shown separately in the Schools card above.
Census & demographics
- Census place
- Atlanta, GA
- County
- Fulton County · 1,094,430 people
- City population
- 629,525
- Metro
- Atlanta-Sandy Springs-Alpharetta, GA
- Population (ZIP)
- 62,567
- Household income
- $62,623
- Rent vs Own
- Severe rent burden
- 3748.0
Population outlook (Fulton County) Hauer SSP2
- Today (2025)
- 1,203,707 people
- By 2030
- 1,299,706 · +8.0%
- By 2040
- 1,488,256 · +23.6%
- By 2050
- 1,664,580 · +38.3%
- By 2075
- 2,036,072 · +69.2%
- By 2100
- 2,222,402 · +84.6%
Race, ethnicity, and origin ACS 2023
- Neighborhood character
- Predominantly Black (94%)
- Race & ethnicity
- Black 94% Two or more races 3% Hispanic / Latino 2%
- Common ancestry
- Hispanic 1%
- Foreign-born
- 4% · Canada
- Languages at home
- 95% English-only · Spanish 1% French/Haitian/Cajun 1%
Political lean MEDSL · Fulton
- 2024 margin
- Solid D (+44.9) · D 71.9% · R 27.0% · Other 1.1%
- 2008→2024 swing
- +9.8pp toward D · 2008: 35.0pp · 2024: 44.9pp
- All cycles
- 2024: D+44.9 2020: D+46.4 2016: D+42.1 2012: D+29.6 2008: D+35.0
Not yet ingested
- Civics
- —
Market trends
- HPI YoY
- ▼ -106.38%
- Current HPI
- 204.5402
- Rent YoY
- ▲ 2.63%
- Metro
- Atlanta-Sandy Springs-Alpharetta, GA
- State GDP YoY
- ▲ 2.66%
- F500 in state
- 28
Industry mix (Fortune 500 HQ in GA)
| Industry | F500 HQs | Revenue |
|---|---|---|
| Paper / Packaging | 2 | $29B |
|
||
| Retail | 1 | $160B |
|
||
| Transportation / Logistics | 1 | $91B |
|
||
| Airlines | 1 | $62B |
|
||
| Consumer Goods | 1 | $47B |
|
||
| Utilities | 1 | $25B |
|
||
Price history
-13.8% since first listed14 events — show timeline
- 2026-05-23 Relisted — FMLS
- 2026-05-23 Price Changed $207,000 FMLS
- 2026-05-15 Contingent — FMLS
- 2026-05-04 Price Changed $219,000 FMLS
- 2026-05-04 Relisted — FMLS
- 2026-04-30 Price Changed $230,000 FMLS
- 2026-04-30 Listing Removed — FMLS
- 2026-04-13 Relisted — FMLS
- 2026-04-13 Price Changed $240,000 FMLS
- 2026-04-02 Pending — FMLS
- 2026-04-01 Listed $275,000 FMLS
- 2022-03-14 Sold (MLS) $256,000 GAMLS
- 2022-02-26 Pending — GAMLS
- 2022-02-18 Listed $240,000 GAMLS
Cash-flow waterfall
monthlySold comps — $/sqft
last 12 mo · ≤1 miLoading sold comps…