2764 Chloe Dr · San Antonio, TX
Flood risk 1/10 · Minimal
- FEMA flood zone
- X (unshaded)
- Chance of flooding over 30 yrs
- 0.0%
- Est. flood insurance / yr
- $507 – $1,088
Fire risk 4/10 · Minor
- Est. fire insurance / yr
- $1,222 – $2,270
Heat risk 8/10 · Major
- Hot days now (above 108°F)
- 7 days/yr
- Hot days in 30 yrs
- 21 days/yr
Wind risk 8/10 · Major
- Chance of severe wind over 30 yrs
- 80.0%
Air-quality risk 1/10 · Minimal
- Unhealthy air days now
- 0 days/yr
- Unhealthy air days in 30 yrs
- 0 days/yr
Risk factors via First Street. Map © Google.
Why this score? — see what drove the D+ grade
The composite is a weighted blend of 9 inputs, each scored 0–100. Each bar is that input's sub-score; the figure is the points it added to the 100-point composite (weight × sub-score).
- Cash flow +18.3/30.0
- ARV discount +7.5/15.0
- DSCR +5.8/10.0
- 1% rule +4.9/10.0
- Livability +4.0/5.0
- Condition / age +2.5/5.0
- Schools +2.4/10.0
- Rent growth +2.2/5.0
- Appreciation +0.0/10.0
$165,000
🖨 Deal sheet (PDF) 📄 Offer letter ✓ Due diligence
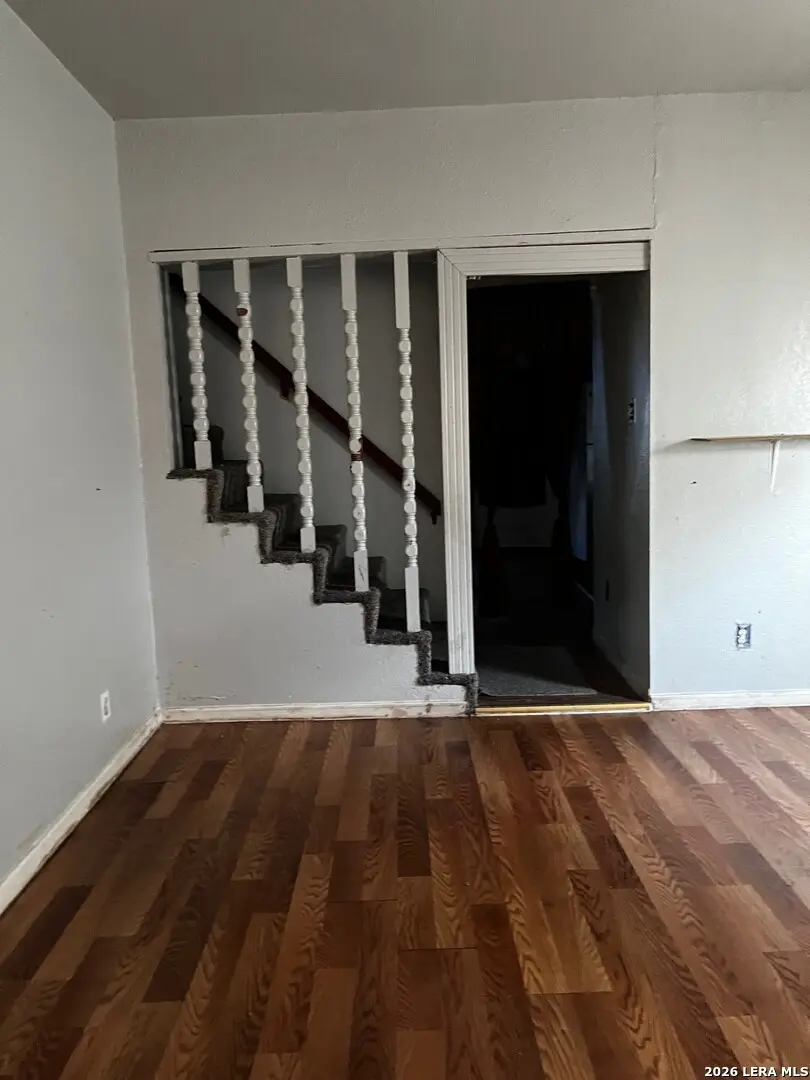
Listing remarks
Agents bring your buyers to this house. In need of some TLC. Good size yard. Fully fenced. Has great potential.
Key facts
- Fully fenced
- Good size yard
- 0.25 acre lot
Tags
Property features AI
Finance
- Financial info: Down payment assistance resources available
- HOA & community: Located in E. Commerce Est subdivision
Exterior
- Parking: Detached parking
- Utilities: Public water; Public sewer
- Home design: Pre-owned home; Approximately 56 years old
- Construction: Composition roof
- Exterior features: Wood exterior
Interior
- Kitchen: Stove/Range; Kitchen dimensions approximately 11 x 20
- Bedrooms: Master bedroom on lower level (11 x 14); Second bedroom (15 x 18)
- Flooring: Vinyl flooring
- Bathrooms: Two full bathrooms; Master bath with tub/shower combination and single vanity (7 x 7)
- Heating & cooling: Electric heat; Two window air conditioning units
- Interior features: Eat-in kitchen; Loft; Laundry located in kitchen; Stove/Range
- Laundry & utility: Laundry in kitchen
Neighborhood map
What this means for you Summary
Snapshot
- This is a 2-bed/2.0-bath land listed at $165k.
Deal economics
- At list price, monthly cash flow is $151 ($2k/yr) — positive.
- The deal already cash-flows at list — no discount required.
- To meet the 1% rule (rent ≥ 1% of price), the offer needs to be $164k (0.7% below list).
- Recommended offer: $160k (3.0% below list) — sets the bar for market timing.
- Cap rate 7.4% vs local median 3.8% in San Antonio — top-decile yield for the area; either an underpriced asset or a hidden risk that comps aren't pricing in. Stress-test before assuming the spread holds.
Location & tenants
- Location reads 80/100 on livability (#31 in TX, #1,616 nationally) — a professional / high-income tenant draw. Strengths: amenities A+, commute A+, cost of living A+; Watch: crime F.
- Judson ISD (suburban): math 21% / reading 33% proficiency, ranked #660 of 826 in TX (top 80%) — low school quality limits family demand, transient renter base, plan for 1-2y turnover.
- Zoned schools: James L Masters (math 17% / reading 32%, grade F, #3,052 of 4,322 statewide, top 74%, 802 students, 66% FRL); Henry Metzger Middle (math 12% / reading 20%, grade F, #1,543 of 1,662 statewide, top 94%, 953 students, 90% FRL); Karen Wagner H S (math 12% / reading 29%, grade F, #1,389 of 1,632 statewide, top 86%, 2,366 students, 80% FRL) — zoned schools average 79% FRL vs 57% district-wide (22 pts higher); higher-poverty schools than district average — tighter screening recommended.
- Market conditions: Rents soft (-1.1%/yr); 1207 active listings in the ZIP; 40 comparable units currently listed for rent nearby; rentals leasing fast (median 13d on market — plan ~1-2 weeks tenant-placement turnaround); solid renter incomes; 8,308 units permitted in Bexar County in 2024 (2,506 in 5+ unit buildings).
Forward outlook
- Local home prices are declining (-3.0%/yr); year-one equity from $1k of loan paydown is wiped out by about $5k of value loss. Plan a longer hold.
- Bexar County population projected at +50% by 2050 — long-run rental-demand tailwind backs the buy-and-hold thesis.
Negotiation context
- It's been on market 31 days — a 3% lower offer ($160k) is reasonable based on typical stale-listing flexibility.
- 3 sale attempts since 15y ago with the ask held roughly flat each time — persistent listings suggest the price (not the market) is what's stuck; bring a comps-based counter.
Risks & watch-outs
- Climate carrying-cost: severe wind risk, 80% chance of damaging wind over 30y; extreme-heat days projected 7→21/yr by 2055 (HVAC capex compounding) — expect insurance premiums to compound above CPI over the hold.
Questions for the listing agent
- It's been on market 31 days. Have you received any prior offers? Is the seller open to a 3% concession, seller financing, or rate buy-down credit?
- Built in 1970 — when were the roof, HVAC, electrical panel, plumbing, and water heater last replaced?
- Is there a deadline driving the sale (1031 exchange, divorce, estate, relocation)? That informs how much negotiation room exists.
- Crime grade is F in this area — have there been break-ins, vandalism, or insurance claims at this property in the last 3 years? What carrier currently insures it and at what premium?
- The area grade is low — what's the realistic commute time and amenity access for the typical tenant pool here? Any planned neighborhood developments (good or bad) we should know about?
- What's the average days-on-market for RENTAL listings here right now (not sales)? A rising rental-DOM trend means longer vacancies and softer asking-rent achievability than the comps imply.
- What's the recent tenant-quality profile in this submarket — average credit score on applications, eviction rate, late-payment / NSF rate, and stable-employment percentage? A property-management company in the area should have these aggregated.
- How much new for-sale + rental construction is in the pipeline within 1–3 miles? Heavy new supply typically softens prices + rents 12–24 months out; constrained supply supports both.
Investment metrics
- 1% rule
- 0.99% ✗
- Cap rate
- 7.39%
- Cash-on-cash
- 3.93%
- DSCR
- 1.18
- GRM
- 8.4
CMA / ARV
No comps found within radius.
Projected returns pro-forma
-3.0% appreciation · 0.0% rent growth · sell at horizon
- IRR
- -13.6%
- Equity multiple
- 0.53×
- Total profit
- $-21,863
- Equity at exit
- $24,602
- IRR
- -10.3%
- Equity multiple
- 0.46×
- Total profit
- $-25,058
- Equity at exit
- $14,266
Cash invested: $46,200 (down + closing). Projections, not guarantees.
Landlord ↔ Tenant lean methodology
- Overall (STATE)
- 87 Strongly Landlord-Friendly
- State Texas
- 87 Strongly Landlord-Friendly · R+5
- County
- — inherits STATE
- City
- — inherits STATE
ZIP-level market 78109
- Home prices YoY
- -17.8%
- Rents YoY
- -1.1%
- Active inventory
- 1207
- Price-to-rent
- 8.4×
Monthly cashflow live
- Estimated rent
- $1,638 high interval (Pro) →
- Mortgage (P&I)
- −$865
- Tax from tax record
- −$208 /mo · $2,500/yr
- Insurance
- −$69
- HOA
- −$0
- Vacancy / Maint / Mgmt
- −$344
- Net cashflow
- $151
Break-even live
Sensitivity live
| Price | -10% $245 | -5% $198 | +0% $151 | +5% $105 | +10% $58 |
|---|---|---|---|---|---|
| Rent | -10% $22 | -5% $87 | +0% $151 | +5% $216 | +10% $281 |
| Rate | -1.0pp $235 | -0.5pp $193 | base $151 | +0.5pp $109 | +1.0pp $65 |
UW: 25.0% down · 7.5% · 30yr · 1.5% tax · 5.0% vac · 8.0% maint · 8.0% mgmt
Financing live
Cash to close
- Down payment
- $41,250
- Closing costs
- $4,950
- Reserves months
- —
- Total cash needed
- —
Loan-product check · same deal, 3 products live
Conventional
25% down · 7.5% · 30yr
- Down + closing
- —
- Monthly P&I
- —
- Monthly cashflow
- —
- DSCR
- —
- Eligible?
- —
Personal DTI + credit; lowest rate.
DSCR
20% down · 8.5% · 30yr
- Down + closing
- —
- Monthly P&I
- —
- Monthly cashflow
- —
- DSCR
- —
- Eligible?
- —
No personal income docs; deal must DSCR.
Hard money
10% down · 12.0% · 12mo
- Down + closing
- —
- Monthly P&I
- —
- Monthly cashflow
- —
- DSCR
- —
- Eligible?
- —
Short-term bridge; refi at stabilization.
Rent comps 40 comps
| Address | Beds | Baths | Sqft | Rent | $/sqft | DOM | Units | Dist |
|---|---|---|---|---|---|---|---|---|
| 3023 Laguna Clfs Converse, TX | 3.0 | 2.0 | 1342 | $1,650 | $1.23 | 5d | 1 | 0.34mi |
| 2411 Woodlake Pkwy Converse, TX | 1.0–4.0 | 1.0–2.0 | 1083 | $1,150 | $1.06 | 3d | 18 | 0.59mi |
| 7163 Lunar Eclipse Converse, TX | 3.0 | 2.5 | 1935 | $2,200 | $1.14 | 12d | 1 | 0.67mi |
| 3711 Colemans Run Converse, TX | 3.0 | 2.0–2.5 | 1380 | $1,552 | $1.12 | 4d | 1 | 0.69mi |
| 3123 Saturn Path Converse, TX | 3.0 | 2.5 | 1935 | $1,975 | $1.02 | 6d | 1 | 0.77mi |
| 7528 Rose Robin Run Ct Converse, TX | 3.0 | 2.0 | 1651 | $1,575 | $0.95 | 6d | 1 | 0.79mi |
| 7022 Phoenix Path Converse, TX | 3.0 | 2.0 | 1209 | $1,750 | $1.45 | 18d | 1 | 0.79mi |
| 7516 Rose Robin Run Ct Converse, TX | 3.0 | 2.0 | 1612 | $1,599 | $0.99 | 6d | 1 | 0.80mi |
| 7111 Azure Waters Converse, TX | 3.0 | 2.0 | 1654 | $1,800 | $1.09 | 16d | 1 | 0.83mi |
| 3619 Storm Moon Converse, TX | 3.0 | 2.0 | 1620 | $1,695 | $1.05 | 45d | 1 | 0.84mi |
| 6926 Opal Clfs Converse, TX | 3.0 | 2.0 | 1274 | $1,525 | $1.20 | 6d | 1 | 0.87mi |
| 6926 Opal Clfs Converse, TX | 3.0 | 2.0 | 1274 | $1,550 | $1.22 | 19d | 1 | 0.87mi |
| 7703 Redstone Mnr Converse, TX | 3.0 | 2.0 | 1656 | $1,750 | $1.06 | 25d | 1 | 0.87mi |
| 2409 Key Hole Vw Converse, TX | 3.0 | 2.0 | 1602 | $1,600 | $1.00 | 14d | 1 | 1.05mi |
| 6941 Sunspot Converse, TX | 3.0 | 2.0 | 1355 | $1,240 | $0.92 | 14d | 1 | 1.05mi |
| 7715 Shining Glow San Antonio, TX | 3.0 | 2.5 | 1554 | $1,529 | $0.98 | 18d | 1 | 1.09mi |
| 7715 Shining Glow San Antonio, TX | 3.0 | 2.5 | 1554 | $1,499 | $0.96 | 5d | 1 | 1.09mi |
| 3814 Pickles Way Converse, TX | 3.0 | 2.0 | 1450 | $1,595 | $1.10 | 45d | 1 | 1.09mi |
| 8423 Snakeweed Dr Unit 1 Converse, TX | 3.0 | 2.0 | 1668 | $1,500 | $0.90 | 45d | 1 | 1.10mi |
| 7718 Burro Bnd San Antonio, TX | 3.0 | 2.5 | 1547 | $1,650 | $1.07 | 5d | 1 | 1.16mi |
| 8519 Snakeweed Dr Converse, TX | 3.0 | 2.0 | 1259 | $1,450 | $1.15 | 14d | 1 | 1.17mi |
| 4715 Appaloosa Run San Antonio, TX | 3.0 | 2.5 | 1774 | $1,595 | $0.90 | 18d | 1 | 1.20mi |
| 6615 Port Elizabeth Converse, TX | 3.0 | 2.0 | 1596 | $1,489 | $0.93 | 6d | 1 | 1.22mi |
| 8514 Whitebrush Converse, TX | 3.0 | 2.0 | 1535 | $1,700 | $1.11 | 25d | 1 | 1.22mi |
| 8611 Key Windy Way Unit 2 Converse, TX | 3.0 | 2.5 | 1514 | $1,850 | $1.22 | 3d | 1 | 1.24mi |
| 8611 Key Windy Way Unit 2 Converse, TX | 3.0 | 2.5 | 1514 | $1,850 | $1.22 | 45d | 1 | 1.24mi |
| 3422 Dunlap Flds Converse, TX | 3.0 | 2.0 | 1450 | $1,540 | $1.06 | 22d | 1 | 1.27mi |
| 8639 Key Windy Way Unit 1 Converse, TX | 3.0 | 2.5 | 1225 | $1,475 | $1.20 | 25d | 1 | 1.28mi |
| 8639 Key Windy Way Converse, TX | 3.0 | 2.5 | 1225 | $1,475 | $1.20 | 6d | 1 | 1.28mi |
| 8422 Cherisse Dr Converse, TX | 3.0 | 2.0 | 1436 | $1,681 | $1.17 | 0d | 1 | 1.30mi |
| 3511 Dunlap Flds Converse, TX | 3.0 | 2.0 | 1317 | $1,650 | $1.25 | 12d | 1 | 1.31mi |
| 7811 Caballo Cyn San Antonio, TX | 3.0 | 2.5 | 1547 | $1,445 | $0.93 | 0d | 1 | 1.31mi |
| 8411 Crinum Lily Dr Converse, TX | 3.0 | 2.0 | 1259 | $1,550 | $1.23 | 25d | 1 | 1.31mi |
| 6527 San Miguel Way Converse, TX | 3.0 | 2.5 | 2042 | $1,475 | $0.72 | 45d | 1 | 1.34mi |
| 6503 Davenport Bay Converse, TX | 3.0 | 2.0 | 1494 | $1,786 | $1.20 | 0d | 1 | 1.34mi |
| 6510 Poseidon Way Converse, TX | 3.0 | 2.0 | 1408 | $1,539 | $1.09 | 4d | 1 | 1.35mi |
| 7622 Mustang Mdw San Antonio, TX | 3.0 | 2.5 | 1574 | $1,500 | $0.95 | 6d | 1 | 1.35mi |
| 7923 Horse Holw San Antonio, TX | 3.0 | 2.0 | 1916 | $1,599 | $0.83 | 4d | 1 | 1.35mi |
| 5223 Fawn Lk San Antonio, TX | 3.0 | 3.0 | 1831 | $1,750 | $0.96 | 5d | 1 | 1.36mi |
| 3603 Aranda Flds Converse, TX | 3.0 | 2.0 | 1346 | $1,650 | $1.23 | 45d | 1 | 1.36mi |
Listing history 20 events
-
2026-06-21days on market $165,000 Active 31 DOM
-
2026-06-18days on market $165,000 Active 28 DOM
-
2026-06-17days on market $165,000 Active 27 DOM
-
2026-06-16days on market $165,000 Active 26 DOM
-
2026-06-15days on market $165,000 Active 25 DOM
-
2026-06-13statusdays on market $165,000 Active 23 DOM
-
2026-06-09days on market $165,000 Back on Market 19 DOM
-
2026-06-08days on market $165,000 Back on Market 18 DOM
-
2026-06-07days on market $165,000 Back on Market 17 DOM
-
2026-06-04days on market $165,000 Back on Market 14 DOM
-
2026-06-03days on market $165,000 Back on Market 13 DOM
-
2026-06-02days on market $165,000 Back on Market 12 DOM
-
2026-06-01days on market $165,000 Back on Market 11 DOM
-
2026-06-01statusdays on market $165,000 Back on Market 10 DOM
-
2026-05-07historical
-
2026-04-23$165,000 New
-
2023-05-22soldstatus
-
2020-11-09soldstatus
-
2012-05-29historical
-
2011-09-01$35,000
ⓘ Source: listings_history table (triggers on properties + properties_extension) + one-shot
backfill from property_details.listing_events for pre-trigger history.
Tax reassessment forecast TX · Resets to sale price
- Current annual tax
- $2,500 · $208/mo
- Projected year-2 tax
- $3,020 · $252/mo
- Expected delta
- +$519/yr (+$43/mo · 20.8%)
ⓘ Screening estimate from a state-policy table — verify with the county assessor before closing.
Climate risk First Street
- Flood 1/10 Low FEMA zone X (unshaded) · 0% chance over 30 yrs
- Wildfire 4/10 Moderate
- Heat 8/10 Severe 7 d/yr ≥108°F today · 21 d/yr by 30 yrs out
- Wind 8/10 Severe 80% chance of damaging wind over 30 yrs
- Air quality 1/10 Low 0 unhealthy d/yr today · 0 by 30 yrs out
Nearby sold comps map
Loading sold comps map…
Walkable amenities ~0.75 mi
Loading nearby amenities…
Taxation est. · year 1
- Rental income
- $19,653
- − Mortgage interest
- −$9,243
- − Property taxes
- −$2,500
- − Insurance
- −$825
- − Repairs & maintenance
- −$1,572
- − Management
- −$1,572
- − Depreciation
- −$4,800
- Taxable loss
- −$859
- Est. tax savings @ 24.0%
- +$206
- After-tax cash flow
- $2,024/yr
For passive investors: Depreciation is non-cash, so a rental often shows a tax loss while cash-flowing — sheltering income. Rental losses are passive: they offset passive income freely, and up to $25,000/yr can offset ordinary (W-2) income if you actively participate and your MAGI is under $100k (phasing out to $0 by $150k); unused losses carry forward. On sale, claimed depreciation is recaptured at up to 25%, and gains may owe capital-gains tax (a 1031 exchange can defer both). Figures are a year-1 estimate at your 24.0% rate — not tax advice; consult a CPA.
Schools (NCES district)
- District
- Judson ISD
- NCES district ID
- 4824990
- Math proficiency
- 21% ▼ -21.00%
- Reading proficiency
- 33% ▼ -7.00%
- Median HH income
- $57,542
- Composite
- 24.39/100
- National rank
- #7689
- State rank
- #660 of 826 in TX
Livability — San Antonio
- Score
- 80/100
- State rank
- #31
- US rank
- #1616
Category grades
Schools grade is shown separately in the Schools card above.
Census & demographics
- Census place
- San Antonio, TX
- County
- Bexar County · 1,990,555 people
- City population
- 1,806,925
- Metro
- San Antonio-New Braunfels, TX
- Population (ZIP)
- 63,067
- Household income
- $91,320
- Rent vs Own
- Severe rent burden
- 1732.0
Population outlook (Bexar County) Hauer SSP2
- Today (2025)
- 2,336,851 people
- By 2030
- 2,560,728 · +9.6%
- By 2040
- 3,020,569 · +29.3%
- By 2050
- 3,493,522 · +49.5%
- By 2075
- 4,668,459 · +99.8%
- By 2100
- 5,533,242 · +136.8%
Race, ethnicity, and origin ACS 2023
- Neighborhood character
- Diverse neighborhood (Simpson 0.69)
- Race & ethnicity
- Hispanic / Latino 44% White 27% Two or more races 21% Black 21% Asian 3%
- Hispanic origin (detail)
- Mexican 29% Puerto Rican 4%
- Common ancestry
- Lithuanian 1% Romanian 1% Italian 1%
- Foreign-born
- 11% · Canada, Vietnam, South Korea
- Languages at home
- 71% English-only · Spanish 23% Tagalog/Filipino 1% Other Asian/Pacific 1%
Political lean MEDSL · Bexar
- 2024 margin
- Lean D (+9.8) · D 54.3% · R 44.6% · Other 1.1%
- 2008→2024 swing
- +4.2pp toward D · 2008: 5.6pp · 2024: 9.8pp
- All cycles
- 2024: D+9.8 2020: D+18.2 2016: D+13.5 2012: D+4.6 2008: D+5.6
Not yet ingested
- Civics
- —
Market trends
- HPI YoY
- ▼ -51.02%
- Current HPI
- 236.4923
- Rent YoY
- ▼ -1.08%
- Metro
- San Antonio-New Braunfels, TX
- State GDP YoY
- ▲ 3.95%
- F500 in state
- 110
Industry mix (Fortune 500 HQ in TX)
| Industry | F500 HQs | Revenue |
|---|---|---|
| Energy | 16 | $1,198B |
|
||
| Technology | 5 | $198B |
|
||
| Engineering / Construction | 4 | $72B |
|
||
| Energy Services | 3 | $60B |
|
||
| Utilities | 3 | $41B |
|
||
| Healthcare | 2 | $330B |
|
||
Price history
+371.4% since first listed7 events — show timeline
- 2026-05-31 Relisted — LERA
- 2026-05-07 Listing Removed — LERA
- 2026-04-23 Listed $165,000 LERA
- 2023-05-22 Sold (Public Records) — Public Records
- 2020-11-09 Sold (Public Records) — Public Records
- 2012-05-29 Listing Removed — LERA
- 2011-09-01 Listed $35,000 LERA
Property tax history
+15.0%/yrLatest (2025): $2,500 · +3.8% YoY. Source: county tax records.
Cash-flow waterfall
monthlySold comps — $/sqft
last 12 mo · ≤1 miLoading sold comps…