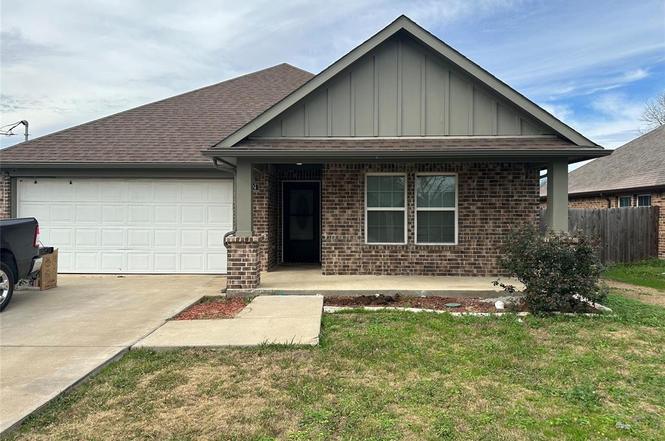
412 S Park St · Terrell, TX
Flood risk 1/10 · Minimal
- FEMA flood zone
- X (unshaded)
- Chance of flooding over 30 yrs
- 0.0%
- Est. flood insurance / yr
- $507 – $1,088
Fire risk 6/10 · Moderate
- Est. fire insurance / yr
- $1,222 – $2,270
Heat risk 7/10 · Major
- Hot days now (above 110°F)
- 7 days/yr
- Hot days in 30 yrs
- 24 days/yr
Wind risk 6/10 · Moderate
- Chance of severe wind over 30 yrs
- 27.0%
Air-quality risk 2/10 · Minimal
- Unhealthy air days now
- 1 days/yr
- Unhealthy air days in 30 yrs
- 1 days/yr
Risk factors via First Street. Map © Google.
Why this score? — see what drove the D+ grade
The composite is a weighted blend of 9 inputs, each scored 0–100. Each bar is that input's sub-score; the figure is the points it added to the 100-point composite (weight × sub-score).
- Cash flow +13.7/30.0
- ARV discount +12.9/15.0
- DSCR +4.2/10.0
- 1% rule +3.8/10.0
- Livability +3.4/5.0
- Rent growth +2.5/5.0
- Condition / age +2.5/5.0
- Schools +2.4/10.0
- Appreciation +0.0/10.0
$210,000
🖨 Deal sheet (PDF) 📄 Offer letter ✓ Due diligence
Listing remarks
Welcome to Terrell, Texas. .. This home is minutes away from Dallas but offers small town living. Property features an open floor plan with master located in the rear of home with the other two bedroom in the front. The kitchen and living area offers a warm and inviting area for cooking and entertaining your family or guest. The breakfast area overlooks the oversized fenced backyard. You don't get this much land in the city for this price. Buyer and Buyer Agent to verify all measurements. This is a preforeclosure that HAS NOT yet been approved by the seller's lender. All offers will be submitted to the lender on February 26, 2026 for an approval.
Key facts
- Open floor plan
- 0.34 acre lot
- 2 garage spots
Tags
Neighborhood map
What this means for you Summary
Snapshot
- This is a 3-bed/2.0-bath single-family listed at $210k.
Deal economics
- At list price, monthly cash flow is $17 ($198/yr) — positive.
- The deal already cash-flows at list — no discount required.
- To meet the 1% rule (rent ≥ 1% of price), the offer needs to be $186k (11.5% below list).
- Recommended offer: $186k (11.5% below list) — sets the bar for 1% rule.
- Cap rate 6.4% vs local median 3.8% in Terrell — top-decile yield for the area; either an underpriced asset or a hidden risk that comps aren't pricing in. Stress-test before assuming the spread holds.
Location & tenants
- Location reads 67/100 on livability (#520 in TX) — a middle-class / working-renter tenant base. Strengths: cost of living A+, housing A+; Watch: amenities C-, employment D, commute F.
- Terrell ISD (town): math 25% / reading 30% proficiency, ranked #677 of 826 in TX (top 82%) — low school quality limits family demand, transient renter base, plan for 1-2y turnover; 68% free/reduced lunch — lower-income household profile, screen leases tightly.
- Zoned schools: Gilbert Willie Sr El (math 23% / reading 21%, grade F, #3,333 of 4,322 statewide, top 80%, 701 students, 72% FRL); Herman Furlough Jr Middle (math 28% / reading 28%, grade F, #1,143 of 1,662 statewide, top 69%, 1,168 students, 64% FRL); Terrell H S (math 24% / reading 38%, grade F, #1,077 of 1,632 statewide, top 66%, 1,466 students, 56% FRL) — zoned schools at 64% FRL track the district average.
- Market conditions: 375 active listings in the ZIP; 16 comparable units currently listed for rent nearby; rentals lingering (median 46d on market — plan ~5-8 weeks vacancy on turnover, expect pricing pressure); 50% of comp listings sitting > 30 days — soft ceiling on asking rent; 1,747 units permitted in Kaufman County in 2024 (180 in 5+ unit buildings).
- This rent runs 31% of the median local income ($72k/yr) — at the standard rent-burdened threshold; future hikes will face affordability resistance.
Forward outlook
- Local home prices are declining (-3.0%/yr); year-one equity from $1k of loan paydown is wiped out by about $6k of value loss. Plan a longer hold.
- Kaufman County population projected at +43% by 2050 — long-run rental-demand tailwind backs the buy-and-hold thesis.
Negotiation context
- It's been on market 84 days — a 6% lower offer ($197k) is reasonable based on typical stale-listing flexibility.
- 4 sale attempts since 4y ago; this cycle's ask has dropped $82k (28%) from the opening price — seller is motivated, your offer sets the floor, not the list.
Risks & watch-outs
- Climate carrying-cost: major wind risk, 27% chance of damaging wind over 30y; major wildfire risk; extreme-heat days projected 7→24/yr by 2055 (HVAC capex compounding) — expect insurance premiums to compound above CPI over the hold.
Questions for the listing agent
- It's been on market 84 days. Have you received any prior offers? Is the seller open to a 12% concession, seller financing, or rate buy-down credit?
- Why hasn't it sold? Are there any deal-killer items the seller is aware of (foundation, flood, title, zoning, code violations)?
- Is there a deadline driving the sale (1031 exchange, divorce, estate, relocation)? That informs how much negotiation room exists.
- Schools are F-rated, which usually means shorter tenancies and higher turnover. Who's the typical renter profile here, and what's been the actual vacancy rate?
- The area grade is low — what's the realistic commute time and amenity access for the typical tenant pool here? Any planned neighborhood developments (good or bad) we should know about?
- What's the average days-on-market for RENTAL listings here right now (not sales)? A rising rental-DOM trend means longer vacancies and softer asking-rent achievability than the comps imply.
- What's the recent tenant-quality profile in this submarket — average credit score on applications, eviction rate, late-payment / NSF rate, and stable-employment percentage? A property-management company in the area should have these aggregated.
- How much new for-sale + rental construction is in the pipeline within 1–3 miles? Heavy new supply typically softens prices + rents 12–24 months out; constrained supply supports both.
Investment metrics
- 1% rule
- 0.88% ✗
- Cap rate
- 6.39%
- Cash-on-cash
- 0.34%
- DSCR
- 1.02
- GRM
- 9.4
CMA / ARV
- ARV (on-the-fly)
- $238,874
- Comps found
- 12
Show comp detail 12 sales within ~0.75 mi
| Address | Dist | Beds/Ba | Sqft | Sold | Price | $/sf | Match |
|---|---|---|---|---|---|---|---|
| 412 S Park St | 0.00mi | 3/2.0 | 1,439 (0%) | 1mo | $210,000 | $146 | 99 |
| 509 Bethlehem St | 0.26mi | 3/2.0 | 1,450 (+1%) | 2mo | $120,000 | $83 | 85 |
| 914 S Frances St | 0.24mi | 3/2.0 | 1,418 (-2%) | 6mo | $314,999 | $222 | 82 |
| 404 Bethlehem St | 0.31mi | 3/2.0 | 1,425 (-1%) | 9mo | $250,000 | $175 | 76 |
| 1108 S Medora St | 0.19mi | 4/2.5 (+1) | 1,537 (+7%) | 6mo | $255,000 | $166 | 68 |
| 701 Rose Hill Rd | 0.27mi | 3/2.0 | 1,344 (-7%) | 13mo | $175,000 | $130 | 66 |
| 212 Mineral Wells St | 0.49mi | 3/2.0 | 1,358 (-6%) | 7mo | $225,000 | $166 | 62 |
| 414 Roosevelt Ave | 0.53mi | 3/2.0 | 1,407 (-2%) | 13mo | $255,000 | $181 | 60 |
| 121 Mitchell Cir | 0.71mi | 3/2.0 | 1,480 (+3%) | 4mo | $215,000 | $145 | 59 |
| 805 S Catherine St | 0.39mi | 3/2.0 | 1,270 (-12%) | 12mo | $200,000 | $157 | 52 |
| 603 S Ann St | 0.40mi | 3/2.0 | 1,624 (+13%) | 12mo | $299,990 | $185 | 50 |
| 1412 S Medora St | 0.62mi | 3/2.0 | 1,254 (-13%) | 6mo | $250,000 | $199 | 44 |
Match score weights: distance 35% · size 25% · config 20% · recency 20%. Top-matched comps best support the ARV.
Projected returns pro-forma
-3.0% appreciation · 3.0% rent growth · sell at horizon
- IRR
- -15.8%
- Equity multiple
- 0.44×
- Total profit
- $-32,948
- Equity at exit
- $31,312
- IRR
- -7.3%
- Equity multiple
- 0.54×
- Total profit
- $-27,221
- Equity at exit
- $18,157
Cash invested: $58,800 (down + closing). Projections, not guarantees.
Landlord ↔ Tenant lean methodology
- Overall (STATE)
- 87 Strongly Landlord-Friendly
- State Texas
- 87 Strongly Landlord-Friendly · R+5
- County
- — inherits STATE
- City
- — inherits STATE
ZIP-level market 75160
- Home prices YoY
- -13.2%
- Active inventory
- 375
- Price-to-rent
- 9.4×
Monthly cashflow live
- Estimated rent
- $1,858 high interval (Pro) →
- Mortgage (P&I)
- −$1,101
- Tax est. 1.5%
- −$262 /mo · $3,150/yr
- Insurance
- −$88
- HOA
- −$0
- Vacancy / Maint / Mgmt
- −$390
- Net cashflow
- $17
Break-even live
Sensitivity live
| Price | -10% $162 | -5% $89 | +0% $17 | +5% $-56 | +10% $-129 |
|---|---|---|---|---|---|
| Rent | -10% $-130 | -5% $-57 | +0% $17 | +5% $90 | +10% $163 |
| Rate | -1.0pp $122 | -0.5pp $70 | base $17 | +0.5pp $-38 | +1.0pp $-93 |
UW: 25.0% down · 7.5% · 30yr · 1.5% tax · 5.0% vac · 8.0% maint · 8.0% mgmt
Financing live
Cash to close
- Down payment
- $52,500
- Closing costs
- $6,300
- Reserves months
- —
- Total cash needed
- —
Loan-product check · same deal, 3 products live
Conventional
25% down · 7.5% · 30yr
- Down + closing
- —
- Monthly P&I
- —
- Monthly cashflow
- —
- DSCR
- —
- Eligible?
- —
Personal DTI + credit; lowest rate.
DSCR
20% down · 8.5% · 30yr
- Down + closing
- —
- Monthly P&I
- —
- Monthly cashflow
- —
- DSCR
- —
- Eligible?
- —
No personal income docs; deal must DSCR.
Hard money
10% down · 12.0% · 12mo
- Down + closing
- —
- Monthly P&I
- —
- Monthly cashflow
- —
- DSCR
- —
- Eligible?
- —
Short-term bridge; refi at stabilization.
Rent comps 16 comps
| Address | Beds | Baths | Sqft | Rent | $/sqft | DOM | Units | Dist |
|---|---|---|---|---|---|---|---|---|
| 1210 S Frances St Terrell, TX | 3.0 | 2.0 | 1204 | $1,700 | $1.41 | 45d | 1 | 0.36mi |
| 1300 S Adelaide St Terrell, TX | 1.0–4.0 | 1.0–2.0 | 785 | $1,413 | $1.80 | 0d | 9 | 0.47mi |
| 111 Kennedy Dr Terrell, TX | 3.0 | 2.0 | 1348 | $1,750 | $1.30 | 45d | 1 | 0.65mi |
| 111 Kennedy Dr Terrell, TX | 3.0 | 2.0 | 1348 | $1,750 | $1.30 | 24d | 1 | 0.65mi |
| 1001 Mineral Wells St Terrell, TX | 2.0–3.0 | 1.0 | 1018 | $1,299 | $1.28 | 0d | 3 | 0.67mi |
| 113 Destiny Ct Terrell, TX | 3.0 | 2.0 | 1460 | $2,000 | $1.37 | 26d | 1 | 0.90mi |
| 303 N Delphine St Terrell, TX | 3.0 | 2.0 | 1526 | $1,950 | $1.28 | 45d | 1 | 0.97mi |
| 113 Brookline Dr Terrell, TX | 4.0 | 2.0 | 1584 | $1,975 | $1.25 | 26d | 1 | 1.01mi |
| 203 E Brin St Terrell, TX | 2.0 | 2.0 | 1472 | $1,500 | $1.02 | 19d | 1 | 1.04mi |
| 226 Still Glen Dr Terrell, TX | 3.0 | 2.0 | 1400 | $1,900 | $1.36 | 26d | 1 | 1.05mi |
| 221 Woodlands Blvd Terrell, TX | 3.0 | 2.0 | 1460 | $1,950 | $1.34 | 45d | 1 | 1.12mi |
| 231 Woodlands Blvd Terrell, TX | 4.0 | 2.0 | 1629 | $2,000 | $1.23 | 26d | 1 | 1.13mi |
| 507 Campbell St Terrell, TX | 3.0 | 2.0 | 1268 | $1,950 | $1.54 | 46d | 1 | 1.13mi |
| 230 Woodlands Blvd Terrell, TX | 3.0 | 2.0 | 1400 | $1,950 | $1.39 | 45d | 1 | 1.15mi |
| 236 Woodlands Blvd Terrell, TX | 3.0 | 2.0 | 1460 | $1,949 | $1.33 | 45d | 1 | 1.16mi |
| 105 Capewood Dr Terrell, TX | 3.0 | 2.0 | 1460 | $1,950 | $1.34 | 45d | 1 | 1.19mi |
Listing history 13 events
-
2026-04-10status Pending
-
2026-03-31historical Active Option Contract
-
2026-02-19price $210,000
-
2026-01-15$292,000 Active
-
2025-09-09price $298,000
-
2025-07-08$300,000 Active
-
2023-05-01price $299,800
-
2023-03-09$315,000 Active
-
2022-07-25soldstatus Closed
-
2022-06-27status Pending
-
2022-06-16historical Active Option Contract
-
2022-06-13price $300,000
-
2022-05-27$325,000 Active
ⓘ Source: listings_history table (triggers on properties + properties_extension) + one-shot
backfill from property_details.listing_events for pre-trigger history.
Climate risk First Street
- Flood 1/10 Low FEMA zone X (unshaded) · 0% chance over 30 yrs
- Wildfire 6/10 Major
- Heat 7/10 Severe 7 d/yr ≥110°F today · 24 d/yr by 30 yrs out
- Wind 6/10 Major 27% chance of damaging wind over 30 yrs
- Air quality 2/10 Low 1 unhealthy d/yr today · 1 by 30 yrs out
Nearby sold comps map
Loading sold comps map…
Walkable amenities ~0.75 mi
Loading nearby amenities…
Taxation est. · year 1
- Rental income
- $22,296
- − Mortgage interest
- −$11,763
- − Property taxes
- −$3,150
- − Insurance
- −$1,050
- − Repairs & maintenance
- −$1,784
- − Management
- −$1,784
- − Depreciation
- −$6,109
- Taxable loss
- −$3,344
- Est. tax savings @ 24.0%
- +$803
- After-tax cash flow
- $1,001/yr
For passive investors: Depreciation is non-cash, so a rental often shows a tax loss while cash-flowing — sheltering income. Rental losses are passive: they offset passive income freely, and up to $25,000/yr can offset ordinary (W-2) income if you actively participate and your MAGI is under $100k (phasing out to $0 by $150k); unused losses carry forward. On sale, claimed depreciation is recaptured at up to 25%, and gains may owe capital-gains tax (a 1031 exchange can defer both). Figures are a year-1 estimate at your 24.0% rate — not tax advice; consult a CPA.
Schools (NCES district)
- District
- Terrell ISD
- NCES district ID
- 4842450
- Math proficiency
- 25% ▼ -14.00%
- Reading proficiency
- 30% ▼ -5.00%
- Median HH income
- $44,265
- Composite
- 23.57/100
- National rank
- #7855
- State rank
- #677 of 826 in TX
Livability — Terrell
- Score
- 67/100
- State rank
- #520
- US rank
- #10213
Category grades
Schools grade is shown separately in the Schools card above.
Census & demographics
- Census place
- Terrell, TX
- County
- Kaufman County · 122,338 people
- City population
- 28,206
- Metro
- Dallas-Fort Worth-Arlington, TX
- Population (ZIP)
- 28,206
- Household income
- $71,801
- Rent vs Own
- Severe rent burden
- 845.0
Population outlook (Kaufman County) Hauer SSP2
- Today (2025)
- 138,716 people
- By 2030
- 150,815 · +8.7%
- By 2040
- 174,877 · +26.1%
- By 2050
- 198,020 · +42.8%
- By 2075
- 251,908 · +81.6%
- By 2100
- 285,325 · +105.7%
Race, ethnicity, and origin ACS 2023
- Neighborhood character
- Diverse neighborhood (Simpson 0.64)
- Race & ethnicity
- White 46% Hispanic / Latino 33% Two or more races 19% Black 18%
- Hispanic origin (detail)
- Mexican 30%
- Common ancestry
- Lithuanian 2% Slovak 1% Portuguese 1%
- Foreign-born
- 11% · Canada
- Languages at home
- 75% English-only · Spanish 24% Russian/Polish/Slavic 1%
Political lean MEDSL · Kaufman
- 2024 margin
- Strong R (+27.9) · D 35.6% · R 63.5%
- 2008→2024 swing
- +7.9pp toward D · 2008: -35.8pp · 2024: -27.9pp
- All cycles
- 2024: R+27.9 2020: R+33.9 2016: R+47.0 2012: R+44.4 2008: R+35.8
Not yet ingested
- Civics
- —
Market trends
- HPI YoY
- ▼ -42.39%
- Current HPI
- 278.507
- Rent YoY
- —
- Metro
- Dallas-Fort Worth-Arlington, TX
- State GDP YoY
- ▲ 3.95%
- F500 in state
- 110
Industry mix (Fortune 500 HQ in TX)
| Industry | F500 HQs | Revenue |
|---|---|---|
| Energy | 16 | $1,198B |
|
||
| Technology | 5 | $198B |
|
||
| Engineering / Construction | 4 | $72B |
|
||
| Energy Services | 3 | $60B |
|
||
| Utilities | 3 | $41B |
|
||
| Healthcare | 2 | $330B |
|
||
Price history
-35.4% since first listed13 events — show timeline
- 2026-04-10 Pending — NTREIS
- 2026-03-31 Contingent — NTREIS
- 2026-02-19 Price Changed $210,000 NTREIS
- 2026-01-15 Listed $292,000 NTREIS
- 2025-09-09 Price Changed $298,000 NTREIS
- 2025-07-08 Listed $300,000 NTREIS
- 2023-05-01 Price Changed $299,800 NTREIS
- 2023-03-09 Listed $315,000 NTREIS
- 2022-07-25 Sold (MLS) — NTREIS
- 2022-06-27 Pending — NTREIS
- 2022-06-16 Contingent — NTREIS
- 2022-06-13 Price Changed $300,000 NTREIS
- 2022-05-27 Listed $325,000 NTREIS
Cash-flow waterfall
monthlySold comps — $/sqft
last 12 mo · ≤1 miLoading sold comps…