 Multi-family
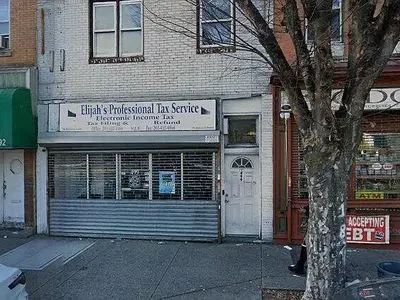
499 M.L.K. Dr · Jersey City, NJ
Flood risk No data
- FEMA flood zone
- —
- Chance of flooding over 30 yrs
- —
- Est. flood insurance / yr
- —
Fire risk No data
- Est. fire insurance / yr
- —
Heat risk No data
- Hot days now (above threshold)
- —
- Hot days in 30 yrs
- —
Wind risk No data
- Chance of severe wind over 30 yrs
- —
Air-quality risk No data
- Unhealthy air days now
- —
- Unhealthy air days in 30 yrs
- —
Risk factors via First Street. Map © Google.
Why this score? — see what drove the D- grade
The composite is a weighted blend of 9 inputs, each scored 0–100. Each bar is that input's sub-score; the figure is the points it added to the 100-point composite (weight × sub-score).
- Cash flow +12.8/30.0
- ARV discount +7.5/15.0
- Livability +3.9/5.0
- DSCR +3.8/10.0
- 1% rule +3.6/10.0
- Rent growth +3.3/5.0
- Schools +2.4/10.0
- Condition / age +1.0/5.0
- Appreciation +0.0/10.0
$650,000
🖨 Deal sheet (PDF) 📄 Offer letter ✓ Due diligence
Multi-family units
County records classify this as Multi-Family (2-4 Unit). Listing-text estimate: 1 unit. estimate disagrees with records
Listing remarks
ActiveCommercial Coldwell Banker logo 9 Photos Map & amp; Location Street View This is a carousel with tiles that activate property listing cards. Use the previous and next buttons to navigate. 1/9 Don& apos; t miss this incredible investment opportunity in an up-and-coming neighborhood with great transit access. This mixed-use property features two residential units-each with 3 bedrooms and 1 bathroom-plus a street-level commercial storefront, ideal for retail, or office, . A full basement and backyard add even more potential. Located just a short walk to the Light Rail and major bus lines, this property offers convenience and visibility. While it needs significant renovations,
Key facts
- Great transit access
- Backyard
- Full basement
Tags
Property features AI
Exterior
- Home design: Built in 1990
- Exterior features: Located in the Bergen-Lafayette neighborhood
Neighborhood map
What this means for you Summary
Snapshot
- This is a 4-bed/3.0-bath multifamily listed at $650k. Condition is rated poor.
Deal economics
- At list price, monthly cash flow is $-56 ($-674/yr) — negative.
- To cash-flow at today's rent, offer at most $642k (1.3% below list).
- To meet the 1% rule (rent ≥ 1% of price), the offer needs to be $562k (13.6% below list).
- Recommended offer: $562k (13.6% below list) — sets the bar for 1% rule.
- Cap rate 6.2% vs local median 1.8% in Jersey City — top-decile yield for the area; either an underpriced asset or a hidden risk that comps aren't pricing in. Stress-test before assuming the spread holds.
Location & tenants
- Location reads 77/100 on livability (#116 in NJ, #2,955 nationally) — a middle-class / working-renter tenant base. Strengths: amenities A+, commute A+, employment A+; Watch: crime F, cost of living F.
- Jersey City Public Schools (urban): math 16% / reading 38% proficiency, ranked #369 of 472 in NJ (top 78%) — low school quality limits family demand, transient renter base, plan for 1-2y turnover; 69% free/reduced lunch — lower-income household profile, screen leases tightly.
- Zoned schools: Ollie Culbreth Jr. School (math 3% / reading 17%, grade F, #1,225 of 1,303 statewide, top 95%, 422 students, 67% FRL); Academy I (math 60% / reading 76%, grade A-, #14 of 431 statewide, top 3%, 403 students, 46% FRL); Lincoln High School (math 4% / reading 25%, grade F, #389 of 399 statewide, top 98%, 942 students, 62% FRL).
- Market conditions: Rents rising (+3.3%/yr); 206 active listings in the ZIP; 40 comparable units currently listed for rent nearby; rentals at typical pace (median 27d on market — plan ~3-4 weeks tenant-placement turnaround); 5,310 units permitted in Hudson County in 2024 (4,154 in 5+ unit buildings).
- At $5,615/mo this rent would consume 95% of the median local household income ($71k/yr) (locally 3598% of renters already pay >50% of income on rent) — very limited rent-growth headroom before tenants either downsize or default.
Forward outlook
- Local home prices are declining (-3.0%/yr); year-one equity from $4k of loan paydown is wiped out by about $20k of value loss. Plan a longer hold.
- Hudson County population projected at +29% by 2050 — long-run rental-demand tailwind backs the buy-and-hold thesis.
Negotiation context
- It's been on market 26 days — a 2% lower offer ($640k) is reasonable based on typical stale-listing flexibility.
- 2 sale attempts since 4y ago with the ask held roughly flat each time — persistent listings suggest the price (not the market) is what's stuck; bring a comps-based counter.
Questions for the listing agent
- What do current leases actually rent for vs. the listed asking? Can we see a recent rent roll and the last 12 months of T-12 income?
- Have any recent inspections been done? Can we get a copy of the seller's disclosures and any deferred-maintenance estimates?
- Is there a deadline driving the sale (1031 exchange, divorce, estate, relocation)? That informs how much negotiation room exists.
- Schools are B-rated — typically a magnet for longer-tenancy family renters. What's the average tenant stay here, and is there a school-zone premium baked into asking?
- Crime grade is F in this area — have there been break-ins, vandalism, or insurance claims at this property in the last 3 years? What carrier currently insures it and at what premium?
- The area grade is low — what's the realistic commute time and amenity access for the typical tenant pool here? Any planned neighborhood developments (good or bad) we should know about?
- What's the average days-on-market for RENTAL listings here right now (not sales)? A rising rental-DOM trend means longer vacancies and softer asking-rent achievability than the comps imply.
- What's the recent tenant-quality profile in this submarket — average credit score on applications, eviction rate, late-payment / NSF rate, and stable-employment percentage? A property-management company in the area should have these aggregated.
- How much new apartment / multifamily construction is in the pipeline within 1–3 miles? Heavy new supply (>2% of stock underway) typically softens rents 12–24 months out; light construction supports rent growth.
Investment metrics
- 1% rule
- 0.86% ✗
- Cap rate
- 6.19%
- Cash-on-cash
- -0.37%
- DSCR
- 0.98
- GRM
- 9.6
CMA / ARV
No comps found within radius.
Show comp detail 12 sales within ~0.75 mi
| Address | Dist | Beds/Ba | Sqft | Sold | Price | $/sf | Match |
|---|---|---|---|---|---|---|---|
| 14 MONTICELLO Ave | 0.08mi | 5/4.0 (+1) | — | 5mo | $873,000 | — | 71 |
| 85 UNION St | 0.18mi | 3/2.5 (-1) | — | 3mo | $800,000 | — | 70 |
| 167 CLINTON Ave | 0.27mi | 5/2.0 (+1) | — | 1mo | $600,000 | — | 65 |
| 241 RANDOLPH Ave | 0.34mi | 5/2.0 (+1) | — | 3mo | $600,000 | — | 60 |
| 25 JEWETT Ave | 0.53mi | 4/3.5 | — | 1mo | $899,000 | — | 60 |
| 103 Claremont Ave | 0.49mi | 4/2.0 | — | 4mo | $305,000 | — | 57 |
| 129 CLERK St | 0.45mi | 5/2.0 (+1) | — | 5mo | $575,000 | — | 53 |
| 338 BRAMHALL Ave | 0.63mi | 4/2.0 | — | 1mo | $563,000 | — | 53 |
| 32 STORMS Ave | 0.62mi | 5/3.0 (+1) | — | 1mo | $618,000 | — | 53 |
| 107 RANDOLPH Ave | 0.51mi | 5/2.0 (+1) | — | 3mo | $650,000 | — | 52 |
| 191 BOYD Ave | 0.68mi | 5/3.0 (+1) | — | 3mo | $675,000 | — | 48 |
| 247 PACIFIC Ave | 0.65mi | 5/2.0 (+1) | — | 2mo | $715,000 | — | 46 |
Match score weights: distance 35% · size 25% · config 20% · recency 20%. Top-matched comps best support the ARV.
Projected returns pro-forma
-3.0% appreciation · 3.32% rent growth · sell at horizon
- IRR
- -16.5%
- Equity multiple
- 0.41×
- Total profit
- $-107,006
- Equity at exit
- $96,917
- IRR
- -7.7%
- Equity multiple
- 0.51×
- Total profit
- $-89,949
- Equity at exit
- $56,200
Cash invested: $182,000 (down + closing). Projections, not guarantees.
Landlord ↔ Tenant lean methodology
- Overall (CITY)
- 6 Strongly Tenant-Friendly
- State New Jersey
- 21 Tenant-Leaning · D+6
- County
- — inherits STATE
- City Jersey City
- 6 Strongly Tenant-Friendly · D+34
ZIP-level market 07304
- Home prices YoY
- -34.5%
- Rents YoY
- 3.3%
- Active inventory
- 206
- Price-to-rent
- 19.3×
Monthly cashflow live
- Estimated rent
- $5,615 high interval (Pro) →
- Mortgage (P&I)
- −$3,409
- Tax est. 1.5%
- −$812 /mo · $9,750/yr
- Insurance
- −$271
- HOA
- −$0
- Vacancy / Maint / Mgmt
- −$1,179
- Net cashflow
- $-56
Break-even live
Sensitivity live
| Price | -10% $393 | -5% $168 | +0% $-56 | +5% $-281 | +10% $-505 |
|---|---|---|---|---|---|
| Rent | -10% $-500 | -5% $-278 | +0% $-56 | +5% $166 | +10% $387 |
| Rate | -1.0pp $271 | -0.5pp $109 | base $-56 | +0.5pp $-225 | +1.0pp $-396 |
2-unit breakdown (identical units grouped — click to expand)
| Units | Beds | Baths | Est. rent |
|---|---|---|---|
| 2× units | 3 | 1 | $5,616 |
| #1 | 3 | 1 | $2,808 |
| #2 | 3 | 1 | $2,808 |
| Total (2 units) | $5,615 | ||
UW: 25.0% down · 7.5% · 30yr · 1.5% tax · 5.0% vac · 8.0% maint · 8.0% mgmt
Financing live
Cash to close
- Down payment
- $162,500
- Closing costs
- $19,500
- Reserves months
- —
- Total cash needed
- —
Loan-product check · same deal, 3 products live
Conventional
25% down · 7.5% · 30yr
- Down + closing
- —
- Monthly P&I
- —
- Monthly cashflow
- —
- DSCR
- —
- Eligible?
- —
Personal DTI + credit; lowest rate.
DSCR
20% down · 8.5% · 30yr
- Down + closing
- —
- Monthly P&I
- —
- Monthly cashflow
- —
- DSCR
- —
- Eligible?
- —
No personal income docs; deal must DSCR.
Hard money
10% down · 12.0% · 12mo
- Down + closing
- —
- Monthly P&I
- —
- Monthly cashflow
- —
- DSCR
- —
- Eligible?
- —
Short-term bridge; refi at stabilization.
Rent comps 40 comps
| Address | Beds | Baths | Sqft | Rent | $/sqft | DOM | Units | Dist |
|---|---|---|---|---|---|---|---|---|
| 66 Atlantic St #1 Jersey City, NJ | 3.0 | 1.0 | — | $2,500 | — | 26d | 1 | 0.06mi |
| 148 Union St Unit 1/2 Jersey City, NJ | 3.0 | 2.0 | 1466 | $3,800 | $2.59 | 4d | 1 | 0.08mi |
| 533 Martin Luther King Dr Unit A Jersey City, NJ | 3.0 | 2.0 | 1300 | $4,100 | $3.15 | 9d | 1 | 0.08mi |
| 62 Oak St Unit 2 Jersey City, NJ | 3.0 | 2.5 | — | $3,200 | — | 1d | 1 | 0.12mi |
| 765 Ocean Ave Unit 1 Jersey City, NJ | 3.0 | 2.5 | — | $3,200 | — | 26d | 1 | 0.19mi |
| 291 Forrest St Unit 1 Jersey City, NJ | 3.0 | 2.0 | 1600 | $2,800 | $1.75 | 26d | 1 | 0.19mi |
| 114 Oak St Unit 3 Jersey City, NJ | 3.0 | 2.0 | 1100 | $3,100 | $2.82 | 26d | 1 | 0.21mi |
| 114 Oak St Unit 1 Jersey City, NJ | 3.0 | 2.0 | 1100 | $3,100 | $2.82 | 26d | 1 | 0.21mi |
| 103 Virginia Ave Unit 2 Jersey City, NJ | 3.0 | 1.0 | — | $2,800 | — | 3d | 1 | 0.26mi |
| 3 Minerva St Jersey City, NJ | 3.0 | 2.5 | — | $3,500 | — | 26d | 1 | 0.27mi |
| 145 Harrison Ave #301 Jersey City, NJ | 3.0 | 1.0 | — | $2,100 | — | 0d | 1 | 0.28mi |
| 35 Lexington Ave Unit 2 Jersey City, NJ | 3.0 | 1.0 | — | $2,700 | — | 5d | 1 | 0.28mi |
| 18 Boyd Ave Unit 2 Jersey City, NJ | 3.0 | 1.0 | — | $2,500 | — | 4d | 1 | 0.29mi |
| 38 Clendenny Ave Unit 1R Jersey City, NJ | 3.0 | 1.0 | 1000 | $2,500 | $2.50 | 26d | 1 | 0.29mi |
| 202 Clerk St Unit 2 Jersey City, NJ | 4.0 | 1.0 | — | $3,000 | — | 26d | 1 | 0.32mi |
| 13 Union St Unit 2 Jersey City, NJ | 3.0 | 2.0 | 1500 | $2,600 | $1.73 | 26d | 1 | 0.33mi |
| 10 McDougall St Unit A Jersey City, NJ | 4.0 | 1.0 | — | $2,800 | — | 26d | 1 | 0.33mi |
| 708 Ocean Ave Jersey City, NJ | 4.0 | 2.0 | — | $3,550 | — | 26d | 1 | 0.33mi |
| 187 Clerk St Jersey City, NJ | 4.0 | 1.0 | — | $2,450 | — | 26d | 1 | 0.33mi |
| 187 Clerk St #2 Jersey City, NJ | 3.0 | 1.0 | — | $2,350 | — | 18d | 1 | 0.33mi |
| 290 Randolph Ave Unit 2 Jersey City, NJ | 3.0 | 1.0 | — | $3,000 | — | 26d | 1 | 0.34mi |
| 294 Randolph Ave Unit 2 Jersey City, NJ | 3.0 | 2.0 | — | $2,750 | — | 26d | 1 | 0.34mi |
| 312 Randolph Ave Unit 1 Jersey City, NJ | 3.0 | 2.0 | 1350 | $2,750 | $2.04 | 26d | 1 | 0.35mi |
| 65 Clendenny Ave Unit 1st floor Jersey City, NJ | 3.0 | 2.0 | — | $2,375 | — | 26d | 1 | 0.35mi |
| 85 Kearney Ave Unit 3 Jersey City, NJ | 3.0 | 1.0 | — | $2,350 | — | 26d | 1 | 0.36mi |
| 85 Kearney Ave Unit 3 Jersey City, NJ | 3.0 | 1.0 | — | $2,350 | — | 8d | 1 | 0.36mi |
| 81 Crescent Ave Unit 1470338P Jersey City, NJ | 3.0 | 2.0 | 1797 | $7,265 | $4.04 | 9d | 1 | 0.37mi |
| 41 Bentley Ave #1 Jersey City, NJ | 3.0 | 3.5 | 2165 | $5,500 | $2.54 | 14d | 1 | 0.37mi |
| 203 Harrison Ave #33 Jersey City, NJ | 3.0 | 1.0 | 796 | $2,350 | $2.95 | 4d | 1 | 0.38mi |
| 166 Carteret Ave Unit 1 Jersey City, NJ | 4.0 | 1.0 | 1100 | $2,700 | $2.45 | 26d | 1 | 0.38mi |
| 5 Kearney Ave Unit 5 Jersey City, NJ | 3.0 | 1.0 | 1300 | $2,700 | $2.08 | 26d | 1 | 0.39mi |
| 215 Harrison Ave Unit 1 Jersey City, NJ | 3.0 | 2.0 | — | $3,200 | — | 3d | 1 | 0.39mi |
| 37 Astor Pl Unit 1 Jersey City, NJ | 3.0 | 2.0 | 1300 | $3,600 | $2.77 | 7d | 1 | 0.40mi |
| 37 Astor Pl Unit 1 Jersey City, NJ | 3.0 | 2.0 | 1300 | $3,150 | $2.42 | 4d | 1 | 0.40mi |
| 37 Astor Pl Unit 1 Jersey City, NJ | 3.0 | 2.0 | — | $3,150 | — | 21d | 1 | 0.40mi |
| 37 Astor Pl Unit 2 Jersey City, NJ | 3.0 | 2.0 | — | $3,200 | — | 21d | 1 | 0.40mi |
| 37 Astor Pl Unit 2 Jersey City, NJ | 3.0 | 2.0 | — | $3,600 | — | 23d | 1 | 0.40mi |
| 37 Astor Pl Unit 2 Jersey City, NJ | 3.0 | 2.0 | 1300 | $3,600 | $2.77 | 4d | 1 | 0.40mi |
| 223 Harrison Ave #2 Jersey City, NJ | 3.0 | 1.0 | — | $2,400 | — | 26d | 1 | 0.41mi |
| 49 Belmont Ave #1 Jersey City, NJ | 3.0 | 3.0 | 1500 | $3,800 | $2.53 | 26d | 1 | 0.41mi |
Listing history 18 events
-
2026-06-21days on market $650,000 Active 26 DOM
-
2026-06-18days on market $650,000 Active 23 DOM
-
2026-06-17days on market $650,000 Active 22 DOM
-
2026-06-16days on market $650,000 Active 21 DOM
-
2026-06-15days on market $650,000 Active 20 DOM
-
2026-06-13days on market $650,000 Active 18 DOM
-
2026-06-13days on market $650,000 Active 17 DOM
-
2026-06-09days on market $650,000 Active 14 DOM
-
2026-06-08days on market $650,000 Active 13 DOM
-
2026-06-07days on market $650,000 Active 12 DOM
-
2026-06-04days on market $650,000 Active 9 DOM
-
2026-06-03days on market $650,000 Active 8 DOM
-
2026-06-02days on market $650,000 Active 7 DOM
-
2026-06-01days on market $650,000 Active 6 DOM
-
2026-05-31days on market $650,000 Active 5 DOM
-
2026-05-26$650,000 Active
-
2023-06-15historical
-
2022-06-15$750,000 Active
ⓘ Source: listings_history table (triggers on properties + properties_extension) + one-shot
backfill from property_details.listing_events for pre-trigger history.
Nearby sold comps map
Loading sold comps map…
Walkable amenities ~0.75 mi
Loading nearby amenities…
Taxation est. · year 1
- Rental income
- $67,380
- − Mortgage interest
- −$36,410
- − Property taxes
- −$9,750
- − Insurance
- −$3,250
- − Repairs & maintenance
- −$5,390
- − Management
- −$5,390
- − Depreciation
- −$18,909
- Taxable loss
- −$11,720
- Est. tax savings @ 24.0%
- +$2,813
- After-tax cash flow
- $2,139/yr
For passive investors: Depreciation is non-cash, so a rental often shows a tax loss while cash-flowing — sheltering income. Rental losses are passive: they offset passive income freely, and up to $25,000/yr can offset ordinary (W-2) income if you actively participate and your MAGI is under $100k (phasing out to $0 by $150k); unused losses carry forward. On sale, claimed depreciation is recaptured at up to 25%, and gains may owe capital-gains tax (a 1031 exchange can defer both). Figures are a year-1 estimate at your 24.0% rate — not tax advice; consult a CPA.
Condition & rehab AI · 1 photo
This property requires extensive exterior and interior renovations to become move-in ready and increase its value.
Repairs flagged
- Major exterior siding — Severe weathering and peeling
- Major exterior paint — Significant peeling and discoloration
- Major interior walls — No photos, but likely in poor condition
Value-add opportunities
- Both exterior siding and paint — Enhances curb appeal and property value
- Both interior updates — Improves living conditions and rental appeal
Renovation cost estimate screening
| Repair item | Severity | Est. cost |
|---|---|---|
| exterior siding · Severe weathering and peeling | Major | $15,000–50,000 |
| exterior paint · Significant peeling and discoloration | Major | $15,000–50,000 |
| interior walls · No photos, but likely in poor condition | Major | $15,000–50,000 |
| Total estimated repair cost · 3 items | $45,000–150,000 |
Value-add ROI direction
- Both exterior siding and paint — Enhances curb appeal and property value ↑
- Both interior updates — Improves living conditions and rental appeal ↑
ⓘ Cost ranges are severity-bucket heuristics (US national rule-of-thumb). Get contractor quotes + a written scope before underwriting a rehab budget.
Schools (NCES district)
- District
- Jersey City Public Schools
- NCES district ID
- 3407830
- Math proficiency
- 16% ▼ -17.00%
- Reading proficiency
- 38% ▼ -11.00%
- Median HH income
- $58,431
- Composite
- 24.43/100
- National rank
- #7678
- State rank
- #369 of 472 in NJ
Livability — Jersey City
- Score
- 77/100
- State rank
- #116
- US rank
- #2955
Category grades
Schools grade is shown separately in the Schools card above.
Census & demographics
- Census place
- Jersey City, NJ
- County
- Hudson County · 718,323 people
- City population
- 294,078
- Metro
- New York-Newark-Jersey City, NY-NJ-PA
- Population (ZIP)
- 51,306
- Household income
- $70,986
- Rent vs Own
- Severe rent burden
- 3598.0
Population outlook (Hudson County) Hauer SSP2
- Today (2025)
- 771,834 people
- By 2030
- 818,028 · +6.0%
- By 2040
- 907,866 · +17.6%
- By 2050
- 994,480 · +28.8%
- By 2075
- 1,163,301 · +50.7%
- By 2100
- 1,254,703 · +62.6%
Race, ethnicity, and origin ACS 2023
- Neighborhood character
- Highly diverse neighborhood (Simpson 0.75)
- Race & ethnicity
- Black 33% Hispanic / Latino 28% White 20% Two or more races 15% Asian 14%
- Hispanic origin (detail)
- Mexican 2% Puerto Rican 9% Dominican 10%
- Common ancestry
- Scotch-Irish 1% Hispanic 1% Romanian 1%
- Foreign-born
- 36% · Canada, Vietnam, China
- Languages at home
- 52% English-only · Spanish 22% Arabic 8% Tagalog/Filipino 5%
Political lean MEDSL · Hudson
- 2024 margin
- Strong D (+28.1) · D 62.6% · R 34.6% · Other 2.8%
- 2008→2024 swing
- -18.7pp toward R · 2008: 46.7pp · 2024: 28.1pp
- All cycles
- 2024: D+28.1 2020: D+46.2 2016: D+51.8 2012: D+55.7 2008: D+46.7
Not yet ingested
- Civics
- —
Market trends
- HPI YoY
- ▼ -212.51%
- Current HPI
- 402.9557
- Rent YoY
- ▲ 3.32%
- Metro
- New York-Newark-Jersey City, NY-NJ-PA
- State GDP YoY
- ▲ 2.05%
- F500 in state
- 34
Industry mix (Fortune 500 HQ in NJ)
| Industry | F500 HQs | Revenue |
|---|---|---|
| Consumer Goods | 3 | $31B |
|
||
| Pharmaceuticals | 2 | $153B |
|
||
| Technology | 2 | $21B |
|
||
| Insurance | 2 | $20B |
|
||
| Healthcare | 2 | $19B |
|
||
| Financial Services | 1 | $70B |
|
||
Price history
-13.3% since first listed3 events — show timeline
- 2026-05-26 Listed $650,000 FSBO.com
- 2023-06-15 Delisted — NJMLS
- 2022-06-15 Listed $750,000 NJMLS
Cash-flow waterfall
monthlySold comps — $/sqft
last 12 mo · ≤1 miLoading sold comps…