 24-Plex
1570 James St · Woodburn, OR
Flood risk 1/10 · Minimal
- FEMA flood zone
- X (unshaded)
- Chance of flooding over 30 yrs
- 0.0%
- Est. flood insurance / yr
- $507 – $1,088
Fire risk 4/10 · Minor
- Est. fire insurance / yr
- $498 – $926
Heat risk 3/10 · Minor
- Hot days now (above 91°F)
- 7 days/yr
- Hot days in 30 yrs
- 14 days/yr
Wind risk 1/10 · Minimal
- Chance of severe wind over 30 yrs
- —
Air-quality risk 10/10 · Severe
- Unhealthy air days now
- 14 days/yr
- Unhealthy air days in 30 yrs
- 14 days/yr
Risk factors via First Street. Map © Google.
Why this score? — see what drove the D grade
The composite is a weighted blend of 9 inputs, each scored 0–100. Each bar is that input's sub-score; the figure is the points it added to the 100-point composite (weight × sub-score).
- Cash flow +15.2/30.0
- ARV discount +7.5/15.0
- DSCR +4.7/10.0
- Livability +3.7/5.0
- 1% rule +3.2/10.0
- Rent growth +3.2/5.0
- Schools +2.5/10.0
- Condition / age +2.5/5.0
- Appreciation +0.0/10.0
$4,850,000
🖨 Deal sheet 📄 Offer letter ✓ Due diligence
Multi-family units
County records classify this as Multi-Family (5+ Unit). Listing-text estimate: 24 units. confirmed
5+ unit building — per-unit beds/baths from public records are typically unavailable; the breakdown below (if shown) is an estimate from the listing text.
Listing remarks MLS
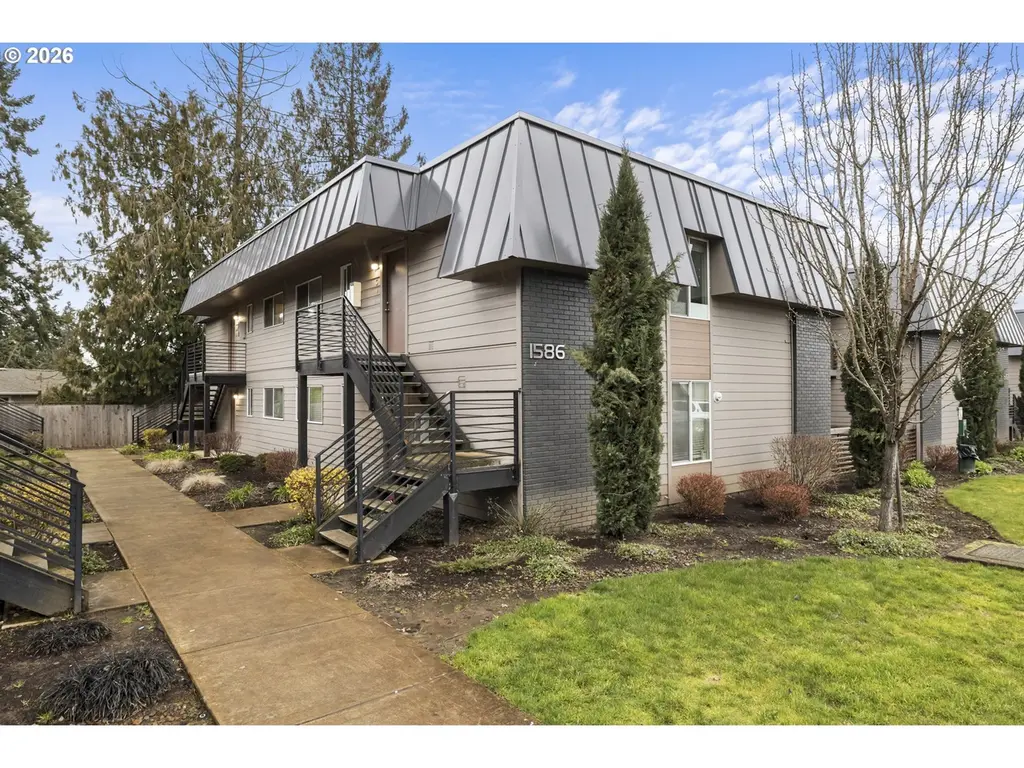
Atlas Realty Advisors is pleased to present the Willamette Pointe Apartments. Located in Woodburn OR, this 24-unit community has been fully renovated and has experienced a stable resident base throughout ownership. All units are large 900SF 2bed 1.5bath floor-plans. Residents enjoy their community garden, play structure and ample parking.
Key facts
- Two story buildings
- Updated interiors
- Roofing
Tags
Property features AI
Finance
- Other: Zoning: RM
- Financial info: 24 total units; Typical unit actual rent around $1,737; Unit type area approximately 931 (unit-level); Cap rate 6.43; Gross rent multiplier 10.12; Rent includes grounds maintenance and trash collection
Exterior
- Utilities: Public water; Public sewer; Electric service
- Home design: Multi-family property; Not attached; Built in 1970
- Construction: Shingles not specified
- Exterior features: Cement siding; Lap siding; Level lot
Interior
- Kitchen: Dishwasher; Range
- Bedrooms: Units with 2 bedrooms
- Bathrooms: Units with 2 bathrooms
- Heating & cooling: Wall heater; Window air conditioning units; Electric hot water
- Interior features: Updated/remodeled condition; Deck
- Laundry & utility: Washer/Dryer hookup
Neighborhood map
What this means for you Summary
Snapshot
- This is a 24 × 2-bed/1.5-bath units multifamily listed at $4.85M.
Deal economics
- At list price, monthly cash flow is $2k ($20k/yr) — positive. Per door: $71/mo.
- The deal already cash-flows at list — no discount required.
- To meet the 1% rule (rent ≥ 1% of price), the offer needs to be $3.99M (17.8% below list).
- Recommended offer: $3.99M (17.8% below list) — sets the bar for 1% rule.
- Cap rate 6.7% vs local median 3.1% in Woodburn — top-decile yield for the area; either an underpriced asset or a hidden risk that comps aren't pricing in. Stress-test before assuming the spread holds.
Location & tenants
- Location reads 74/100 on livability (#91 in OR, #4,490 nationally) — a middle-class / working-renter tenant base. Strengths: housing A+, health & safety A+, cost of living B; Watch: crime D+, commute D, amenities F.
- Woodburn SD 103 (town): math 20% / reading 31% proficiency, ranked #169 of 183 in OR (top 92%) — low school quality limits family demand, transient renter base, plan for 1-2y turnover; 71% free/reduced lunch — lower-income household profile, screen leases tightly.
- Zoned schools: Washington Elementary School (438 students, 50% FRL); French Prairie Middle School (587 students, 72% FRL); Woodburn Success (79 students, 68% FRL).
- Market conditions: Rents rising (+2.9%/yr); 306 active listings in the ZIP; 1,591 units permitted in Marion County in 2024 (716 in 5+ unit buildings).
- At $39,868/mo this rent would consume 674% of the median local household income ($71k/yr) (locally 1039% of renters already pay >50% of income on rent) — very limited rent-growth headroom before tenants either downsize or default.
Forward outlook
- Local home prices are declining (-3.0%/yr); year-one equity from $34k of loan paydown is wiped out by about $146k of value loss. Plan a longer hold.
- Marion County population projected at +17% by 2050 — long-run rental-demand tailwind backs the buy-and-hold thesis.
Negotiation context
- Only 13 days on market — expect competitive offers; lowballing is unlikely to land.
- 8 sale attempts since 3y ago with the ask held roughly flat each time — persistent listings suggest the price (not the market) is what's stuck; bring a comps-based counter.
Questions for the listing agent
- Can we see the unit-by-unit rent roll, current vacancy, and any below-market leases? What's the average tenancy length?
- What capital expenditures (roof, boiler, parking lot, exteriors) have been made in the last 5 years, and what's planned in the next 2?
- Built in 1970 — when were the roof, HVAC, electrical panel, plumbing, and water heater last replaced?
- Is there a deadline driving the sale (1031 exchange, divorce, estate, relocation)? That informs how much negotiation room exists.
- Schools are D-rated, which usually means shorter tenancies and higher turnover. Who's the typical renter profile here, and what's been the actual vacancy rate?
- Crime grade is D in this area — have there been break-ins, vandalism, or insurance claims at this property in the last 3 years? What carrier currently insures it and at what premium?
- The area grade is low — what's the realistic commute time and amenity access for the typical tenant pool here? Any planned neighborhood developments (good or bad) we should know about?
- What's the average days-on-market for RENTAL listings here right now (not sales)? A rising rental-DOM trend means longer vacancies and softer asking-rent achievability than the comps imply.
- What's the recent tenant-quality profile in this submarket — average credit score on applications, eviction rate, late-payment / NSF rate, and stable-employment percentage? A property-management company in the area should have these aggregated.
- How much new apartment / multifamily construction is in the pipeline within 1–3 miles? Heavy new supply (>2% of stock underway) typically softens rents 12–24 months out; light construction supports rent growth.
Investment metrics
- 1% rule
- 0.82% ✗
- Cap rate
- 6.71%
- Cash-on-cash
- 1.50%
- DSCR
- 1.07
- GRM
- 10.1
CMA / ARV
No comps found within radius.
Projected returns pro-forma
-3.0% appreciation · 2.94% rent growth · sell at horizon
- IRR
- -14.0%
- Equity multiple
- 0.50×
- Total profit
- $-681,901
- Equity at exit
- $723,151
- IRR
- -5.4%
- Equity multiple
- 0.65×
- Total profit
- $-471,295
- Equity at exit
- $419,339
Cash invested: $1,358,000 (down + closing). Projections, not guarantees.
Landlord ↔ Tenant lean methodology
- Overall (STATE)
- 28 Tenant-Leaning
- State Oregon
- 28 Tenant-Leaning · D+6
- County
- — inherits STATE
- City
- — inherits STATE
ZIP-level market 97071
- Rents YoY
- 2.9%
- Active inventory
- 306
- Price-to-rent
- 243.3×
Monthly cashflow live
- Estimated rent
- $39,868 high interval (Pro) →
- Mortgage (P&I)
- −$25,434
- Tax from tax record
- −$2,344 /mo · $28,125/yr
- Insurance
- −$2,021
- HOA
- −$0
- Vacancy / Maint / Mgmt
- −$8,372
- Net cashflow
- $1,697
Break-even live
24-unit breakdown (identical units grouped — click to expand)
| Units | Beds | Baths | Est. rent |
|---|---|---|---|
| 24× units | 2 | 1.5 | $39,864 |
| #1 | 2 | 1.5 | $1,661 |
| #2 | 2 | 1.5 | $1,661 |
| #3 | 2 | 1.5 | $1,661 |
| #4 | 2 | 1.5 | $1,661 |
| #5 | 2 | 1.5 | $1,661 |
| #6 | 2 | 1.5 | $1,661 |
| #7 | 2 | 1.5 | $1,661 |
| #8 | 2 | 1.5 | $1,661 |
| #9 | 2 | 1.5 | $1,661 |
| #10 | 2 | 1.5 | $1,661 |
| #11 | 2 | 1.5 | $1,661 |
| #12 | 2 | 1.5 | $1,661 |
| #13 | 2 | 1.5 | $1,661 |
| #14 | 2 | 1.5 | $1,661 |
| #15 | 2 | 1.5 | $1,661 |
| #16 | 2 | 1.5 | $1,661 |
| #17 | 2 | 1.5 | $1,661 |
| #18 | 2 | 1.5 | $1,661 |
| #19 | 2 | 1.5 | $1,661 |
| #20 | 2 | 1.5 | $1,661 |
| #21 | 2 | 1.5 | $1,661 |
| #22 | 2 | 1.5 | $1,661 |
| #23 | 2 | 1.5 | $1,661 |
| #24 | 2 | 1.5 | $1,661 |
| Total (24 units) | $39,868 | ||
UW: 25.0% down · 7.5% · 30yr · 1.5% tax · 5.0% vac · 8.0% maint · 8.0% mgmt
Financing live
Cash to close
- Down payment
- $1,212,500
- Closing costs
- $145,500
- Reserves months
- —
- Total cash needed
- —
Loan-product check · same deal, 3 products live
Conventional
25% down · 7.5% · 30yr
- Down + closing
- —
- Monthly P&I
- —
- Monthly cashflow
- —
- DSCR
- —
- Eligible?
- —
Personal DTI + credit; lowest rate.
DSCR
20% down · 8.5% · 30yr
- Down + closing
- —
- Monthly P&I
- —
- Monthly cashflow
- —
- DSCR
- —
- Eligible?
- —
No personal income docs; deal must DSCR.
Hard money
10% down · 12.0% · 12mo
- Down + closing
- —
- Monthly P&I
- —
- Monthly cashflow
- —
- DSCR
- —
- Eligible?
- —
Short-term bridge; refi at stabilization.
Listing history 10 events
-
2026-06-18days on market $4,850,000 Active 13 DOM
-
2026-06-17days on market $4,850,000 Active 12 DOM
-
2026-06-16days on market $4,850,000 Active 11 DOM
-
2026-06-15days on market $4,850,000 Active 10 DOM
-
2026-06-14days on market $4,850,000 Active 8 DOM
-
2026-06-10days on market $4,850,000 Active 5 DOM
-
2026-06-09days on market $4,850,000 Active 4 DOM
-
2026-06-08days on market $4,850,000 Active 3 DOM
-
2026-06-07remarks 681-char remark
-
2026-06-07$4,850,000 Active 2 DOM
ⓘ Source: listings_history table (triggers on properties + properties_extension) + one-shot
backfill from property_details.listing_events for pre-trigger history.
Tax reassessment forecast OR · Resets to sale price
- Current annual tax
- $28,125 · $2,344/mo
- Projected year-2 tax
- $47,045 · $3,920/mo
- Expected delta
- +$18,920/yr (+$1,577/mo · 67.3%)
ⓘ Screening estimate from a state-policy table — verify with the county assessor before closing.
Climate risk First Street
- Flood 1/10 Low FEMA zone X (unshaded) · 0% chance over 30 yrs
- Wildfire 4/10 Moderate
- Heat 3/10 Moderate 7 d/yr ≥91°F today · 14 d/yr by 30 yrs out
- Wind 1/10 Low
- Air quality 10/10 Extreme 14 unhealthy d/yr today · 14 by 30 yrs out
Nearby sold comps map
Loading sold comps map…
Walkable amenities ~0.75 mi
Loading nearby amenities…
Taxation est. · year 1
- Rental income
- $478,416
- − Mortgage interest
- −$271,675
- − Property taxes
- −$28,125
- − Insurance
- −$24,250
- − Repairs & maintenance
- −$38,273
- − Management
- −$38,273
- − Depreciation
- −$141,091
- Taxable loss
- −$63,272
- Est. tax savings @ 24.0%
- +$15,185
- After-tax cash flow
- $35,552/yr
For passive investors: Depreciation is non-cash, so a rental often shows a tax loss while cash-flowing — sheltering income. Rental losses are passive: they offset passive income freely, and up to $25,000/yr can offset ordinary (W-2) income if you actively participate and your MAGI is under $100k (phasing out to $0 by $150k); unused losses carry forward. On sale, claimed depreciation is recaptured at up to 25%, and gains may owe capital-gains tax (a 1031 exchange can defer both). Figures are a year-1 estimate at your 24.0% rate — not tax advice; consult a CPA.
Schools (NCES district)
- District
- Woodburn SD 103
- NCES district ID
- 4113530
- Math proficiency
- 20% ▬ 0.00%
- Reading proficiency
- 31% ▼ -1.00%
- Median HH income
- $44,033
- Composite
- 24.9/100
- National rank
- #12993
- State rank
- #169 of 183 in OR
Livability — Woodburn
- Score
- 74/100
- State rank
- #91
- US rank
- #4490
Category grades
Schools grade is shown separately in the Schools card above.
Census & demographics
- Census place
- Woodburn, OR
- County
- Marion County · 258,219 people
- City population
- 33,123
- Metro
- Salem, OR
- Population (ZIP)
- 33,123
- Household income
- $70,938
- Rent vs Own
- Severe rent burden
- 1039.0
Population outlook (Marion County) Hauer SSP2
- Today (2025)
- 360,940 people
- By 2030
- 375,178 · +3.9%
- By 2040
- 400,914 · +11.1%
- By 2050
- 422,187 · +17.0%
- By 2075
- 460,305 · +27.5%
- By 2100
- 464,025 · +28.6%
Race, ethnicity, and origin ACS 2023
- Neighborhood character
- Majority Hispanic (61%)
- Race & ethnicity
- Hispanic / Latino 61% White 34% Two or more races 22% Native American 2% Asian 1%
- Hispanic origin (detail)
- Mexican 51%
- Common ancestry
- Scotch-Irish 2% Lithuanian 2% Romanian 2%
- Foreign-born
- 30% · Canada, China
- Languages at home
- 43% English-only · Spanish 53% Russian/Polish/Slavic 2%
Political lean MEDSL · Marion
- 2024 margin
- Toss-up / Even · D 47.5% · R 49.5% · Other 3.0%
- 2008→2024 swing
- -4.2pp toward R · 2008: 2.2pp · 2024: -2.0pp
- All cycles
- 2024: R+2.0 2020: D+1.1 2016: R+5.0 2012: R+3.5 2008: D+2.2
Not yet ingested
- Civics
- —
Market trends
- HPI YoY
- ▼ -353.43%
- Current HPI
- 297.3113
- Rent YoY
- ▲ 2.94%
- Metro
- Salem, OR
- State GDP YoY
- ▲ 2.05%
- F500 in state
- 2
Industry mix (Fortune 500 HQ in OR)
| Industry | F500 HQs | Revenue |
|---|---|---|
| Consumer Goods | 1 | $51B |
|
||
Price history
+246.4% since first listed19 events — show timeline
- 2026-06-05 Listed $4,850,000 RMLS
- 2025-06-14 Rental Removed $1,575 APPFOLIO
- 2025-06-12 Listed for Rent $1,575 APPFOLIO
- 2024-10-18 Rental Removed $1,550 APPFOLIO
- 2024-10-10 Listed for Rent $1,550 APPFOLIO
- 2024-07-14 Rental Removed $1,525 APPFOLIO
- 2024-06-28 Listed for Rent $1,525 APPFOLIO
- 2024-06-05 Rental Removed $1,525 APPFOLIO
- 2024-04-10 Listed for Rent $1,525 APPFOLIO
- 2024-04-10 Rental Removed $1,525 APPFOLIO
- 2024-04-06 Listed for Rent $1,525 APPFOLIO
- 2024-03-27 Rental Removed $1,595 APPFOLIO
- 2024-03-13 Listed for Rent $1,595 APPFOLIO
- 2023-09-28 Sold (MLS) $4,400,000 RMLS
- 2023-07-19 Pending — RMLS
- 2023-07-10 Price Changed $4,600,000 RMLS
- 2023-05-26 Listed $4,870,000 RMLS
- 2022-04-01 Price Changed $1,495 RENT.
- 2017-09-14 Sold (Public Records) $1,400,000 Public Records
Property tax history
+5.5%/yrLatest (2025): $28,125 · +2.1% YoY. Source: county tax records.
Cash-flow waterfall
monthlySold comps — $/sqft
last 12 mo · ≤1 miLoading sold comps…