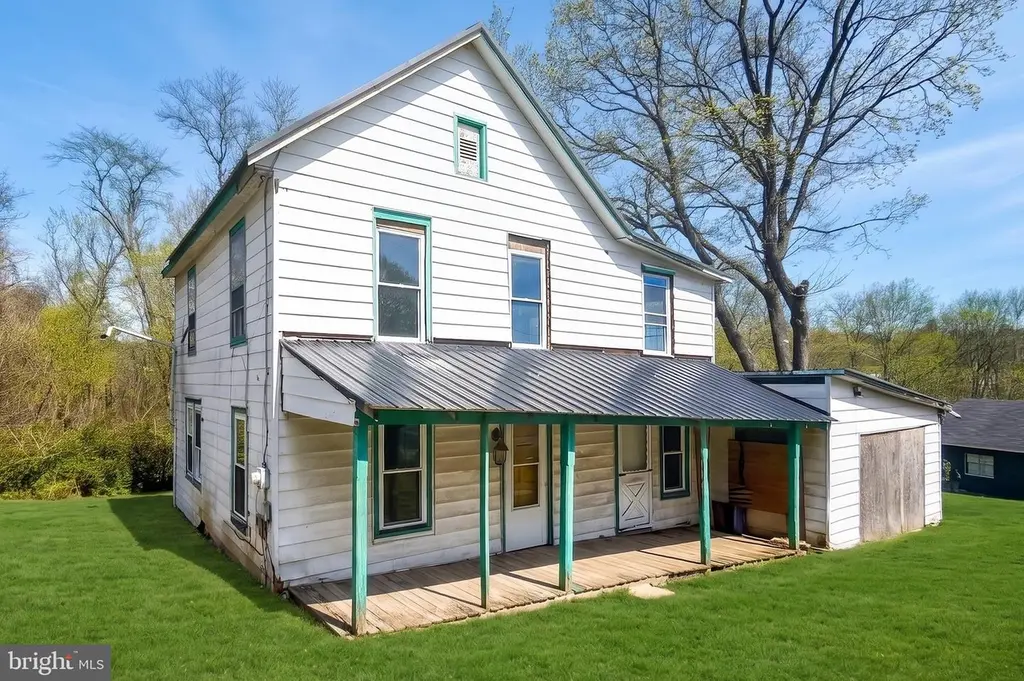
584 Aspers Bendersville Rd · Aspers, PA
Flood risk 9/10 · Severe
- FEMA flood zone
- X (unshaded)
- Chance of flooding over 30 yrs
- 0.99%
- Est. flood insurance / yr
- $507 – $1,088
Fire risk 2/10 · Minimal
- Est. fire insurance / yr
- $511 – $949
Heat risk 5/10 · Moderate
- Hot days now (above 100°F)
- 7 days/yr
- Hot days in 30 yrs
- 15 days/yr
Wind risk 3/10 · Minor
- Chance of severe wind over 30 yrs
- 5.0%
Air-quality risk 2/10 · Minimal
- Unhealthy air days now
- 1 days/yr
- Unhealthy air days in 30 yrs
- 2 days/yr
Risk factors via First Street. Map © Google.
Why this score? — see what drove the B+ grade
The composite is a weighted blend of 9 inputs, each scored 0–100. Each bar is that input's sub-score; the figure is the points it added to the 100-point composite (weight × sub-score).
- Cash flow +30.0/30.0
- DSCR +10.0/10.0
- Appreciation +10.0/10.0
- 1% rule +9.4/10.0
- ARV discount +7.5/15.0
- Schools +3.7/10.0
- Livability +3.6/5.0
- Rent growth +2.5/5.0
- Condition / age +2.5/5.0
$149,900
🖨 Deal sheet (PDF) 📄 Offer letter ✓ Due diligence
Listing remarks MLS
1.20 Acre parcel with pubic sewer. Property features a 3 bedroom farmhouse ready to be restored. Land boarders the Opossum creek.
Key facts
- Public sewer
- 1.2 acres
- Flexible layout
Tags
Property features AI
Finance
- Other:
- Financial info: Fee simple ownership; Property described as needing major rehab
- HOA & community:
Exterior
- Parking: Two off-street parking spaces (total of 2 garage/parking spaces)
- Security:
- Utilities: Well water; Public sewer; Electric and phone available; Cable TV available; Municipal trash not provided
- Home design: Detached property; Two levels; Main entrance faces south
- Construction: Aluminum siding; Stone foundation; Metal roof; Building not winterized; Pets allowed (cats and dogs)
- Exterior features: Backs to trees; Partly wooded lot with rear yard and sloping terrain; Road frontage and side yards; Has a water view; Not in a development
Interior
- Kitchen:
- Bedrooms: Three bedrooms on the main level
- Flooring: Rough-in flooring
- Bathrooms: Two full bathrooms (both on the main level)
- Heating & cooling: Natural gas heating
- Interior features: Full basement (approximately half the footprint) in need of major rehab; Living area and other size data per assessor
- Laundry & utility:
Neighborhood map
What this means for you Summary
Snapshot
- This is a 3-bed/1.5-bath other listed at $150k.
Deal economics
- At list price, monthly cash flow is $511 ($6k/yr) — positive.
- The deal already cash-flows at list — no discount required.
- Meets the 1% rule at list price ($2k rent vs $150k).
- Recommended offer: $145k (3.0% below list) — sets the bar for market timing.
Location & tenants
- Location reads 72/100 on livability (#598 in PA) — a middle-class / working-renter tenant base. Strengths: employment A+, cost of living A+, housing A+; Watch: amenities F, commute F.
- Upper Adams SD (rural): math 33% / reading 52% proficiency, ranked #298 of 539 in PA (top 55%) — families likely to look elsewhere, expect single-tenant / working-renter base with shorter leases.
- Zoned schools: Biglerville El Sch (math 47% / reading 57%, grade C-, #586 of 1,518 statewide, top 42%, 435 students, 51% FRL); Upper Adams Ms (math 17% / reading 48%, grade F, #355 of 512 statewide, top 70%, 271 students, 48% FRL); Biglerville Hs (math 62% / reading 24%, grade F, #215 of 437 statewide, top 50%, 529 students, 39% FRL).
- Market conditions: 13 active listings in the ZIP; 403 units permitted in Adams County in 2024 (0 in 5+ unit buildings).
Forward outlook
- In year one you build about $16k of equity ($1k loan paydown + $15k appreciation (10.0% local appreciation)).
- Adams County population projected at -10% by 2050 — secular population decline; favor cash flow + early exit over multi-decade hold.
- At projected returns (10.0% appreciation + 3.0% rent growth), your $42k cash investment doubles in ~2 years — after that, you're playing with house money.
- By year 3, paydown + projected appreciation supports a ~$41k cash-out refi (75% LTV) — recoverable capital for the next deal without selling this one.
Negotiation context
- It's been on market 60 days — a 3% lower offer ($145k) is reasonable based on typical stale-listing flexibility.
- 2 sale attempts since 2y ago with the ask held roughly flat each time — persistent listings suggest the price (not the market) is what's stuck; bring a comps-based counter.
- Current owner paid $71k; list at $150k implies a 111% gain — meaningful room to come down on a strong offer.
Risks & watch-outs
- Watch-outs: flood insurance adds $66/mo; built in 1800 — expect roof / HVAC / electrical / plumbing capex.
- Climate carrying-cost: severe flood risk; extreme-heat days projected 7→15/yr by 2055 (HVAC capex compounding) — expect insurance premiums to compound above CPI over the hold.
Questions for the listing agent
- It's been on market 60 days. Have you received any prior offers? Is the seller open to a 3% concession, seller financing, or rate buy-down credit?
- Built in 1800 — when were the roof, HVAC, electrical panel, plumbing, and water heater last replaced?
- What's the actual annual flood-insurance premium (NFIP or private), and is the property in a SFHA with mandatory coverage?
- Is there a deadline driving the sale (1031 exchange, divorce, estate, relocation)? That informs how much negotiation room exists.
- Schools are D-rated, which usually means shorter tenancies and higher turnover. Who's the typical renter profile here, and what's been the actual vacancy rate?
- What's the average days-on-market for RENTAL listings here right now (not sales)? A rising rental-DOM trend means longer vacancies and softer asking-rent achievability than the comps imply.
- What's the recent tenant-quality profile in this submarket — average credit score on applications, eviction rate, late-payment / NSF rate, and stable-employment percentage? A property-management company in the area should have these aggregated.
- How much new for-sale + rental construction is in the pipeline within 1–3 miles? Heavy new supply typically softens prices + rents 12–24 months out; constrained supply supports both.
Investment metrics
- 1% rule
- 1.44% ✓
- Cap rate
- 10.92%
- Cash-on-cash
- 16.51%
- DSCR
- 1.73
- GRM
- 5.8
CMA / ARV
No comps found within radius.
Projected returns pro-forma
10.0% appreciation · 3.0% rent growth · sell at horizon
- IRR
- 35.1%
- Equity multiple
- 3.72×
- Total profit
- $114,324
- Equity at exit
- $135,042
- IRR
- 30.3%
- Equity multiple
- 8.42×
- Total profit
- $311,316
- Equity at exit
- $291,223
Cash invested: $41,972 (down + closing). Projections, not guarantees.
Landlord ↔ Tenant lean methodology
- Overall (STATE)
- 62 Landlord-Friendly
- State Pennsylvania
- 62 Landlord-Friendly · EVEN
- County
- — inherits STATE
- City
- — inherits STATE
ZIP-level market 17304
- Home prices YoY
- 14.1%
- Active inventory
- 13
- Price-to-rent
- 5.8×
Monthly cashflow live
- Estimated rent
- $2,154 medium interval (Pro) →
- Mortgage (P&I)
- −$786
- Tax from tax record
- −$276 /mo · $3,306/yr
- Insurance
- −$62
- Flood insurance flood zone
- −$66 /mo · $798/yr
- HOA
- −$0
- Vacancy / Maint / Mgmt
- −$452
- Net cashflow
- $511
Break-even live
Sensitivity live
| Price | -10% $596 | -5% $554 | +0% $511 | +5% $469 | +10% $426 |
|---|---|---|---|---|---|
| Rent | -10% $341 | -5% $426 | +0% $511 | +5% $596 | +10% $681 |
| Rate | -1.0pp $587 | -0.5pp $549 | base $511 | +0.5pp $472 | +1.0pp $433 |
UW: 25.0% down · 7.5% · 30yr · 1.5% tax · 5.0% vac · 8.0% maint · 8.0% mgmt
Financing live
Cash to close
- Down payment
- $37,475
- Closing costs
- $4,497
- Reserves months
- —
- Total cash needed
- —
Loan-product check · same deal, 3 products live
Conventional
25% down · 7.5% · 30yr
- Down + closing
- —
- Monthly P&I
- —
- Monthly cashflow
- —
- DSCR
- —
- Eligible?
- —
Personal DTI + credit; lowest rate.
DSCR
20% down · 8.5% · 30yr
- Down + closing
- —
- Monthly P&I
- —
- Monthly cashflow
- —
- DSCR
- —
- Eligible?
- —
No personal income docs; deal must DSCR.
Hard money
10% down · 12.0% · 12mo
- Down + closing
- —
- Monthly P&I
- —
- Monthly cashflow
- —
- DSCR
- —
- Eligible?
- —
Short-term bridge; refi at stabilization.
Listing history 24 events
-
2026-06-19days on market $149,900 Active 60 DOM
-
2026-06-18days on market $149,900 Active 59 DOM
-
2026-06-17days on market $149,900 Active 58 DOM
-
2026-06-16days on market $149,900 Active 57 DOM
-
2026-06-15days on market $149,900 Active 56 DOM
-
2026-06-14days on market $149,900 Active 54 DOM
-
2026-06-12days on market $149,900 Active 53 DOM
-
2026-06-09days on market $149,900 Active 50 DOM
-
2026-06-08days on market $149,900 Active 49 DOM
-
2026-06-07days on market $149,900 Active 48 DOM
-
2026-06-03days on market $149,900 Active 44 DOM
-
2026-06-02days on market $149,900 Active 43 DOM
-
2026-06-01days on market $149,900 Active 42 DOM
-
2026-05-31days on market $149,900 Active 41 DOM
-
2026-05-30days on market $149,900 Active 40 DOM
-
2026-04-20$149,900 Active 1125-char remark
-
2024-07-03soldstatus $71,000
-
2024-07-02soldstatus $71,000 Closed 129-char remark
Show marketing remark (129 chars)
1.20 Acre parcel with pubic sewer. Property features a 3 bedroom farmhouse ready to be restored. Land boarders the Opossum creek.
-
2024-06-07status Pending 129-char remark
Show marketing remark (129 chars)
1.20 Acre parcel with pubic sewer. Property features a 3 bedroom farmhouse ready to be restored. Land boarders the Opossum creek.
-
2024-06-03$50,000 Active 129-char remark
Show marketing remark (129 chars)
1.20 Acre parcel with pubic sewer. Property features a 3 bedroom farmhouse ready to be restored. Land boarders the Opossum creek.
-
2023-12-28price $52,000
-
2023-11-30price $54,700
-
2023-10-29price $57,500
-
2023-09-26price $60,500
ⓘ Source: listings_history table (triggers on properties + properties_extension) + one-shot
backfill from property_details.listing_events for pre-trigger history.
Tax reassessment forecast PA · Partial reset (capped growth)
- Current annual tax
- $3,306 · $276/mo
- Projected year-2 tax
- $3,306 · $276/mo
- Expected delta
- $0/yr ($0/mo · 0.0%)
ⓘ Screening estimate from a state-policy table — verify with the county assessor before closing.
Climate risk First Street
- Flood 9/10 Extreme FEMA zone X (unshaded) · 99% chance over 30 yrs
- Wildfire 2/10 Low
- Heat 5/10 Major 7 d/yr ≥100°F today · 15 d/yr by 30 yrs out
- Wind 3/10 Moderate 5% chance of damaging wind over 30 yrs
- Air quality 2/10 Low 1 unhealthy d/yr today · 2 by 30 yrs out
Nearby sold comps map
Loading sold comps map…
Walkable amenities ~0.75 mi
Loading nearby amenities…
Taxation est. · year 1
- Rental income
- $25,849
- − Mortgage interest
- −$8,397
- − Property taxes
- −$3,306
- − Insurance
- −$1,547
- − Repairs & maintenance
- −$2,068
- − Management
- −$2,068
- − Depreciation
- −$4,361
- Taxable income
- $4,102
- Est. tax owed @ 24.0%
- −$985
- After-tax cash flow
- $5,150/yr
For passive investors: Depreciation is non-cash, so a rental often shows a tax loss while cash-flowing — sheltering income. Rental losses are passive: they offset passive income freely, and up to $25,000/yr can offset ordinary (W-2) income if you actively participate and your MAGI is under $100k (phasing out to $0 by $150k); unused losses carry forward. On sale, claimed depreciation is recaptured at up to 25%, and gains may owe capital-gains tax (a 1031 exchange can defer both). Figures are a year-1 estimate at your 24.0% rate — not tax advice; consult a CPA.
Schools (NCES district)
- District
- Upper Adams SD
- NCES district ID
- 4224300
- Math proficiency
- 33% ▼ -17.00%
- Reading proficiency
- 52% ▼ -14.00%
- Median HH income
- $56,964
- Composite
- 37.16/100
- National rank
- #4482
- State rank
- #298 of 539 in PA
Livability — Aspers
- Score
- 72/100
- State rank
- #598
- US rank
- #5734
Category grades
Schools grade is shown separately in the Schools card above.
Census & demographics
- Census place
- Aspers, PA
- City population
- 3,039
- Population (ZIP)
- 3,039
Population outlook (Adams County) Hauer SSP2
- Today (2025)
- 102,494 people
- By 2030
- 101,890 · -0.6%
- By 2040
- 98,417 · -4.0%
- By 2050
- 92,014 · -10.2%
- By 2075
- 76,128 · -25.7%
- By 2100
- 58,931 · -42.5%
Race, ethnicity, and origin ACS 2023
- Neighborhood character
- Predominantly White (74%)
- Race & ethnicity
- White 74% Hispanic / Latino 21% Two or more races 5% Black 2%
- Hispanic origin (detail)
- Mexican 18%
- Common ancestry
- Romanian 2% Italian 1% Slovak 1%
- Foreign-born
- 7% · Canada
- Languages at home
- 86% English-only · Spanish 14%
Political lean MEDSL · Adams
- 2024 margin
- Solid R (+33.6) · D 32.7% · R 66.4%
- 2008→2024 swing
- -14.1pp toward R · 2008: -19.6pp · 2024: -33.6pp
- All cycles
- 2024: R+33.6 2020: R+34.1 2016: R+36.4 2012: R+27.6 2008: R+19.6
Not yet ingested
- Civics
- —
Market trends
- HPI YoY
- ▲ 41.77%
- Current HPI
- 337.3691
- Rent YoY
- —
- Metro
- —
- State GDP YoY
- ▲ 1.68%
- F500 in state
- 34
Industry mix (Fortune 500 HQ in PA)
| Industry | F500 HQs | Revenue |
|---|---|---|
| Healthcare | 2 | $309B |
|
||
| Insurance | 2 | $27B |
|
||
| Telecommunications / Media | 1 | $124B |
|
||
| Industrial Distribution | 1 | $22B |
|
||
| Financial Services | 1 | $20B |
|
||
| Chemicals / Materials | 1 | $18B |
|
||
Price history
+147.8% since first listed9 events — show timeline
- 2026-04-20 Listed $149,900 BRIGHT MLS
- 2024-07-03 Sold (Public Records) $71,000 Public Records
- 2024-07-02 Sold (MLS) $71,000 BRIGHT MLS
- 2024-06-07 Pending — BRIGHT MLS
- 2024-06-03 Listed $50,000 BRIGHT MLS
- 2023-12-28 Price Changed $52,000 BRIGHT MLS
- 2023-11-30 Price Changed $54,700 BRIGHT MLS
- 2023-10-29 Price Changed $57,500 BRIGHT MLS
- 2023-09-26 Price Changed $60,500 BRIGHT MLS
Property tax history
+2.2%/yrLatest (2026): $3,306 · +0.0% YoY. Source: county tax records.
Cash-flow waterfall
monthlySold comps — $/sqft
last 12 mo · ≤1 miLoading sold comps…