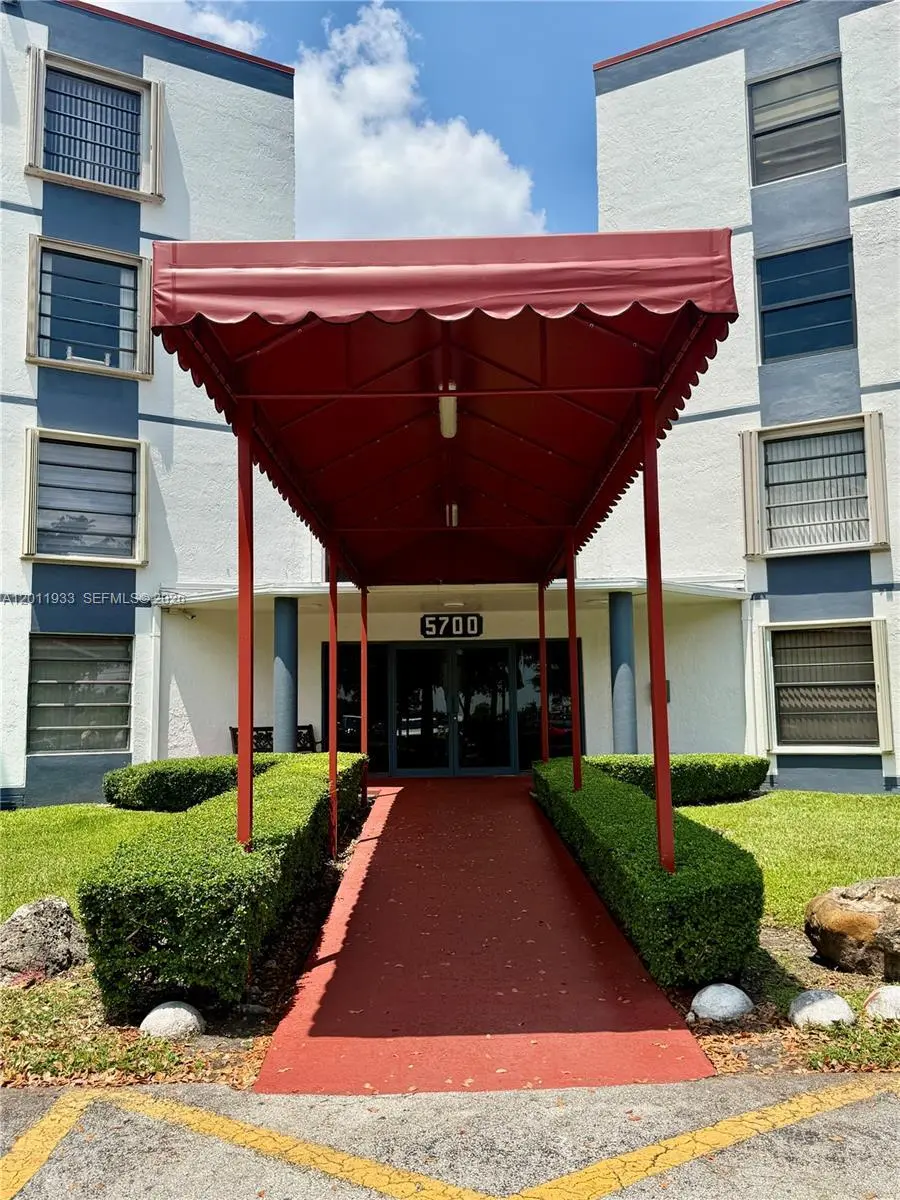
5700 SW 127th Ave #1413 · Kendale Lakes, FL
Flood risk 1/10 · Minimal
- FEMA flood zone
- X
- Chance of flooding over 30 yrs
- 0.0%
- Est. flood insurance / yr
- $507 – $1,088
Fire risk 1/10 · Minimal
- Est. fire insurance / yr
- $947 – $1,759
Heat risk 10/10 · Severe
- Hot days now (above 105°F)
- 7 days/yr
- Hot days in 30 yrs
- 30 days/yr
Wind risk 10/10 · Severe
- Chance of severe wind over 30 yrs
- 99.0%
Air-quality risk 2/10 · Minimal
- Unhealthy air days now
- 1 days/yr
- Unhealthy air days in 30 yrs
- 1 days/yr
Risk factors via First Street. Map © Google.
Why this score? — see what drove the D grade
The composite is a weighted blend of 9 inputs, each scored 0–100. Each bar is that input's sub-score; the figure is the points it added to the 100-point composite (weight × sub-score).
- Cash flow +12.3/30.0
- ARV discount +7.5/15.0
- 1% rule +5.3/10.0
- Schools +4.2/10.0
- Livability +3.9/5.0
- DSCR +3.6/10.0
- Rent growth +2.5/5.0
- Condition / age +2.5/5.0
- Appreciation +0.0/10.0
$249,900
🖨 Deal sheet (PDF) 📄 Offer letter ✓ Due diligence
Listing remarks
Welcome to Miller Gardens, a private gated community in Kendall Lakes ideally located in highly desirable West Kendall. This top-floor 2-bedroom, 2-bathroom split-plan condo features a spacious layout with high ceilings and abundant natural light, offering an excellent opportunity for buyers looking to renovate and customize to their own taste. The unit includes a large private balcony, hook up for washer and dryer, and accordion storm shutters throughout, as well as ample storage with generous closet space, including walk-in closets. With plenty of potential, it’s ideal for investors or homeowners ready to add value and create their dream space. Residents enjoy a resort-style lifesty
Key facts
- Two swimming pools
- Tennis courts
- Spacious layout
Tags
Property features AI
Finance
- Financial info: Pets allowed with size limit (maximum 20 lbs)
- HOA & community: Monthly association fee of $595; Association fee covers management, common areas, structural maintenance, parking, trash, and water; Association amenities include pool, tennis courts, trash service, and elevators
Exterior
- Parking: Assigned parking; Guest parking; Two or more parking spaces
- Security: Closed-circuit cameras; Complex fenced; Security guard
- Utilities: Cable available
- Home design: Condominium attached to building; Located on 4th floor; Building has 4 stories; Block construction
- Construction: Block construction; Resale property
- Exterior features: Balcony; Open balcony/patio; Tennis court(s); Association pool; Storm/security shutters; Exterior lighting
Interior
- Kitchen: Electric range; Dishwasher; Refrigerator; Garbage disposal; Trash compactor
- Bedrooms: Bedroom (12 x 11)
- Flooring: Carpet; Tile
- Bathrooms: 2 full bathrooms
- Heating & cooling: Central heating; Central air conditioning
- Interior features: Unfurnished; Bidet; Eat-in kitchen; First-floor entry; Living/dining room; Main living area on entry level; Split bedroom floorplan; Tub with shower; Walk-in closet(s)
- Laundry & utility: Washer; Dryer; Electric water heater
Neighborhood map
What this means for you Summary
Snapshot
- This is a 2-bed/2.0-bath condo listed at $250k.
Deal economics
- At list price, monthly cash flow is $-47 ($-562/yr) — negative.
- To cash-flow at today's rent, offer at most $242k (3.3% below list).
- Meets the 1% rule at list price ($3k rent vs $250k).
- Recommended offer: $242k (3.3% below list) — sets the bar for cash-flow.
- Cap rate 6.1% vs local median 3.6% in Kendale Lakes — top-decile yield for the area; either an underpriced asset or a hidden risk that comps aren't pricing in. Stress-test before assuming the spread holds.
Location & tenants
- Location reads 77/100 on livability (#186 in FL, #2,923 nationally) — a middle-class / working-renter tenant base. Strengths: housing A+, crime A-, commute B+; Watch: amenities F.
- Miami-Dade (suburban): math 45% / reading 54% proficiency, ranked #40 of 73 in FL (top 55%) — families likely to look elsewhere, expect single-tenant / working-renter base with shorter leases; 64% free/reduced lunch — lower-income household profile, screen leases tightly.
- Zoned schools: Royal Green Elementary School (math 47% / reading 62%, grade C, #892 of 2,144 statewide, top 44%, 407 students, 69% FRL); Howard D. Mcmillan Middle School (math 54% / reading 61%, grade B, #157 of 571 statewide, top 28%, 865 students, 60% FRL); Miami Sunset Senior High School (math 30% / reading 42%, grade F, #359 of 667 statewide, top 55%, 1,062 students, 54% FRL) — zoned schools at 61% FRL track the district average.
- Market conditions: Rents soft (-0.1%/yr); 185 active listings in the ZIP; 40 comparable units currently listed for rent nearby; rentals at typical pace (median 20d on market — plan ~3-4 weeks tenant-placement turnaround); 10,051 units permitted in Miami-Dade County in 2024 (7,758 in 5+ unit buildings).
- This rent runs 44% of the median local income ($70k/yr) — at the standard rent-burdened threshold; future hikes will face affordability resistance.
Forward outlook
- Local home prices are declining (-3.0%/yr); year-one equity from $2k of loan paydown is wiped out by about $7k of value loss. Plan a longer hold.
- Miami-Dade County population projected at +28% by 2050 — long-run rental-demand tailwind backs the buy-and-hold thesis.
Negotiation context
- It's been on market 19 days — a 2% lower offer ($246k) is reasonable based on typical stale-listing flexibility.
- Current owner paid $69k; list at $250k implies a 262% gain — meaningful room to come down on a strong offer.
Risks & watch-outs
- Watch-outs: HOA is 23% of rent.
- Climate carrying-cost: severe wind risk, 99% chance of damaging wind over 30y; extreme-heat days projected 7→30/yr by 2055 (HVAC capex compounding) — expect insurance premiums to compound above CPI over the hold.
Questions for the listing agent
- What do current leases actually rent for vs. the listed asking? Can we see a recent rent roll and the last 12 months of T-12 income?
- What does the HOA fee cover, when was the last increase, and are there any pending special assessments or reserve-fund shortfalls?
- Any open or pending special assessments — roof, HVAC, plumbing, elevator, façade? What's the per-unit balance and payoff schedule, and is the seller paying it off at close or rolling it to the buyer?
- Is there a deadline driving the sale (1031 exchange, divorce, estate, relocation)? That informs how much negotiation room exists.
- Schools are A-rated — typically a magnet for longer-tenancy family renters. What's the average tenant stay here, and is there a school-zone premium baked into asking?
- The area grade is low — what's the realistic commute time and amenity access for the typical tenant pool here? Any planned neighborhood developments (good or bad) we should know about?
- What's the average days-on-market for RENTAL listings here right now (not sales)? A rising rental-DOM trend means longer vacancies and softer asking-rent achievability than the comps imply.
- What's the recent tenant-quality profile in this submarket — average credit score on applications, eviction rate, late-payment / NSF rate, and stable-employment percentage? A property-management company in the area should have these aggregated.
- How much new apartment / multifamily construction is in the pipeline within 1–3 miles? Heavy new supply (>2% of stock underway) typically softens rents 12–24 months out; light construction supports rent growth.
Investment metrics
- 1% rule
- 1.03% ✓
- Cap rate
- 6.07%
- Cash-on-cash
- -0.80%
- DSCR
- 0.96
- GRM
- 8.1
CMA / ARV
No comps found within radius.
Projected returns pro-forma
-3.0% appreciation · 0.0% rent growth · sell at horizon
- IRR
- -21.7%
- Equity multiple
- 0.27×
- Total profit
- $-50,749
- Equity at exit
- $37,261
- IRR
- -27.7%
- Equity multiple
- -0.09×
- Total profit
- $-76,087
- Equity at exit
- $21,607
Cash invested: $69,972 (down + closing). Projections, not guarantees.
Landlord ↔ Tenant lean methodology
- Overall (STATE)
- 87 Strongly Landlord-Friendly
- State Florida
- 87 Strongly Landlord-Friendly · R+3
- County
- — inherits STATE
- City
- — inherits STATE
ZIP-level market 33183
- Rents YoY
- -0.1%
- Active inventory
- 185
- Price-to-rent
- 8.1×
Monthly cashflow live
- Estimated rent
- $2,568 high interval (Pro) →
- Mortgage (P&I)
- −$1,311
- Tax from tax record
- −$66 /mo · $790/yr
- Insurance
- −$104
- HOA
- −$595
- Vacancy / Maint / Mgmt
- −$539
- Net cashflow
- $-47
Break-even live
Sensitivity live
| Price | -10% $95 | -5% $24 | +0% $-47 | +5% $-118 | +10% $-188 |
|---|---|---|---|---|---|
| Rent | -10% $-250 | -5% $-148 | +0% $-47 | +5% $55 | +10% $156 |
| Rate | -1.0pp $79 | -0.5pp $17 | base $-47 | +0.5pp $-112 | +1.0pp $-177 |
UW: 25.0% down · 7.5% · 30yr · 1.5% tax · 5.0% vac · 8.0% maint · 8.0% mgmt
Financing live
Cash to close
- Down payment
- $62,475
- Closing costs
- $7,497
- Reserves months
- —
- Total cash needed
- —
Loan-product check · same deal, 3 products live
Conventional
25% down · 7.5% · 30yr
- Down + closing
- —
- Monthly P&I
- —
- Monthly cashflow
- —
- DSCR
- —
- Eligible?
- —
Personal DTI + credit; lowest rate.
DSCR
20% down · 8.5% · 30yr
- Down + closing
- —
- Monthly P&I
- —
- Monthly cashflow
- —
- DSCR
- —
- Eligible?
- —
No personal income docs; deal must DSCR.
Hard money
10% down · 12.0% · 12mo
- Down + closing
- —
- Monthly P&I
- —
- Monthly cashflow
- —
- DSCR
- —
- Eligible?
- —
Short-term bridge; refi at stabilization.
Rent comps 40 comps
| Address | Beds | Baths | Sqft | Rent | $/sqft | DOM | Units | Dist |
|---|---|---|---|---|---|---|---|---|
| 5700 SW 127th Ave #1407 Miami, FL | 2.0 | 2.0 | 1170 | $2,200 | $1.88 | 4d | 1 | 0.02mi |
| 5700 SW 127th Ave #1407 Miami, FL | 2.0 | 2.0 | 1170 | $2,200 | $1.88 | 18d | 1 | 0.02mi |
| 5800 SW 127th Ave Miami, FL | 2.0 | 2.0 | 1170 | $2,375 | $2.03 | 6d | 3 | 0.05mi |
| 5900 SW 127th Ave #3117 Miami, FL | 2.0 | 2.0 | 1170 | $2,500 | $2.14 | 0d | 1 | 0.10mi |
| 5900 SW 127th Ave Miami, FL | 2.0 | 2.0 | 1170 | $2,475 | $2.12 | 25d | 2 | 0.11mi |
| 12775 SW 59th St Miami, FL | 3.0 | 2.0 | 1411 | $3,700 | $2.62 | 19d | 1 | 0.21mi |
| 12775 SW 59th St Miami, FL | 3.0 | 2.0 | 1411 | $3,700 | $2.62 | 25d | 1 | 0.21mi |
| 12775 SW 59th St Miami, FL | 3.0 | 2.0 | 1411 | $3,700 | $2.62 | 0d | 1 | 0.21mi |
| 6203 SW 131st Ct #103 Miami, FL | 2.0 | 2.0 | 820 | $2,250 | $2.74 | 6d | 1 | 0.39mi |
| 6205 SW 131st Ct #203 Miami, FL | 2.0 | 2.0 | 820 | $2,300 | $2.80 | 23d | 1 | 0.41mi |
| 6230 SW 129th Pl #1210 Miami, FL | 2.0 | 2.0 | 1070 | $2,700 | $2.52 | 16d | 1 | 0.45mi |
| 6140 SW 129th Pl #2007 Miami, FL | 3.0 | 2.5 | 1355 | $2,600 | $1.92 | 16d | 1 | 0.45mi |
| 6435 SW 129th Pl #107 Miami, FL | 2.0 | 2.5 | 1100 | $2,600 | $2.36 | 0d | 1 | 0.48mi |
| 13220 SW 58th Ter Unit 16-1 Miami, FL | 3.0 | 2.5 | 1190 | $2,800 | $2.35 | 25d | 1 | 0.49mi |
| 13007 SW 50th Ln Miami, FL | 3.0 | 1.0 | 1015 | $2,800 | $2.76 | 25d | 1 | 0.49mi |
| 12990 SW 63rd Ter #605 Miami, FL | 1.0 | 1.0 | 711 | $1,950 | $2.74 | 25d | 1 | 0.50mi |
| 12705 SW 66th Terrace Dr Unit 12705 Miami, FL | 3.0 | 2.5 | 1472 | $3,100 | $2.11 | 25d | 1 | 0.53mi |
| 12736 SW 66th Terrace Dr Unit 12736 Miami, FL | 2.0 | 1.0 | 1025 | $2,450 | $2.39 | 25d | 1 | 0.55mi |
| 12955 SW 66th Ln Unit 203-2 Miami, FL | 3.0 | 2.0 | 1030 | $2,800 | $2.72 | 19d | 1 | 0.57mi |
| 12955 SW 66th Ln Unit 212-2 Miami, FL | 2.0 | 2.0 | 890 | $2,000 | $2.25 | 25d | 1 | 0.57mi |
| 6445 SW 130th Pl #610 Miami, FL | 2.0 | 2.0 | 950 | $2,300 | $2.42 | 25d | 1 | 0.58mi |
| 12960 SW 66th Ln Unit 14 Miami, FL | 2.0 | 2.0 | 890 | $2,150 | $2.42 | 25d | 1 | 0.58mi |
| 6425 SW 130th Pl #704 Miami, FL | 2.0 | 2.0 | 950 | $2,200 | $2.32 | 18d | 1 | 0.59mi |
| 6425 SW 130th Pl #704 Miami, FL | 2.0 | 2.0 | 950 | $2,200 | $2.32 | 12d | 1 | 0.59mi |
| 13330 SW 59th Ter Miami, FL | 3.0 | 2.0 | 1258 | $2,800 | $2.23 | 0d | 1 | 0.61mi |
| 13330 SW 59th Ter Miami, FL | 3.0 | 2.0 | 1258 | $2,800 | $2.23 | 6d | 1 | 0.61mi |
| 13335 SW 57th Ter Unit 83 Miami, FL | 2.0 | 1.5 | 936 | $2,500 | $2.67 | 5d | 1 | 0.62mi |
| 13120 SW 64th Ter #1504 Miami, FL | 2.0 | 2.0 | 950 | $2,300 | $2.42 | 9d | 1 | 0.64mi |
| 13045 SW 68th St #102 Miami, FL | 2.0 | 2.0 | 1180 | $2,200 | $1.86 | 25d | 1 | 0.66mi |
| 6795 SW 132nd Ave #203 Miami, FL | 2.0 | 2.0 | 956 | $2,300 | $2.41 | 16d | 1 | 0.68mi |
| 13404 SW 62nd St Unit 110L Miami, FL | 3.0 | 2.5 | 1360 | $2,950 | $2.17 | 25d | 1 | 0.71mi |
| 6834 SW 128th Pl Unit 6834 Miami, FL | 3.0 | 2.5 | 1472 | $3,100 | $2.11 | 15d | 1 | 0.76mi |
| 6834 SW 128th Pl Miami, FL | 3.0 | 2.5 | 1472 | $3,100 | $2.11 | 0d | 1 | 0.76mi |
| 6911 SW 129th Ave #5 Miami, FL | 2.0 | 2.0 | 812 | $2,100 | $2.59 | 25d | 1 | 0.78mi |
| 13495 SW 62nd St Miami, FL | 3.0 | 2.0 | 1150 | $3,100 | $2.70 | 25d | 1 | 0.78mi |
| 13466 SW 62nd St Unit 101B Miami, FL | 2.0 | 2.5 | 1160 | $2,600 | $2.24 | 9d | 1 | 0.79mi |
| 6921 SW 129th Ave #5 Miami, FL | 2.0 | 2.0 | 812 | $2,050 | $2.52 | 25d | 1 | 0.79mi |
| 7011 SW 129th Ave #5 Miami, FL | 2.0 | 2.0 | 812 | $2,175 | $2.68 | 22d | 1 | 0.84mi |
| 4933 SW 135th Pl Unit 4933 Miami, FL | 2.0 | 1.0 | 864 | $2,500 | $2.89 | 9d | 1 | 0.85mi |
| 13561 SW 62nd St #169 Miami, FL | 3.0 | 2.0 | 1150 | $2,750 | $2.39 | 25d | 1 | 0.86mi |
HOA detail condo
- Monthly dues
- $595 · $7,140/yr
- Likely covers
- security
- Assessments
- None detected in remarks — confirm with the listing agent.
Listing history 6 events
-
2026-06-21days on market $249,900 Active 19 DOM
-
2026-06-18status $249,900 Active 16 DOM
-
2026-05-20status Pending
-
2026-05-09historical Active Under Contract
-
2026-05-04$249,900 Active
-
1981-05-01soldstatus $69,000
ⓘ Source: listings_history table (triggers on properties + properties_extension) + one-shot
backfill from property_details.listing_events for pre-trigger history.
Tax reassessment forecast FL · Resets to sale price
- Current annual tax
- $790 · $66/mo
- Projected year-2 tax
- $2,074 · $173/mo
- Expected delta
- +$1,284/yr (+$107/mo · 162.5%)
ⓘ Screening estimate from a state-policy table — verify with the county assessor before closing.
Climate risk First Street
- Flood 1/10 Low FEMA zone X · 0% chance over 30 yrs
- Wildfire 1/10 Low
- Heat 10/10 Extreme 7 d/yr ≥105°F today · 30 d/yr by 30 yrs out
- Wind 10/10 Extreme 99% chance of damaging wind over 30 yrs
- Air quality 2/10 Low 1 unhealthy d/yr today · 1 by 30 yrs out
Nearby sold comps map
Loading sold comps map…
Walkable amenities ~0.75 mi
Loading nearby amenities…
Taxation est. · year 1
- Rental income
- $30,815
- − Mortgage interest
- −$13,998
- − Property taxes
- −$790
- − Insurance
- −$1,250
- − Repairs & maintenance
- −$2,465
- − Management
- −$2,465
- − HOA
- −$7,140
- − Depreciation
- −$7,270
- Taxable loss
- −$4,563
- Est. tax savings @ 24.0%
- +$1,095
- After-tax cash flow
- $533/yr
For passive investors: Depreciation is non-cash, so a rental often shows a tax loss while cash-flowing — sheltering income. Rental losses are passive: they offset passive income freely, and up to $25,000/yr can offset ordinary (W-2) income if you actively participate and your MAGI is under $100k (phasing out to $0 by $150k); unused losses carry forward. On sale, claimed depreciation is recaptured at up to 25%, and gains may owe capital-gains tax (a 1031 exchange can defer both). Figures are a year-1 estimate at your 24.0% rate — not tax advice; consult a CPA.
Schools (NCES district)
- District
- Miami-Dade
- NCES district ID
- 1200390
- Math proficiency
- 45% ▼ -16.00%
- Reading proficiency
- 54% ▼ -5.00%
- Median HH income
- $43,928
- Composite
- 41.76/100
- National rank
- #3397
- State rank
- #40 of 73 in FL
Livability — Kendale Lakes
- Score
- 77/100
- State rank
- #186
- US rank
- #2923
Category grades
Schools grade is shown separately in the Schools card above.
Census & demographics
- Census place
- Kendale Lakes, FL
- County
- Miami-Dade County · 2,697,751 people
- City population
- 33,811
- Metro
- Miami-Fort Lauderdale-Pompano Beach, FL
- Population (ZIP)
- 33,527
- Household income
- $70,218
- Rent vs Own
- Severe rent burden
- 1416.0
Population outlook (Miami-Dade County) Hauer SSP2
- Today (2025)
- 3,126,439 people
- By 2030
- 3,325,765 · +6.4%
- By 2040
- 3,697,561 · +18.3%
- By 2050
- 4,012,134 · +28.3%
- By 2075
- 4,605,612 · +47.3%
- By 2100
- 4,866,598 · +55.7%
Race, ethnicity, and origin ACS 2023
- Neighborhood character
- Predominantly Hispanic (84%)
- Race & ethnicity
- Hispanic / Latino 84% Two or more races 52% White 13% Black 1% Asian 1%
- Hispanic origin (detail)
- Mexican 1% Puerto Rican 2% Cuban 53% Dominican 1%
- Common ancestry
- Romanian 1%
- Foreign-born
- 63% · Canada, Jamaica
- Languages at home
- 15% English-only · Spanish 83% French/Haitian/Cajun 1% Other Indo-European 1%
Political lean MEDSL · Miami-Dade
- 2024 margin
- R (+11.4) · D 43.9% · R 55.4%
- 2008→2024 swing
- -27.6pp toward R · 2008: 16.1pp · 2024: -11.4pp
- All cycles
- 2024: R+11.4 2020: D+7.3 2016: D+29.6 2012: D+23.7 2008: D+16.1
Not yet ingested
- Civics
- —
Market trends
- HPI YoY
- ▼ -331.51%
- Current HPI
- 385.8798
- Rent YoY
- ▼ -0.10%
- Metro
- Miami-Fort Lauderdale-Pompano Beach, FL
- State GDP YoY
- ▲ 3.28%
- F500 in state
- 36
Industry mix (Fortune 500 HQ in FL)
| Industry | F500 HQs | Revenue |
|---|---|---|
| Industrial Technology | 2 | $29B |
|
||
| Insurance | 2 | $17B |
|
||
| Retail | 1 | $60B |
|
||
| Technology Distribution | 1 | $58B |
|
||
| Homebuilding | 1 | $35B |
|
||
| Technology Manufacturing | 1 | $35B |
|
||
Price history
+262.2% since first listed4 events — show timeline
- 2026-05-20 Pending — MARMLS
- 2026-05-09 Contingent — MARMLS
- 2026-05-04 Listed $249,900 MARMLS
- 1981-05-01 Sold (Public Records) $69,000 Public Records
Property tax history
+2.1%/yrLatest (2025): $790 · +4.6% YoY. Source: county tax records.
Cash-flow waterfall
monthlySold comps — $/sqft
last 12 mo · ≤1 miLoading sold comps…