5788 NW 57th Ct · Ocala, FL
Flood risk 1/10 · Minimal
- FEMA flood zone
- X (unshaded)
- Chance of flooding over 30 yrs
- 0.0%
- Est. flood insurance / yr
- $507 – $1,088
Fire risk 5/10 · Moderate
- Est. fire insurance / yr
- $947 – $1,759
Heat risk 8/10 · Major
- Hot days now (above 107°F)
- 7 days/yr
- Hot days in 30 yrs
- 22 days/yr
Wind risk 9/10 · Severe
- Chance of severe wind over 30 yrs
- 99.0%
Air-quality risk 3/10 · Minor
- Unhealthy air days now
- 3 days/yr
- Unhealthy air days in 30 yrs
- 3 days/yr
Risk factors via First Street. Map © Google.
Why this score? — see what drove the D- grade
The composite is a weighted blend of 9 inputs, each scored 0–100. Each bar is that input's sub-score; the figure is the points it added to the 100-point composite (weight × sub-score).
- Cash flow +11.6/30.0
- Rent growth +5.0/5.0
- Condition / age +4.8/5.0
- Schools +3.6/10.0
- Livability +3.5/5.0
- 1% rule +3.4/10.0
- DSCR +3.4/10.0
- ARV discount +1.3/15.0
- Appreciation +0.0/10.0
$240,000
🖨 Deal sheet (PDF) 📄 Offer letter ✓ Due diligence
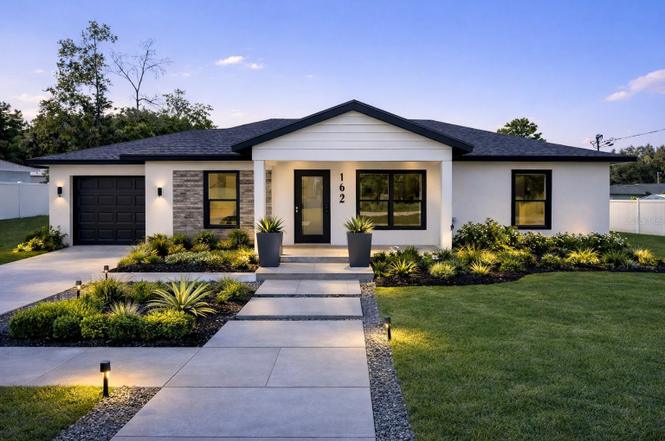
Listing remarks
Home completed and ready in under 10 days. Brand New Construction | Prime Ocala Park Estates | No HOA Open concept layout is anchored by a well composed kitchen featuring modern cabinetry, quartz countertops, stainless steel appliances, and a generous island with seating. Luxury vinyl plank flooring and a calm neutral palette create a seamless flow throughout. The primary bath delivers a spa caliber experience with full height shower tile, penny tile mosaic flooring for refined texture and secure footing, and a dual his and hers vanity finished in a modern style with designer lighting and refined hardware. The overall aesthetic is sophisticated, high contrast, and boutique hotel inspired.
Key facts
- Quartz countertops
- Stone detailing
- Open concept layout
Tags
Property features AI
Finance
- Other: No lease restrictions indicated
- HOA & community: Pets allowed (cats and dogs)
Exterior
- Parking: Driveway; On-street parking; Ground-level open parking; Attached garage (1 space)
- Utilities: Private well water; Private sewer (septic tank); Broadband/high-speed internet available; Cable available; Electricity connected; Water connected; Sewer connected
- Home design: Single family residence; Attached property; One level; East-facing; Completed/new construction
- Construction: Block construction; Shingle roof; Slab foundation; Built by MODERN DAY DEVELOPMENT
- Exterior features: Front porch; Corner lot; Landscaped yard; Cleared lot; Paved surfaces; Trees/wooded landscaping
Interior
- Kitchen: Dishwasher; Microwave; Range; Refrigerator; Electric water heater
- Bedrooms: 3 bedrooms
- Flooring: Tile
- Bathrooms: 2 full bathrooms
- Heating & cooling: Central heating (electric); Central air conditioning
- Interior features: Open floorplan; Stone counters; Thermostat; Double pane windows; Sliding doors
- Laundry & utility: Inside laundry room; Inside utility room
Neighborhood map
What this means for you Summary
Snapshot
- This is a 3-bed/2.0-bath single-family listed at $240k. Condition is rated excellent.
Deal economics
- At list price, monthly cash flow is $-73 ($-873/yr) — negative.
- To cash-flow at today's rent, offer at most $229k (4.4% below list).
- To meet the 1% rule (rent ≥ 1% of price), the offer needs to be $201k (16.4% below list).
- Recommended offer: $201k (16.4% below list) — sets the bar for 1% rule.
- Cap rate 5.9% vs local median 4.1% in Ocala — top-decile yield for the area; either an underpriced asset or a hidden risk that comps aren't pricing in. Stress-test before assuming the spread holds.
Location & tenants
- Location reads 69/100 on livability (#476 in FL) — a middle-class / working-renter tenant base. Strengths: cost of living A+, housing A+, health & safety A+; Watch: crime F, amenities F, commute F.
- Marion (rural): math 42% / reading 43% proficiency, ranked #61 of 73 in FL (top 84%) — families likely to look elsewhere, expect single-tenant / working-renter base with shorter leases; 61% free/reduced lunch — lower-income household profile, screen leases tightly.
- Zoned schools: Fessenden Elementary School (math 37% / reading 37%, grade F, #1,609 of 2,144 statewide, top 77%, 417 students, 79% FRL); North Marion Middle School (math 35% / reading 34%, grade F, #421 of 571 statewide, top 74%, 803 students, 72% FRL); North Marion High School (math 20% / reading 32%, grade F, #494 of 667 statewide, top 75%, 1,303 students, 66% FRL).
- Market conditions: Rents rising fast (+11.1%/yr); 670 active listings in the ZIP; 6 comparable units currently listed for rent nearby; rentals at typical pace (median 23d on market — plan ~3-4 weeks tenant-placement turnaround); 7,071 units permitted in Marion County in 2024 (534 in 5+ unit buildings).
- This rent runs 37% of the median local income ($66k/yr) — at the standard rent-burdened threshold; future hikes will face affordability resistance.
Forward outlook
- Local home prices are declining (-3.0%/yr); year-one equity from $2k of loan paydown is wiped out by about $7k of value loss. Plan a longer hold.
- Marion County population projected at +13% by 2050 — modest demand growth; plan on rents tracking national, not racing it.
Negotiation context
- It's been on market 46 days — a 3% lower offer ($233k) is reasonable based on typical stale-listing flexibility.
- 5 sale attempts with the ask held roughly flat each time — persistent listings suggest the price (not the market) is what's stuck; bring a comps-based counter.
Risks & watch-outs
- Climate carrying-cost: severe wind risk, 99% chance of damaging wind over 30y; moderate wildfire risk; extreme-heat days projected 7→22/yr by 2055 (HVAC capex compounding) — expect insurance premiums to compound above CPI over the hold.
Questions for the listing agent
- What do current leases actually rent for vs. the listed asking? Can we see a recent rent roll and the last 12 months of T-12 income?
- It's been on market 46 days. Have you received any prior offers? Is the seller open to a 16% concession, seller financing, or rate buy-down credit?
- Is there a deadline driving the sale (1031 exchange, divorce, estate, relocation)? That informs how much negotiation room exists.
- Crime grade is F in this area — have there been break-ins, vandalism, or insurance claims at this property in the last 3 years? What carrier currently insures it and at what premium?
- The area grade is low — what's the realistic commute time and amenity access for the typical tenant pool here? Any planned neighborhood developments (good or bad) we should know about?
- What's the average days-on-market for RENTAL listings here right now (not sales)? A rising rental-DOM trend means longer vacancies and softer asking-rent achievability than the comps imply.
- What's the recent tenant-quality profile in this submarket — average credit score on applications, eviction rate, late-payment / NSF rate, and stable-employment percentage? A property-management company in the area should have these aggregated.
- How much new for-sale + rental construction is in the pipeline within 1–3 miles? Heavy new supply typically softens prices + rents 12–24 months out; constrained supply supports both.
Investment metrics
- 1% rule
- 0.84% ✗
- Cap rate
- 5.93%
- Cash-on-cash
- -1.30%
- DSCR
- 0.94
- GRM
- 10.0
CMA / ARV
- ARV (on-the-fly)
- $211,140
- Comps found
- 12
Show comp detail 12 sales within ~0.75 mi
| Address | Dist | Beds/Ba | Sqft | Sold | Price | $/sf | Match |
|---|---|---|---|---|---|---|---|
| 5831 NW 58th Ter | 0.05mi | 3/2.0 | 1,144 (-2%) | 13mo | $227,000 | $198 | 83 |
| 5290 NW 61st Ln | 0.51mi | 3/2.0 | 1,118 (-5%) | 2mo | $175,100 | $157 | 66 |
| 5632 NW 57th St | 0.17mi | 3/2.0 | 1,331 (+14%) | 8mo | $239,900 | $180 | 63 |
| 5548 NW 63rd Pl | 0.44mi | 3/2.0 | 1,152 (-2%) | 21mo | $190,000 | $165 | 59 |
| 5931 NW 62nd Pl | 0.38mi | 3/2.0 | 1,014 (-14%) | 1mo | $219,900 | $217 | 59 |
| 6354 NW 61st Ln | 0.60mi | 3/2.0 | 1,232 (+5%) | 10mo | $225,000 | $183 | 55 |
| 5668 NW 57 St | 0.14mi | 3/2.0 | 1,331 (+14%) | 20mo | $239,900 | $180 | 54 |
| 5641 NW 55th Ave | 0.30mi | 3/2.0 | 1,008 (-14%) | 10mo | $129,000 | $128 | 54 |
| 5810 NW 59th Ave | 0.12mi | 3/1.5 | 1,008 (-14%) | 19mo | $180,000 | $179 | 53 |
| 5417 NW 63rd Pl | 0.53mi | 3/2.0 | 1,246 (+6%) | 18mo | $225,000 | $181 | 50 |
| 6422 NW 62nd Ave | 0.71mi | 3/2.0 | 1,232 (+5%) | 10mo | $224,000 | $182 | 50 |
| 6086 NW 53rd Street Rd | 0.42mi | 3/2.0 | 1,331 (+14%) | 11mo | $239,900 | $180 | 49 |
Match score weights: distance 35% · size 25% · config 20% · recency 20%. Top-matched comps best support the ARV.
Projected returns pro-forma
-3.0% appreciation · 8.0% rent growth · sell at horizon
- IRR
- -13.0%
- Equity multiple
- 0.51×
- Total profit
- $-32,885
- Equity at exit
- $35,785
- IRR
- 2.4%
- Equity multiple
- 1.21×
- Total profit
- $13,804
- Equity at exit
- $20,751
Cash invested: $67,200 (down + closing). Projections, not guarantees.
Landlord ↔ Tenant lean methodology
- Overall (STATE)
- 87 Strongly Landlord-Friendly
- State Florida
- 87 Strongly Landlord-Friendly · R+3
- County
- — inherits STATE
- City
- — inherits STATE
ZIP-level market 34482
- Rents YoY
- 11.1%
- Active inventory
- 670
- Price-to-rent
- 10.0×
Monthly cashflow live
- Estimated rent
- $2,007 high interval (Pro) →
- Mortgage (P&I)
- −$1,259
- Tax est. 1.5%
- −$300 /mo · $3,600/yr
- Insurance
- −$100
- HOA
- −$0
- Vacancy / Maint / Mgmt
- −$422
- Net cashflow
- $-73
Break-even live
Sensitivity live
| Price | -10% $93 | -5% $10 | +0% $-73 | +5% $-156 | +10% $-239 |
|---|---|---|---|---|---|
| Rent | -10% $-231 | -5% $-152 | +0% $-73 | +5% $7 | +10% $86 |
| Rate | -1.0pp $48 | -0.5pp $-12 | base $-73 | +0.5pp $-135 | +1.0pp $-198 |
UW: 25.0% down · 7.5% · 30yr · 1.5% tax · 5.0% vac · 8.0% maint · 8.0% mgmt
Financing live
Cash to close
- Down payment
- $60,000
- Closing costs
- $7,200
- Reserves months
- —
- Total cash needed
- —
Loan-product check · same deal, 3 products live
Conventional
25% down · 7.5% · 30yr
- Down + closing
- —
- Monthly P&I
- —
- Monthly cashflow
- —
- DSCR
- —
- Eligible?
- —
Personal DTI + credit; lowest rate.
DSCR
20% down · 8.5% · 30yr
- Down + closing
- —
- Monthly P&I
- —
- Monthly cashflow
- —
- DSCR
- —
- Eligible?
- —
No personal income docs; deal must DSCR.
Hard money
10% down · 12.0% · 12mo
- Down + closing
- —
- Monthly P&I
- —
- Monthly cashflow
- —
- DSCR
- —
- Eligible?
- —
Short-term bridge; refi at stabilization.
Rent comps 6 comps
| Address | Beds | Baths | Sqft | Rent | $/sqft | DOM | Units | Dist |
|---|---|---|---|---|---|---|---|---|
| 5532 NW 57th Pl Ocala, FL | 2.0 | 2.0 | 962 | $1,295 | $1.35 | 15d | 1 | 0.21mi |
| 6175 NW 59th Ave Ocala, FL | 3.0 | 2.0 | 1384 | $1,745 | $1.26 | 23d | 1 | 0.30mi |
| 5391 NW 55th Ct Ocala, FL | 3.0 | 2.0 | 1332 | $1,650 | $1.24 | 23d | 1 | 0.34mi |
| 5907 NW 64th St Ocala, FL | 4.0 | 2.0 | 1313 | $1,699 | $1.29 | 23d | 1 | 0.51mi |
| 6425 NW 62nd Ter Ocala, FL | 3.0 | 2.0 | 1349 | $3,000 | $2.22 | 23d | 1 | 0.67mi |
| 6440 NW 66th Ct Ocala, FL | 3.0 | 2.0 | 992 | $1,695 | $1.71 | 15d | 1 | 1.02mi |
Listing history 8 events
-
2026-05-15status Pending
-
2026-05-07status Active
-
2026-03-27status Pending
-
2026-03-17status Active
-
2026-03-13status Active
-
2026-03-12status Active
-
2026-03-03status Pending
-
2026-02-03$240,000 Active
ⓘ Source: listings_history table (triggers on properties + properties_extension) + one-shot
backfill from property_details.listing_events for pre-trigger history.
Climate risk First Street
- Flood 1/10 Low FEMA zone X (unshaded) · 0% chance over 30 yrs
- Wildfire 5/10 Major
- Heat 8/10 Severe 7 d/yr ≥107°F today · 22 d/yr by 30 yrs out
- Wind 9/10 Extreme 99% chance of damaging wind over 30 yrs
- Air quality 3/10 Moderate 3 unhealthy d/yr today · 3 by 30 yrs out
Nearby sold comps map
Loading sold comps map…
Walkable amenities ~0.75 mi
Loading nearby amenities…
Taxation est. · year 1
- Rental income
- $24,089
- − Mortgage interest
- −$13,444
- − Property taxes
- −$3,600
- − Insurance
- −$1,200
- − Repairs & maintenance
- −$1,927
- − Management
- −$1,927
- − Depreciation
- −$6,982
- Taxable loss
- −$4,991
- Est. tax savings @ 24.0%
- +$1,198
- After-tax cash flow
- $325/yr
For passive investors: Depreciation is non-cash, so a rental often shows a tax loss while cash-flowing — sheltering income. Rental losses are passive: they offset passive income freely, and up to $25,000/yr can offset ordinary (W-2) income if you actively participate and your MAGI is under $100k (phasing out to $0 by $150k); unused losses carry forward. On sale, claimed depreciation is recaptured at up to 25%, and gains may owe capital-gains tax (a 1031 exchange can defer both). Figures are a year-1 estimate at your 24.0% rate — not tax advice; consult a CPA.
Condition & rehab AI · 2 photos
This home is a brand new construction with excellent condition and a prime location. It is move-in ready with no visible repairs or maintenance needed.
Value-add opportunities
- Both Landscaping and curb appeal improvements — Enhances the home's aesthetic and appeal to potential buyers and renters.
- Both Interior lighting upgrades — Improves the home's ambiance and can be easily done with LED fixtures.
Renovation cost estimate screening
Value-add ROI direction
- Both Landscaping and curb appeal improvements — Enhances the home's aesthetic and appeal to potential buyers and renters. ↑
- Both Interior lighting upgrades — Improves the home's ambiance and can be easily done with LED fixtures. ↑
ⓘ Cost ranges are severity-bucket heuristics (US national rule-of-thumb). Get contractor quotes + a written scope before underwriting a rehab budget.
Schools (NCES district)
- District
- Marion
- NCES district ID
- 1201260
- Math proficiency
- 42% ▼ -7.00%
- Reading proficiency
- 43% ▼ -4.00%
- Median HH income
- $40,015
- Composite
- 35.61/100
- National rank
- #4890
- State rank
- #61 of 73 in FL
Livability — Ocala
- Score
- 69/100
- State rank
- #476
- US rank
- #8461
Category grades
Schools grade is shown separately in the Schools card above.
Census & demographics
- County
- Marion County · 315,796 people
- City population
- 263,375
- Metro
- Ocala, FL
- Population (ZIP)
- 22,807
- Household income
- $65,901
- Rent vs Own
- Severe rent burden
- 282.0
Population outlook (Marion County) Hauer SSP2
- Today (2025)
- 365,905 people
- By 2030
- 376,768 · +3.0%
- By 2040
- 396,555 · +8.4%
- By 2050
- 412,723 · +12.8%
- By 2075
- 446,090 · +21.9%
- By 2100
- 436,193 · +19.2%
Race, ethnicity, and origin ACS 2023
- Neighborhood character
- Majority White (63%)
- Race & ethnicity
- White 63% Hispanic / Latino 19% Black 14% Two or more races 12%
- Hispanic origin (detail)
- Mexican 6% Puerto Rican 9% Cuban 2%
- Common ancestry
- Lithuanian 2% Romanian 2% Slovak 2%
- Foreign-born
- 10% · Canada
- Languages at home
- 81% English-only · Spanish 16% Other Indo-European 1%
Political lean MEDSL · Marion
- 2024 margin
- Solid R (+31.6) · D 33.8% · R 65.5%
- 2008→2024 swing
- -20.0pp toward R · 2008: -11.6pp · 2024: -31.6pp
- All cycles
- 2024: R+31.6 2020: R+25.9 2016: R+26.2 2012: R+16.2 2008: R+11.6
Not yet ingested
- Civics
- —
Market trends
- HPI YoY
- ▼ -133.62%
- Current HPI
- 194.3857
- Rent YoY
- ▲ 11.12%
- Metro
- Ocala, FL
- State GDP YoY
- ▲ 3.28%
- F500 in state
- 36
Industry mix (Fortune 500 HQ in FL)
| Industry | F500 HQs | Revenue |
|---|---|---|
| Industrial Technology | 2 | $29B |
|
||
| Insurance | 2 | $17B |
|
||
| Retail | 1 | $60B |
|
||
| Technology Distribution | 1 | $58B |
|
||
| Homebuilding | 1 | $35B |
|
||
| Technology Manufacturing | 1 | $35B |
|
||
Price history
8 events — show timeline
- 2026-05-15 Pending — Stellar MLS as Distributed by MLS Grid
- 2026-05-07 Relisted — Stellar MLS as Distributed by MLS Grid
- 2026-03-27 Pending — Stellar MLS as Distributed by MLS Grid
- 2026-03-17 Relisted — Stellar MLS as Distributed by MLS Grid
- 2026-03-13 Relisted — Stellar MLS as Distributed by MLS Grid
- 2026-03-12 Relisted — Stellar MLS as Distributed by MLS Grid
- 2026-03-03 Pending — Stellar MLS as Distributed by MLS Grid
- 2026-02-03 Listed $240,000 Stellar MLS as Distributed by MLS Grid
Cash-flow waterfall
monthlySold comps — $/sqft
last 12 mo · ≤1 miLoading sold comps…