 Multi-family
605 1st St · Rudd, IA
Flood risk 1/10 · Minimal
- FEMA flood zone
- X (unshaded)
- Chance of flooding over 30 yrs
- 0.0%
- Est. flood insurance / yr
- $507 – $1,088
Fire risk 1/10 · Minimal
- Est. fire insurance / yr
- $902 – $1,676
Heat risk 2/10 · Minimal
- Hot days now (above 100°F)
- 7 days/yr
- Hot days in 30 yrs
- 16 days/yr
Wind risk 2/10 · Minimal
- Chance of severe wind over 30 yrs
- —
Air-quality risk 1/10 · Minimal
- Unhealthy air days now
- 0 days/yr
- Unhealthy air days in 30 yrs
- 0 days/yr
Risk factors via First Street. Map © Google.
Why this score? — see what drove the B+ grade
The composite is a weighted blend of 9 inputs, each scored 0–100. Each bar is that input's sub-score; the figure is the points it added to the 100-point composite (weight × sub-score).
- Cash flow +30.0/30.0
- 1% rule +10.0/10.0
- DSCR +10.0/10.0
- ARV discount +7.5/15.0
- Appreciation +6.7/10.0
- Schools +5.5/10.0
- Livability +3.2/5.0
- Rent growth +2.5/5.0
- Condition / age +2.2/5.0
$220,000
🖨 Deal sheet 📄 Offer letter ✓ Due diligence
Multi-family units
County records classify this as Multi-Family (2-4 Unit). Listing-text estimate: 1 unit. estimate disagrees with records
Listing remarks
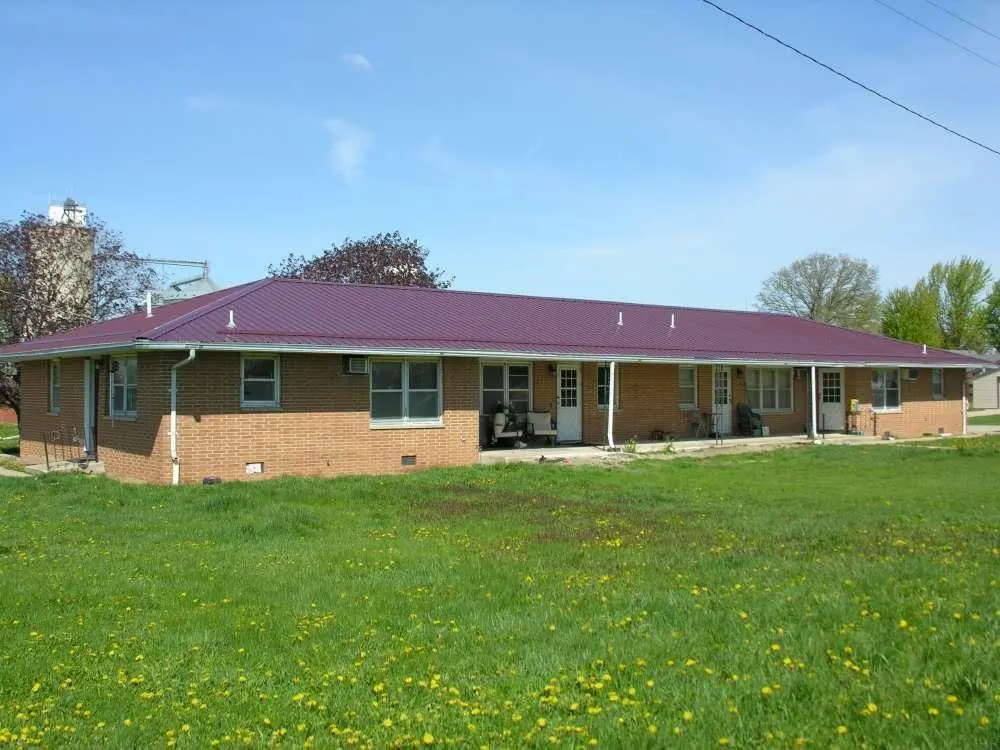
Brick one-story four-plex with steel roof. Fully occupied, nice corner lot, paved off-street parking. Excellent rental history. Appliances included.
Key facts
- One story
- Steel roof
- Appliances included
Tags
Property features AI
Finance
- Other: Zoned C; Lot dimensions approximately 112' x 150'; Lot size about 0.3 acre
Exterior
- Parking: Parking pad with four open spaces; Paved parking
- Utilities: Public water; Public sewer
- Home design: Quadruplex residential income property; Single-story (one level)
- Construction: Brick construction; Metal roof
- Exterior features: Covered porch/patio; Corner, level and irregular lot; Paved road frontage
Interior
- Heating & cooling: Electric baseboard heat; Window air conditioning units
- Interior features: Main-level laundry room; No basement listed
- Laundry & utility: Laundry room on the main level
Neighborhood map
What this means for you Summary
Snapshot
- This is a multifamily listed at $220k. Condition is rated fair.
Deal economics
- At list price, monthly cash flow is $1k ($15k/yr) — positive.
- The deal already cash-flows at list — no discount required.
- Meets the 1% rule at list price ($3k rent vs $220k).
- Recommended offer: $213k (3.0% below list) — sets the bar for market timing.
Location & tenants
- Location reads 64/100 on livability (#611 in IA) — a middle-class / working-renter tenant base. Strengths: cost of living A+, housing A+; Watch: employment C-, health & safety C-, schools F.
- Rudd-Rockford-Marble Rk Community School District (rural): math 67% / reading 63% proficiency, ranked #193 of 289 in IA (top 67%) — acceptable for families but not a draw, mixed tenant base, ~2y average lease.
- Market conditions: 3 active listings in the ZIP; 38 units permitted in Floyd County in 2024 (0 in 5+ unit buildings).
Forward outlook
- In year one you build about $9k of equity ($2k loan paydown + $7k appreciation (3.4% local appreciation)).
- Floyd County population projected to shrink 6% by 2050 — rents likely to lag national; underwrite the cash flow, not the appreciation.
- At projected returns (3.4% appreciation + 3.0% rent growth), your $62k cash investment doubles in ~3 years — after that, you're playing with house money.
- By year 4, paydown + projected appreciation supports a ~$30k cash-out refi (75% LTV) — recoverable capital for the next deal without selling this one.
Negotiation context
- It's been on market 31 days — a 3% lower offer ($213k) is reasonable based on typical stale-listing flexibility.
Questions for the listing agent
- It's been on market 31 days. Have you received any prior offers? Is the seller open to a 3% concession, seller financing, or rate buy-down credit?
- Have any recent inspections been done? Can we get a copy of the seller's disclosures and any deferred-maintenance estimates?
- Built in 1973 — when were the roof, HVAC, electrical panel, plumbing, and water heater last replaced?
- Is there a deadline driving the sale (1031 exchange, divorce, estate, relocation)? That informs how much negotiation room exists.
- Schools are F-rated, which usually means shorter tenancies and higher turnover. Who's the typical renter profile here, and what's been the actual vacancy rate?
- What's the average days-on-market for RENTAL listings here right now (not sales)? A rising rental-DOM trend means longer vacancies and softer asking-rent achievability than the comps imply.
- What's the recent tenant-quality profile in this submarket — average credit score on applications, eviction rate, late-payment / NSF rate, and stable-employment percentage? A property-management company in the area should have these aggregated.
- How much new apartment / multifamily construction is in the pipeline within 1–3 miles? Heavy new supply (>2% of stock underway) typically softens rents 12–24 months out; light construction supports rent growth.
Investment metrics
- 1% rule
- 1.58% ✓
- Cap rate
- 12.99%
- Cash-on-cash
- 23.92%
- DSCR
- 2.06
- GRM
- 5.3
CMA / ARV
No comps found within radius.
Projected returns pro-forma
3.36% appreciation · 3.0% rent growth · sell at horizon
- IRR
- 30.7%
- Equity multiple
- 2.77×
- Total profit
- $108,992
- Equity at exit
- $103,414
- IRR
- 30.8%
- Equity multiple
- 5.44×
- Total profit
- $273,336
- Equity at exit
- $162,957
Cash invested: $61,600 (down + closing). Projections, not guarantees.
Landlord ↔ Tenant lean methodology
- Overall (STATE)
- 83 Strongly Landlord-Friendly
- State Iowa
- 83 Strongly Landlord-Friendly · R+6
- County
- — inherits STATE
- City
- — inherits STATE
ZIP-level market 50471
- Home prices YoY
- 2.1%
- Active inventory
- 3
- Price-to-rent
- 21.1×
Monthly cashflow live
- Estimated rent
- $3,479 medium interval (Pro) →
- Mortgage (P&I)
- −$1,154
- Tax est. 1.5%
- −$275 /mo · $3,300/yr
- Insurance
- −$92
- HOA
- −$0
- Vacancy / Maint / Mgmt
- −$731
- Net cashflow
- $1,228
Break-even live
4-unit breakdown (identical units grouped — click to expand)
| Units | Beds | Baths | Est. rent |
|---|---|---|---|
| 4× units | 2 | 1 | $3,480 |
| #1 | 2 | 1 | $870 |
| #2 | 2 | 1 | $870 |
| #3 | 2 | 1 | $870 |
| #4 | 2 | 1 | $870 |
| Total (4 units) | $3,479 | ||
UW: 25.0% down · 7.5% · 30yr · 1.5% tax · 5.0% vac · 8.0% maint · 8.0% mgmt
Financing live
Cash to close
- Down payment
- $55,000
- Closing costs
- $6,600
- Reserves months
- —
- Total cash needed
- —
Loan-product check · same deal, 3 products live
Conventional
25% down · 7.5% · 30yr
- Down + closing
- —
- Monthly P&I
- —
- Monthly cashflow
- —
- DSCR
- —
- Eligible?
- —
Personal DTI + credit; lowest rate.
DSCR
20% down · 8.5% · 30yr
- Down + closing
- —
- Monthly P&I
- —
- Monthly cashflow
- —
- DSCR
- —
- Eligible?
- —
No personal income docs; deal must DSCR.
Hard money
10% down · 12.0% · 12mo
- Down + closing
- —
- Monthly P&I
- —
- Monthly cashflow
- —
- DSCR
- —
- Eligible?
- —
Short-term bridge; refi at stabilization.
Listing history 18 events
-
2026-06-19days on market $220,000 Active 31 DOM
-
2026-06-18days on market $220,000 Active 30 DOM
-
2026-06-17days on market $220,000 Active 29 DOM
-
2026-06-16days on market $220,000 Active 28 DOM
-
2026-06-15days on market $220,000 Active 27 DOM
-
2026-06-14days on market $220,000 Active 25 DOM
-
2026-06-13days on market $220,000 Active 24 DOM
-
2026-06-10days on market $220,000 Active 22 DOM
-
2026-06-09days on market $220,000 Active 21 DOM
-
2026-06-08days on market $220,000 Active 20 DOM
-
2026-06-07days on market $220,000 Active 19 DOM
-
2026-06-05days on market $220,000 Active 16 DOM
-
2026-06-03days on market $220,000 Active 15 DOM
-
2026-06-02days on market $220,000 Active 14 DOM
-
2026-06-01days on market $220,000 Active 13 DOM
-
2026-05-31days on market $220,000 Active 12 DOM
-
2026-05-30days on market $220,000 Active 11 DOM
-
2026-05-18$220,000 Active
ⓘ Source: listings_history table (triggers on properties + properties_extension) + one-shot
backfill from property_details.listing_events for pre-trigger history.
Climate risk First Street
- Flood 1/10 Low FEMA zone X (unshaded) · 0% chance over 30 yrs
- Wildfire 1/10 Low
- Heat 2/10 Low 7 d/yr ≥100°F today · 16 d/yr by 30 yrs out
- Wind 2/10 Low
- Air quality 1/10 Low 0 unhealthy d/yr today · 0 by 30 yrs out
Nearby sold comps map
Loading sold comps map…
Walkable amenities ~0.75 mi
Loading nearby amenities…
Taxation est. · year 1
- Rental income
- $41,748
- − Mortgage interest
- −$12,323
- − Property taxes
- −$3,300
- − Insurance
- −$1,100
- − Repairs & maintenance
- −$3,340
- − Management
- −$3,340
- − Depreciation
- −$6,400
- Taxable income
- $11,945
- Est. tax owed @ 24.0%
- −$2,867
- After-tax cash flow
- $11,870/yr
For passive investors: Depreciation is non-cash, so a rental often shows a tax loss while cash-flowing — sheltering income. Rental losses are passive: they offset passive income freely, and up to $25,000/yr can offset ordinary (W-2) income if you actively participate and your MAGI is under $100k (phasing out to $0 by $150k); unused losses carry forward. On sale, claimed depreciation is recaptured at up to 25%, and gains may owe capital-gains tax (a 1031 exchange can defer both). Figures are a year-1 estimate at your 24.0% rate — not tax advice; consult a CPA.
Condition & rehab AI · 4 photos
The property is a four-plex with a brick exterior and a steel roof. The roof and exterior paint are in poor condition, requiring significant repairs. Fresh paint and a repaired roof would significantly improve the home's value and appeal to renters.
Repairs flagged
- Major roof — Significant wear and tear is visible on the roof.
- Major exterior paint — The paint is faded and uneven, indicating significant wear and tear.
- Moderate exterior siding — The siding appears to be in fair condition but may benefit from some maintenance or repainting.
Value-add opportunities
- Rental paint exterior walls — Fresh paint can improve curb appeal and attract renters.
- Both repair roof — A repaired roof will reduce maintenance costs and improve the home's overall condition.
- Both landscaping — Well-maintained landscaping can enhance curb appeal and attract both buyers and renters.
Renovation cost estimate screening
| Repair item | Severity | Est. cost |
|---|---|---|
| roof · Significant wear and tear is visible on the roof. | Major | $15,000–50,000 |
| exterior paint · The paint is faded and uneven, indicating significant wear and tear. | Major | $15,000–50,000 |
| exterior siding · The siding appears to be in fair condition but may benefit from some maintenance or repainting. | Moderate | $3,000–15,000 |
| Total estimated repair cost · 3 items | $33,000–115,000 |
Value-add ROI direction
- Rental paint exterior walls — Fresh paint can improve curb appeal and attract renters. ↑
- Both repair roof — A repaired roof will reduce maintenance costs and improve the home's overall condition. ↑
- Both landscaping — Well-maintained landscaping can enhance curb appeal and attract both buyers and renters. ↑
ⓘ Cost ranges are severity-bucket heuristics (US national rule-of-thumb). Get contractor quotes + a written scope before underwriting a rehab budget.
Schools (NCES district)
- District
- Rudd-Rockford-Marble Rk Community School District
- NCES district ID
- 1924960
- Math proficiency
- 67% ▼ -8.00%
- Reading proficiency
- 63% ▼ -2.00%
- Median HH income
- $50,838
- Composite
- 55.32/100
- National rank
- #1259
- State rank
- #193 of 289 in IA
Livability — Rudd
- Score
- 64/100
- State rank
- #611
- US rank
- #14104
Category grades
Schools grade is shown separately in the Schools card above.
Census & demographics
- Census place
- Rudd, IA
- Population (ZIP)
- 786
Population outlook (Floyd County) Hauer SSP2
- Today (2025)
- 15,524 people
- By 2030
- 15,254 · -1.7%
- By 2040
- 14,830 · -4.5%
- By 2050
- 14,660 · -5.6%
- By 2075
- 15,548 · +0.2%
- By 2100
- 17,406 · +12.1%
Race, ethnicity, and origin ACS 2023
- Neighborhood character
- Predominantly White (96%)
- Race & ethnicity
- White 96% Asian 2% Two or more races 1%
- Common ancestry
- Portuguese 6% Italian 5% Iranian 1%
- Foreign-born
- 2% · South Korea
- Languages at home
- 97% English-only · Korean 2% German/W. Germanic 1%
Political lean MEDSL · Floyd
- 2024 margin
- Strong R (+25.7) · D 36.5% · R 62.2% · Other 1.3%
- 2008→2024 swing
- -47.6pp toward R · 2008: 21.9pp · 2024: -25.7pp
- All cycles
- 2024: R+25.7 2020: R+19.4 2016: R+14.9 2012: D+14.7 2008: D+21.9
Not yet ingested
- Civics
- —
Market trends
- HPI YoY
- ▲ 3.36%
- Current HPI
- 165.8803
- Rent YoY
- —
- Metro
- —
- State GDP YoY
- ▲ 2.48%
- F500 in state
- 4
Industry mix (Fortune 500 HQ in IA)
| Industry | F500 HQs | Revenue |
|---|---|---|
| Financial Services | 1 | $16B |
|
||
| Retail / Convenience | 1 | $15B |
|
||
Price history
1 event — show timeline
- 2026-05-18 Listed $220,000 NEIRBR as distributed by MLS GRID
Cash-flow waterfall
monthlySold comps — $/sqft
last 12 mo · ≤1 miLoading sold comps…