3716 Canan Dr · Weslaco, TX
Flood risk 1/10 · Minimal
- FEMA flood zone
- X (shaded)
- Chance of flooding over 30 yrs
- 0.0%
- Est. flood insurance / yr
- $507 – $1,088
Fire risk 4/10 · Minor
- Est. fire insurance / yr
- $1,222 – $2,270
Heat risk 9/10 · Severe
- Hot days now (above 111°F)
- 7 days/yr
- Hot days in 30 yrs
- 23 days/yr
Wind risk 8/10 · Major
- Chance of severe wind over 30 yrs
- 99.0%
Air-quality risk 1/10 · Minimal
- Unhealthy air days now
- 0 days/yr
- Unhealthy air days in 30 yrs
- 0 days/yr
Risk factors via First Street. Map © Google.
Why this score? — see what drove the D grade
The composite is a weighted blend of 9 inputs, each scored 0–100. Each bar is that input's sub-score; the figure is the points it added to the 100-point composite (weight × sub-score).
- ARV discount +15.0/15.0
- Cash flow +6.9/30.0
- Appreciation +4.7/10.0
- Livability +3.6/5.0
- Rent growth +2.5/5.0
- Condition / age +2.5/5.0
- Schools +2.2/10.0
- 1% rule +1.8/10.0
- DSCR +1.1/10.0
$205,000
🖨 Deal sheet (PDF) 📄 Offer letter ✓ Due diligence
Listing remarks
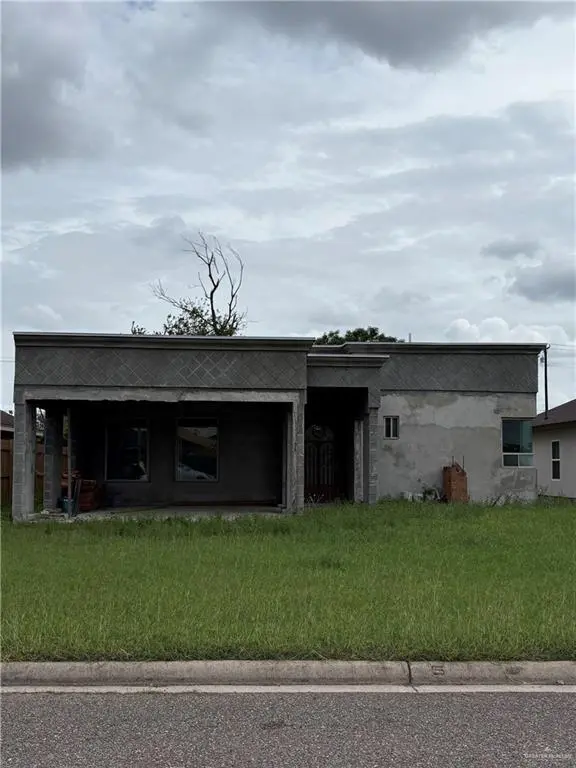
Welcome to 3716 Canan Street in Weslaco, TX—an incredible opportunity to bring your vision to life! This home is approximately 65% complete, with major progress already in place including plumbing and electrical work. Located in a neat, well-maintained community, this property is perfect for investors, builders, or buyers looking to customize their dream home. Skip the early construction stages and finish it your way. Don’t miss the chance to add your personal touch and unlock this home’s full potential!
Key facts
- 6,036 sq ft lot
- Built 2013
- Listed 28 days
Property features AI
Finance
- Other: Lot about 6,037 square feet (0.1386 acres); Directions: From the Expressway (I-2), take the exit toward Westgate Drive. Head north on Westgate Drive, then turn east onto Mile 11 North Road. Continue straight and turn south onto Canan Street. The property at 3716 Canan Street will be on your right.
- HOA & community: No association
Exterior
- Parking: No dedicated parking spaces listed; Other garage or carport configuration
- Utilities: City sewer
- Home design: Single building; Living area recorded by HidalgoCAD
- Construction: Brick construction; Slab foundation; Building area about 1,901 total
- Exterior features: Roof: none; Road surface: other; Public water
Interior
- Kitchen: Other appliance(s); Water heater: none
- Flooring: No flooring specified
- Bathrooms: 3 full bathrooms; 1 half bathroom
- Interior features: Countertops (other); Window coverings (other)
Neighborhood map
What this means for you Summary
Snapshot
- This is a 3-bed/3.5-bath single-family listed at $205k.
Deal economics
- At list price, monthly cash flow is $-311 ($-4k/yr) — negative.
- To cash-flow at today's rent, offer at most $160k (21.9% below list).
- To meet the 1% rule (rent ≥ 1% of price), the offer needs to be $140k (31.7% below list).
- Recommended offer: $140k (31.7% below list) — sets the bar for 1% rule.
Location & tenants
- Location reads 72/100 on livability (#277 in TX) — a middle-class / working-renter tenant base. Strengths: cost of living A+, housing A+, health & safety A+; Watch: employment D+, crime F, amenities F.
- Weslaco ISD (suburban): math 23% / reading 31% proficiency, ranked #705 of 826 in TX (top 85%) — low school quality limits family demand, transient renter base, plan for 1-2y turnover.
- Zoned schools: Cleckler/Heald El (math 20% / reading 22%, grade F, #3,492 of 4,322 statewide, top 81%, 948 students, 82% FRL); Beatriz G Garza Middle (math 26% / reading 37%, grade F, #997 of 1,662 statewide, top 61%, 958 students, 76% FRL); Weslaco H S (math 25% / reading 33%, grade F, #1,147 of 1,632 statewide, top 71%, 2,553 students, 73% FRL) — zoned schools average 77% FRL vs 59% district-wide (17 pts higher); higher-poverty schools than district average — tighter screening recommended.
- Market conditions: 712 active listings in the ZIP; 1 comparable units currently listed for rent nearby; 7,378 units permitted in Hidalgo County in 2024 (641 in 5+ unit buildings).
Forward outlook
- In year one you build about $219 of equity ($1k loan paydown + $-1k appreciation (-0.6% local appreciation)).
- Hidalgo County population projected at +28% by 2050 — long-run rental-demand tailwind backs the buy-and-hold thesis.
Negotiation context
- It's been on market 28 days — a 2% lower offer ($202k) is reasonable based on typical stale-listing flexibility.
Risks & watch-outs
- Climate carrying-cost: severe wind risk, 99% chance of damaging wind over 30y; extreme-heat days projected 7→23/yr by 2055 (HVAC capex compounding) — expect insurance premiums to compound above CPI over the hold.
Questions for the listing agent
- What do current leases actually rent for vs. the listed asking? Can we see a recent rent roll and the last 12 months of T-12 income?
- Is there a deadline driving the sale (1031 exchange, divorce, estate, relocation)? That informs how much negotiation room exists.
- Crime grade is F in this area — have there been break-ins, vandalism, or insurance claims at this property in the last 3 years? What carrier currently insures it and at what premium?
- The area grade is low — what's the realistic commute time and amenity access for the typical tenant pool here? Any planned neighborhood developments (good or bad) we should know about?
- What's the average days-on-market for RENTAL listings here right now (not sales)? A rising rental-DOM trend means longer vacancies and softer asking-rent achievability than the comps imply.
- What's the recent tenant-quality profile in this submarket — average credit score on applications, eviction rate, late-payment / NSF rate, and stable-employment percentage? A property-management company in the area should have these aggregated.
- How much new for-sale + rental construction is in the pipeline within 1–3 miles? Heavy new supply typically softens prices + rents 12–24 months out; constrained supply supports both.
Investment metrics
- 1% rule
- 0.68% ✗
- Cap rate
- 4.47%
- Cash-on-cash
- -6.50%
- DSCR
- 0.71
- GRM
- 12.2
CMA / ARV
- ARV (median comp)
- $254,962
- List price
- $205,000
- Delta
- -19.60%
- Verdict
- UNDERPRICED
- Comps
- 20 within 1.0 mi
Show comp detail 6 sales within ~0.75 mi
| Address | Dist | Beds/Ba | Sqft | Sold | Price | $/sf | Match |
|---|---|---|---|---|---|---|---|
| 816 Samaria St | 0.07mi | 3/2.0 | 1,876 (-1%) | 6mo | $275,000 | $147 | 84 |
| 3820 Canan St | 0.07mi | 4/2.5 (+1) | 1,903 (+0%) | 8mo | $254,999 | $134 | 81 |
| 608 Tierra Prometida St | 0.16mi | 4/2.5 (+1) | 1,945 (+2%) | 1mo | $269,999 | $139 | 79 |
| 1112 Palm Pkwy | 0.31mi | 3/3.5 | 1,836 (-3%) | 9mo | $295,000 | $161 | 72 |
| 3712 Canan Dr | 0.01mi | 3/2.0 | 1,647 (-13%) | 4mo | $265,500 | $161 | 68 |
| 1500 Buen Camino St | 0.62mi | 3/2.5 | 1,640 (-14%) | 12mo | $198,000 | $121 | 34 |
Match score weights: distance 35% · size 25% · config 20% · recency 20%. Top-matched comps best support the ARV.
Projected returns pro-forma
-0.58% appreciation · 3.0% rent growth · sell at horizon
- IRR
- -12.3%
- Equity multiple
- 0.45×
- Total profit
- $-31,328
- Equity at exit
- $53,607
- IRR
- -5.7%
- Equity multiple
- 0.44×
- Total profit
- $-31,904
- Equity at exit
- $59,887
Cash invested: $57,400 (down + closing). Projections, not guarantees.
Landlord ↔ Tenant lean methodology
- Overall (STATE)
- 87 Strongly Landlord-Friendly
- State Texas
- 87 Strongly Landlord-Friendly · R+5
- County
- — inherits STATE
- City
- — inherits STATE
ZIP-level market 78596
- Home prices YoY
- -0.2%
- Active inventory
- 712
- Price-to-rent
- 12.2×
Monthly cashflow live
- Estimated rent
- $1,400 medium interval (Pro) →
- Mortgage (P&I)
- −$1,075
- Tax est. 1.5%
- −$256 /mo · $3,075/yr
- Insurance
- −$85
- HOA
- −$0
- Vacancy / Maint / Mgmt
- −$294
- Net cashflow
- $-311
Break-even live
Sensitivity live
| Price | -10% $-169 | -5% $-240 | +0% $-311 | +5% $-382 | +10% $-452 |
|---|---|---|---|---|---|
| Rent | -10% $-421 | -5% $-366 | +0% $-311 | +5% $-255 | +10% $-200 |
| Rate | -1.0pp $-207 | -0.5pp $-259 | base $-311 | +0.5pp $-364 | +1.0pp $-418 |
UW: 25.0% down · 7.5% · 30yr · 1.5% tax · 5.0% vac · 8.0% maint · 8.0% mgmt
Financing live
Cash to close
- Down payment
- $51,250
- Closing costs
- $6,150
- Reserves months
- —
- Total cash needed
- —
Loan-product check · same deal, 3 products live
Conventional
25% down · 7.5% · 30yr
- Down + closing
- —
- Monthly P&I
- —
- Monthly cashflow
- —
- DSCR
- —
- Eligible?
- —
Personal DTI + credit; lowest rate.
DSCR
20% down · 8.5% · 30yr
- Down + closing
- —
- Monthly P&I
- —
- Monthly cashflow
- —
- DSCR
- —
- Eligible?
- —
No personal income docs; deal must DSCR.
Hard money
10% down · 12.0% · 12mo
- Down + closing
- —
- Monthly P&I
- —
- Monthly cashflow
- —
- DSCR
- —
- Eligible?
- —
Short-term bridge; refi at stabilization.
Rent comps 1 comps
| Address | Beds | Baths | Sqft | Rent | $/sqft | DOM | Units | Dist |
|---|---|---|---|---|---|---|---|---|
| 37 Mesquite Ln Unit 37A Mercedes, TX | 4.0 | 2.0 | 2048 | $1,400 | $0.68 | 45d | 1 | 0.46mi |
Listing history 2 events
-
2026-05-12historical Option 527-char remark
-
2026-04-23$205,000 Active 527-char remark
ⓘ Source: listings_history table (triggers on properties + properties_extension) + one-shot
backfill from property_details.listing_events for pre-trigger history.
Climate risk First Street
- Flood 1/10 Low FEMA zone X (shaded) · 0% chance over 30 yrs
- Wildfire 4/10 Moderate
- Heat 9/10 Extreme 7 d/yr ≥111°F today · 23 d/yr by 30 yrs out
- Wind 8/10 Severe 99% chance of damaging wind over 30 yrs
- Air quality 1/10 Low 0 unhealthy d/yr today · 0 by 30 yrs out
Nearby sold comps map
Loading sold comps map…
Walkable amenities ~0.75 mi
Loading nearby amenities…
Taxation est. · year 1
- Rental income
- $16,800
- − Mortgage interest
- −$11,483
- − Property taxes
- −$3,075
- − Insurance
- −$1,025
- − Repairs & maintenance
- −$1,344
- − Management
- −$1,344
- − Depreciation
- −$5,964
- Taxable loss
- −$7,435
- Est. tax savings @ 24.0%
- +$1,784
- After-tax cash flow
- $-1,944/yr
For passive investors: Depreciation is non-cash, so a rental often shows a tax loss while cash-flowing — sheltering income. Rental losses are passive: they offset passive income freely, and up to $25,000/yr can offset ordinary (W-2) income if you actively participate and your MAGI is under $100k (phasing out to $0 by $150k); unused losses carry forward. On sale, claimed depreciation is recaptured at up to 25%, and gains may owe capital-gains tax (a 1031 exchange can defer both). Figures are a year-1 estimate at your 24.0% rate — not tax advice; consult a CPA.
Schools (NCES district)
- District
- Weslaco ISD
- NCES district ID
- 4844960
- Math proficiency
- 23% ▼ -29.00%
- Reading proficiency
- 31% ▼ -9.00%
- Median HH income
- $32,867
- Composite
- 22.05/100
- National rank
- #8196
- State rank
- #705 of 826 in TX
Livability — Weslaco
- Score
- 72/100
- State rank
- #277
- US rank
- #6469
Category grades
Schools grade is shown separately in the Schools card above.
Census & demographics
- Census place
- Weslaco, TX
- Population (ZIP)
- 38,942
Population outlook (Hidalgo County) Hauer SSP2
- Today (2025)
- 955,232 people
- By 2030
- 1,009,774 · +5.7%
- By 2040
- 1,120,332 · +17.3%
- By 2050
- 1,225,036 · +28.2%
- By 2075
- 1,439,189 · +50.7%
- By 2100
- 1,533,429 · +60.5%
Race, ethnicity, and origin ACS 2023
- Neighborhood character
- Predominantly Hispanic (86%)
- Race & ethnicity
- Hispanic / Latino 86% Two or more races 38% White 13%
- Hispanic origin (detail)
- Mexican 82%
- Common ancestry
- Slovak 1%
- Foreign-born
- 17% · Canada
- Languages at home
- 27% English-only · Spanish 72%
Political lean MEDSL · Hidalgo
- 2024 margin
- Toss-up / Even · D 48.1% · R 51.0%
- 2008→2024 swing
- -41.6pp toward R · 2008: 38.7pp · 2024: -2.9pp
- All cycles
- 2024: R+2.9 2020: D+17.1 2016: D+40.5 2012: D+41.8 2008: D+38.7
Not yet ingested
- Civics
- —
Market trends
- HPI YoY
- ▼ -0.58%
- Current HPI
- 261.5117
- Rent YoY
- —
- Metro
- —
- State GDP YoY
- ▲ 3.95%
- F500 in state
- 110
Industry mix (Fortune 500 HQ in TX)
| Industry | F500 HQs | Revenue |
|---|---|---|
| Energy | 16 | $1,198B |
|
||
| Technology | 5 | $198B |
|
||
| Engineering / Construction | 4 | $72B |
|
||
| Energy Services | 3 | $60B |
|
||
| Utilities | 3 | $41B |
|
||
| Healthcare | 2 | $330B |
|
||
Price history
4 events — show timeline
- 2026-06-08 Sold (MLS) — MCALLENMLS
- 2026-05-22 Pending — MCALLENMLS
- 2026-05-12 Contingent — MCALLENMLS
- 2026-04-23 Listed $205,000 MCALLENMLS
Cash-flow waterfall
monthlySold comps — $/sqft
last 12 mo · ≤1 miLoading sold comps…