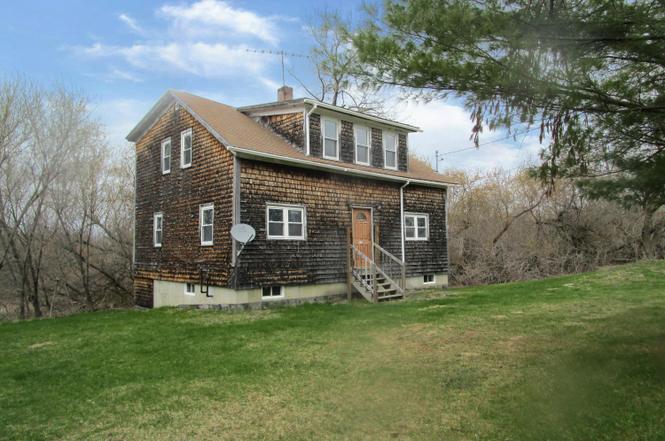
121 Stage Rd · Etna, ME
Flood risk No data
- FEMA flood zone
- —
- Chance of flooding over 30 yrs
- —
- Est. flood insurance / yr
- —
Fire risk No data
- Est. fire insurance / yr
- —
Heat risk No data
- Hot days now (above threshold)
- —
- Hot days in 30 yrs
- —
Wind risk No data
- Chance of severe wind over 30 yrs
- —
Air-quality risk No data
- Unhealthy air days now
- —
- Unhealthy air days in 30 yrs
- —
Risk factors via First Street. Map © Google.
Why this score? — see what drove the B- grade
The composite is a weighted blend of 9 inputs, each scored 0–100. Each bar is that input's sub-score; the figure is the points it added to the 100-point composite (weight × sub-score).
- Cash flow +25.5/30.0
- DSCR +8.4/10.0
- ARV discount +7.5/15.0
- 1% rule +6.7/10.0
- Schools +6.4/10.0
- Appreciation +5.3/10.0
- Rent growth +2.5/5.0
- Livability +2.5/5.0
- Condition / age +2.5/5.0
$139,900
🖨 Deal sheet 📄 Offer letter ✓ Due diligence
Listing remarks
1900 modified cape with dormer on 22 mostly wooded acres. Three bedrooms with one full and one half bath. Sits on full foundation. See attached reports. This is a Fannie Mae Homepath property.
Key facts
- 22 acre lot
- Built 1900
- Listed 2 days
Property features AI
Finance
- Financial info: Annual tax information available
Exterior
- Parking: On-site parking on gravel
- Utilities: Well water; Private sewer; Electric service with circuit breakers
- Home design: Single family residence; Facing direction: Not specified; Entry level details not specified
- Construction: Wood frame construction with shingle siding; Shingle roof; Built in 1900
- Exterior features: Rural, level, wooded setting
Interior
- Kitchen: Kitchen on first level
- Bedrooms: Bedroom 1 (first level); Bedroom 2 (second level); Bedroom 3 (second level)
- Flooring: Wood flooring; Linoleum flooring
- Bathrooms: 1 full bathroom; 1 half bathroom
- Heating & cooling: Forced air heating
- Interior features: Unfurnished; 6 total rooms; Full, unfinished basement with interior entry
- Laundry & utility: Electric water heater
Neighborhood map
What this means for you Summary
Snapshot
- This is a 3-bed/1.5-bath other listed at $140k.
Deal economics
- At list price, monthly cash flow is $325 ($4k/yr) — positive.
- The deal already cash-flows at list — no discount required.
- Meets the 1% rule at list price ($2k rent vs $140k).
Location & tenants
- Location reads: area grade B — affects rentability + tenant quality, not the cash-flow math above.
- RSU 19 (rural): math 73% / reading 81% proficiency, ranked #96 of 112 in ME (top 86%) — strong family-tenant draw, lease renewals of 3-5y typical.
- Market conditions: 10 active listings in the ZIP; 440 units permitted in Penobscot County in 2024 (40 in 5+ unit buildings).
Forward outlook
- In year one you build about $2k of equity ($967 loan paydown + $817 appreciation (0.6% local appreciation)).
- Penobscot County population projected at -17% by 2050 — secular population decline; favor cash flow + early exit over multi-decade hold.
- At projected returns (0.6% appreciation + 3.0% rent growth), your $39k cash investment doubles in ~6 years — after that, you're playing with house money.
Negotiation context
- Only 2 days on market — expect competitive offers; lowballing is unlikely to land.
Risks & watch-outs
- Watch-outs: built in 1900 — expect roof / HVAC / electrical / plumbing capex.
Questions for the listing agent
- Built in 1900 — when were the roof, HVAC, electrical panel, plumbing, and water heater last replaced?
- Is there a deadline driving the sale (1031 exchange, divorce, estate, relocation)? That informs how much negotiation room exists.
- What's the average days-on-market for RENTAL listings here right now (not sales)? A rising rental-DOM trend means longer vacancies and softer asking-rent achievability than the comps imply.
- What's the recent tenant-quality profile in this submarket — average credit score on applications, eviction rate, late-payment / NSF rate, and stable-employment percentage? A property-management company in the area should have these aggregated.
- How much new for-sale + rental construction is in the pipeline within 1–3 miles? Heavy new supply typically softens prices + rents 12–24 months out; constrained supply supports both.
Investment metrics
- 1% rule
- 1.17% ✓
- Cap rate
- 9.08%
- Cash-on-cash
- 9.95%
- DSCR
- 1.44
- GRM
- 7.1
CMA / ARV
No comps found within radius.
Projected returns pro-forma
0.58% appreciation · 3.0% rent growth · sell at horizon
- IRR
- 10.6%
- Equity multiple
- 1.52×
- Total profit
- $20,514
- Equity at exit
- $44,757
- IRR
- 14.8%
- Equity multiple
- 2.72×
- Total profit
- $67,478
- Equity at exit
- $57,222
Cash invested: $39,172 (down + closing). Projections, not guarantees.
Landlord ↔ Tenant lean methodology
- Overall (STATE)
- 41 Moderately Tenant-Leaning
- State Maine
- 41 Moderately Tenant-Leaning · D+2
- County
- — inherits STATE
- City
- — inherits STATE
ZIP-level market 04434
- Home prices YoY
- 0.4%
- Active inventory
- 10
- Price-to-rent
- 7.1×
Monthly cashflow live
- Estimated rent
- $1,642 medium interval (Pro) →
- Mortgage (P&I)
- −$734
- Tax from tax record
- −$180 /mo · $2,160/yr
- Insurance
- −$58
- HOA
- −$0
- Vacancy / Maint / Mgmt
- −$345
- Net cashflow
- $325
Break-even live
UW: 25.0% down · 7.5% · 30yr · 1.5% tax · 5.0% vac · 8.0% maint · 8.0% mgmt
Financing live
Cash to close
- Down payment
- $34,975
- Closing costs
- $4,197
- Reserves months
- —
- Total cash needed
- —
Loan-product check · same deal, 3 products live
Conventional
25% down · 7.5% · 30yr
- Down + closing
- —
- Monthly P&I
- —
- Monthly cashflow
- —
- DSCR
- —
- Eligible?
- —
Personal DTI + credit; lowest rate.
DSCR
20% down · 8.5% · 30yr
- Down + closing
- —
- Monthly P&I
- —
- Monthly cashflow
- —
- DSCR
- —
- Eligible?
- —
No personal income docs; deal must DSCR.
Hard money
10% down · 12.0% · 12mo
- Down + closing
- —
- Monthly P&I
- —
- Monthly cashflow
- —
- DSCR
- —
- Eligible?
- —
Short-term bridge; refi at stabilization.
Listing history 3 events
-
2026-06-18days on market $139,900 Active 2 DOM
-
2026-06-17remarks 192-char remark
-
2026-06-17$139,900 Active 1 DOM
ⓘ Source: listings_history table (triggers on properties + properties_extension) + one-shot
backfill from property_details.listing_events for pre-trigger history.
Tax reassessment forecast ME · Partial reset (capped growth)
- Current annual tax
- $2,160 · $180/mo
- Projected year-2 tax
- $2,160 · $180/mo
- Expected delta
- $0/yr ($0/mo · 0.0%)
ⓘ Screening estimate from a state-policy table — verify with the county assessor before closing.
Nearby sold comps map
Loading sold comps map…
Walkable amenities ~0.75 mi
Loading nearby amenities…
Taxation est. · year 1
- Rental income
- $19,699
- − Mortgage interest
- −$7,837
- − Property taxes
- −$2,160
- − Insurance
- −$700
- − Repairs & maintenance
- −$1,576
- − Management
- −$1,576
- − Depreciation
- −$4,070
- Taxable income
- $1,781
- Est. tax owed @ 24.0%
- −$427
- After-tax cash flow
- $3,471/yr
For passive investors: Depreciation is non-cash, so a rental often shows a tax loss while cash-flowing — sheltering income. Rental losses are passive: they offset passive income freely, and up to $25,000/yr can offset ordinary (W-2) income if you actively participate and your MAGI is under $100k (phasing out to $0 by $150k); unused losses carry forward. On sale, claimed depreciation is recaptured at up to 25%, and gains may owe capital-gains tax (a 1031 exchange can defer both). Figures are a year-1 estimate at your 24.0% rate — not tax advice; consult a CPA.
Schools (NCES district)
- District
- RSU 19
- NCES district ID
- 2314785
- Math proficiency
- 73% ▲ 53.00%
- Reading proficiency
- 81% ▲ 39.00%
- Median HH income
- $41,866
- Composite
- 64.37/100
- National rank
- #548
- State rank
- #96 of 112 in ME
Livability — Etna
No livability data for this city. (Only ~50 U.S. cities are tracked.)
Census & demographics
- Population (ZIP)
- 1,245
Population outlook (Penobscot County) Hauer SSP2
- Today (2025)
- 149,928 people
- By 2030
- 146,386 · -2.4%
- By 2040
- 135,952 · -9.3%
- By 2050
- 123,864 · -17.4%
- By 2075
- 97,825 · -34.8%
- By 2100
- 77,196 · -48.5%
Race, ethnicity, and origin ACS 2023
- Neighborhood character
- Predominantly White (94%)
- Race & ethnicity
- White 94% Hispanic / Latino 3% Two or more races 2%
- Common ancestry
- Lithuanian 11% Slovak 5% Scottish 2%
- Foreign-born
- 1%
- Languages at home
- 96% English-only · Spanish 2%
Political lean MEDSL · Penobscot
- 2024 margin
- R (+10.9) · D 43.6% · R 54.5% · Other 1.9%
- 2008→2024 swing
- -15.9pp toward R · 2008: 5.0pp · 2024: -10.9pp
- All cycles
- 2024: R+10.9 2020: R+8.3 2016: R+10.9 2012: D+2.9 2008: D+5.0
Not yet ingested
- Civics
- —
Market trends
- HPI YoY
- ▲ 0.58%
- Current HPI
- 140.2006
- Rent YoY
- —
- Metro
- —
- State GDP YoY
- —
- F500 in state
- 0
Price history
1 event — show timeline
- 2026-06-16 Listed $139,900 MREIS
Property tax history
+2.0%/yrLatest (2025): $2,160 · +12.1% YoY. Source: county tax records.
Cash-flow waterfall
monthlySold comps — $/sqft
last 12 mo · ≤1 miLoading sold comps…